Coming Soon
The Weekend Visual ChartBook is currently undergoing a massive upgrade. Stay tuned for a world-class reading experience.
Return HomeWeekend Visual ChartBook
Edition #269
Extracted Edition
Market Pulse
LiveReal-time index prices above. Detailed index chart analysis below in the Indices section.
Bullish Charts [F&O]
Breakout and momentum setups from the F&O universe
Dabur India Ltd
bullish fnoDouble Bottom Breakout
Daily Chart
Thesis & Analysis
No detailed thesis provided for this setup.
Price Action
- ■Price action is structurally positive.
- ■Forming higher highs and higher lows.
Volume Profile
- ■Volume is supportive of the price action.
- ■Wait for volume expansion on breakout.
Key Levels
No zones specified
No zones specified
Invalidation Scenario
A weekly close below the support level invalidates this structure.
DABUR INDIA LTD
bullish fnoRecent candles are compressing into smaller bodies with higher closes, showing the market’s
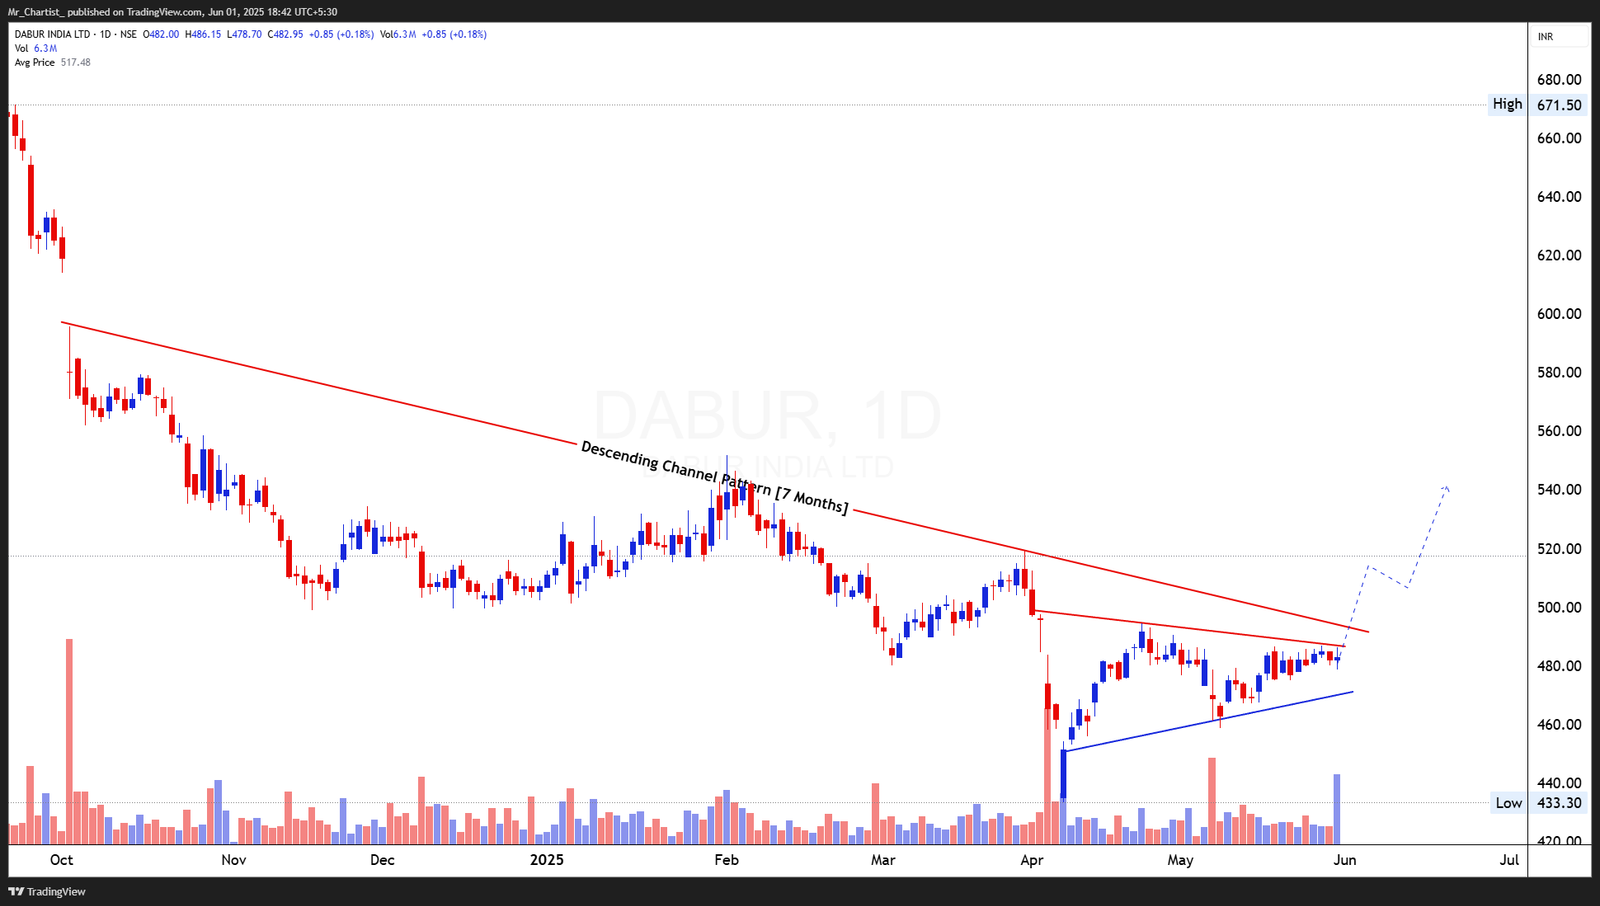
Symmetrical Triangle Pattern within Descending Channel [7
Thesis & Analysis
Months] Price Action Overview: Dabur has been forming a symmetrical triangle over the past two months, carved out within a broader 7-month descending channel. This contraction of price action—with rising lows and flat-to-declining highs—indicates growing bullish pressure despite the long-term downtrend. The current structure represents a classic trend reversal setup forming near the upper boundary of the larger channel. The stock has recently approached the apex of this triangle and is now pressing against the immediate trendline resistance around ₹490. The overall pattern carries a bullish bias, especially with the series of higher lows and momentum building near resistance, suggesting a potential breakout from both the triangle and the channel. Candlestick Pattern: Recent candles are compressing into smaller bodies with higher closes, showing the market’s coiling nature before a breakout. Friday’s session ended with a subtle bullish tone but lacked a definitive breakout candle. Volume Analysis: Volume has begun to expand subtly, particularly on up-days, with the most recent session showing a moderate spike. This is encouraging and hints at accumulation. A volume surge on breakout above ₹490 would confirm bullish intent and strengthen the case for a trend reversal. 2. Crucial Support and Resistance Levels Support Levels: ₹470: Dynamic support line of the symmetrical triangle. ₹455: Minor base formed during mid-May. ₹433: April swing low and long-term structural support. Resistance Levels: ₹490: Key breakout point for the triangle and channel. ₹510: Immediate post-breakout resistance. ₹540: Major prior swing high; broader trend target if breakout sustains. 3. Strategic Trade Scenarios Bullish Scenario (Bias View): A clean breakout above ₹490/500 with strong volume would confirm the symmetrical triangle breakout and signal a reversal of the multi-month downtrend. The setup favors a rally toward ₹510 initially, with potential extension toward ₹540 over the short to medium term. The higher low formation and compressing structure are strongly supportive of this bias. Pullback Scenario: If the breakout attempt stalls, price may retest ₹470 before making a renewed breakout attempt. As long as the structure of higher lows remains intact above ₹455, the bullish outlook remains valid.
Price Action
- ■Price action is structurally positive.
- ■Forming higher highs and higher lows.
Volume Profile
- ■Volume is supportive of the price action.
- ■Wait for volume expansion on breakout.
Key Levels
No zones specified
No zones specified
Invalidation Scenario
A weekly close below the support level invalidates this structure.
HDFC Bank Ltd
bullish fnoDouble Bottom Breakout
Daily Chart
Thesis & Analysis
No detailed thesis provided for this setup.
Price Action
- ■Price action is structurally positive.
- ■Forming higher highs and higher lows.
Volume Profile
- ■Volume is supportive of the price action.
- ■Wait for volume expansion on breakout.
Key Levels
No zones specified
No zones specified
Invalidation Scenario
A weekly close below the support level invalidates this structure.
HDFC BANK LTD
bullish fnoRecent candles are smaller-bodied and within a tightening range, consistent with classic
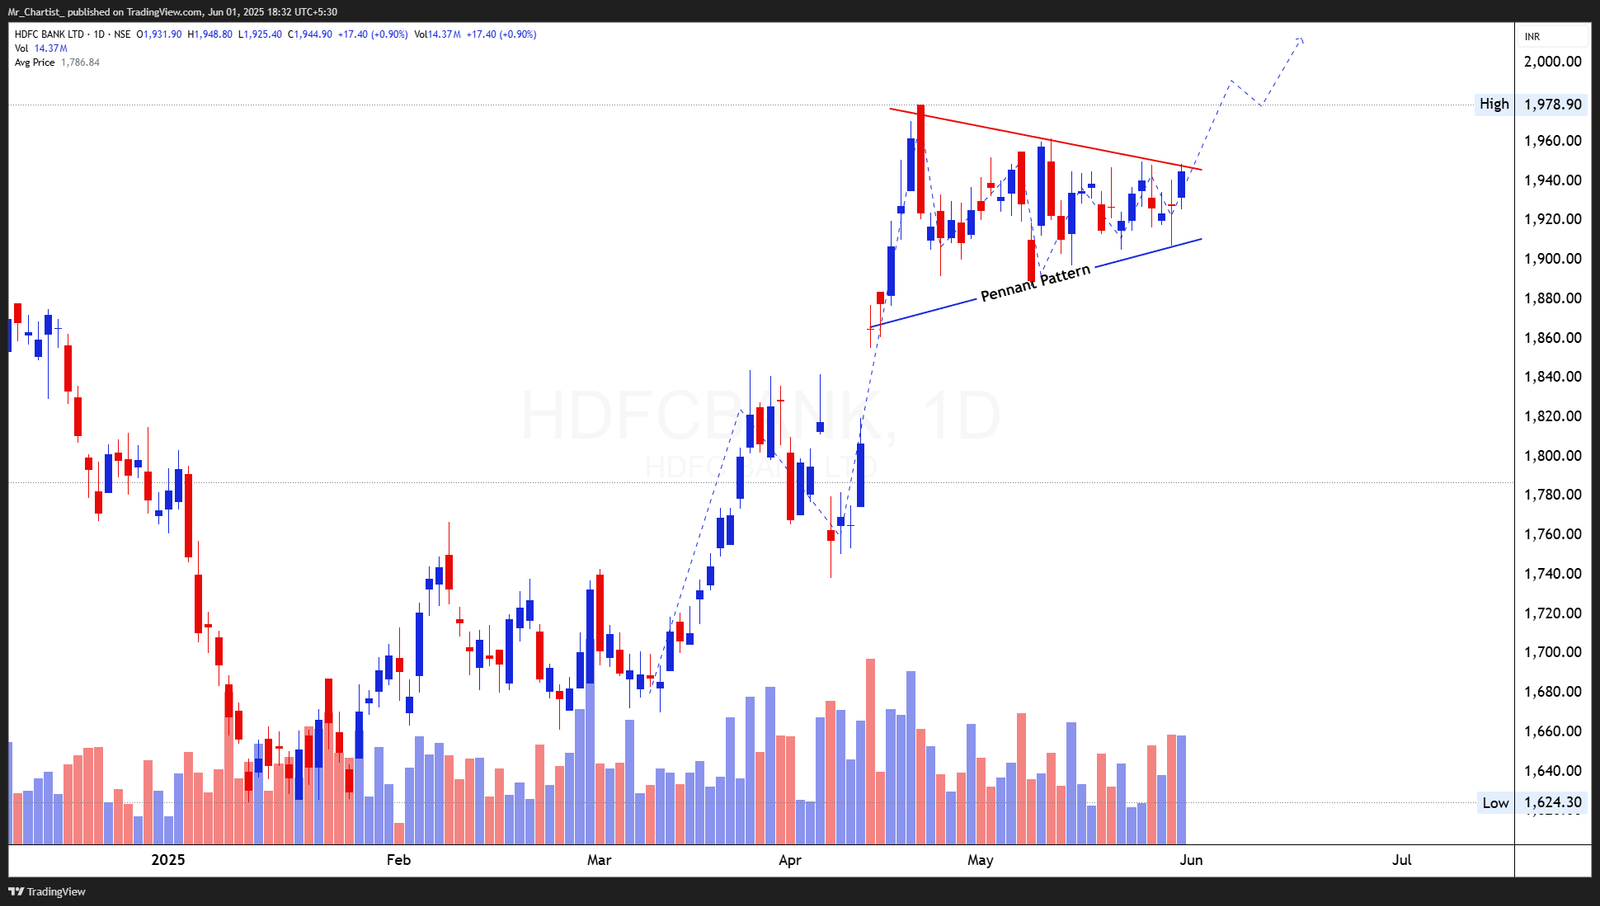
Pennant Pattern [1 Month]
Thesis & Analysis
Price Action Overview: HDFC Bank has been consolidating in a bullish pennant formation for the past month following a strong vertical rally from the ₹1,740 zone in April. The pattern has formed on a clear upward flagpole, making it a textbook continuation structure. Price action is now tightening near the upper boundary of the pennant, suggesting rising bullish pressure ahead of a potential breakout. The consolidation remains constructive, with higher lows forming along the lower boundary and a series of controlled pullbacks within the structure. The price is now approaching the breakout zone near ₹1,960, and the coiling behavior indicates strong potential for continuation toward higher levels. Candlestick Pattern: Recent candles are smaller-bodied and within a tightening range, consistent with classic pennant behavior. No rejection candles or distribution wicks are evident, supporting the bullish bias. Volume Analysis: Volume surged during the pole formation and has since contracted inside the pennant, aligning well with expectations. A spike in volume above the ₹1,960 resistance would provide strong confirmation of breakout strength. 2. Crucial Support and Resistance Levels Support Levels: ₹1,920: Immediate lower trendline support of the pennant. ₹1,880: Mid-flag structural support; base from late May. ₹1,840: Previous pivot high before breakout; trend-defining level. Resistance Levels: ₹1,960: Pennant upper boundary and near-term breakout trigger. ₹1,978.90: Recent swing high; minor hurdle post-breakout. ₹2,040–2,060: Projected breakout zone based on measured move from the pole. 3. Strategic Trade Scenarios Bullish Scenario (Bias View): A breakout above ₹1,960 on strong volume would activate the bullish pennant continuation, setting up a short-term target zone of ₹2,040–2,060. The current setup remains well-structured and constructive, favoring upward continuation while the pattern holds. Pullback Scenario: If the price dips below ₹1,920, the pennant remains valid but would require a bullish bounce to maintain structure. Only a breakdown below ₹1,880 would threaten the bullish outlook and shift the bias to neutral.
Price Action
- ■Price action is structurally positive.
- ■Forming higher highs and higher lows.
Volume Profile
- ■Volume is supportive of the price action.
- ■Wait for volume expansion on breakout.
Key Levels
No zones specified
No zones specified
Invalidation Scenario
A weekly close below the support level invalidates this structure.
ICICI Lombard GIC Ltd
bullish fnoDouble Bottom Breakout
Daily Chart
Thesis & Analysis
No detailed thesis provided for this setup.
Price Action
- ■Price action is structurally positive.
- ■Forming higher highs and higher lows.
Volume Profile
- ■Volume is supportive of the price action.
- ■Wait for volume expansion on breakout.
Key Levels
No zones specified
No zones specified
Invalidation Scenario
A weekly close below the support level invalidates this structure.
ICICI LOMBARD GIC LTD
bullish fnoRecent candles reflect strength, with three consecutive higher closes and increasing real body
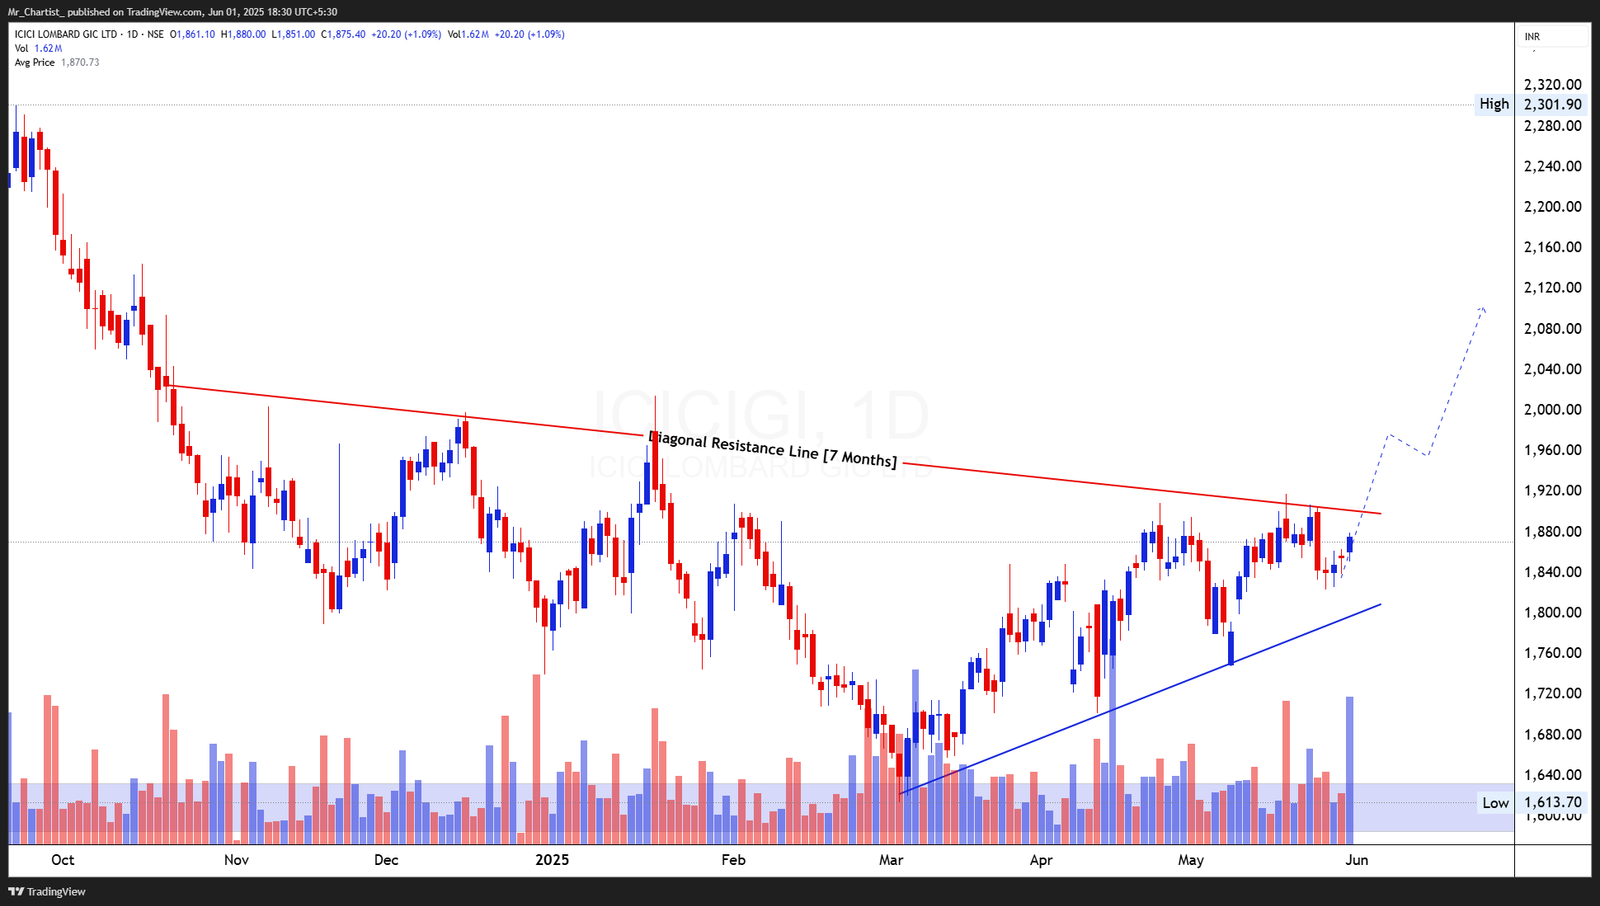
Symmetrical Triangle Pattern approaching Diagonal
Thesis & Analysis
Resistance [7 Months] Price Action Overview: ICICI Lombard is approaching a significant 7-month falling trendline, which has acted as a dynamic resistance since October 2024. Over the past three months, the stock has carved out a symmetrical triangle with rising support and lower highs compressing into a tight apex just beneath the resistance line. This confluence of structural pressure and base-building signals a developing bullish setup. The price has recently bounced strongly off the rising support line and is now heading toward the breakout zone around ₹1,890–1,900. With increasing price compression and steady upward momentum, a breakout above the diagonal resistance could trigger a structural reversal of the broader downtrend. Candlestick Pattern: Recent candles reflect strength, with three consecutive higher closes and increasing real body size. No signs of rejection at the upper boundary yet—suggesting bulls are preparing for a push above resistance. Volume Analysis: Volume has notably expanded during the recent bounce from the triangle's support zone, indicating early accumulation. If volume exceeds 2M on a breakout, it would provide strong confirmation for directional move toward higher levels. 2. Crucial Support and Resistance Levels Support Levels: ₹1,835: Triangle’s mid-range level and recent pivot. ₹1,780: Rising support trendline and prior swing low. ₹1,640: Structural low from March; breakdown invalidation point. Resistance Levels: ₹1,890–1,900: Immediate breakout zone (triangle + diagonal resistance). ₹1,960: Next resistance after breakout; prior swing high. ₹2,080–2,120: Target zone from pattern breakout projection. 3. Strategic Trade Scenarios Bullish Scenario (Bias View): A breakout above ₹1,900 with strong bullish momentum and volume exceeding 2M would confirm the symmetrical triangle breakout and suggest the beginning of a trend reversal. Target zones lie at ₹1,960 and ₹2,080–2,120 in the short to medium term. The rising support base keeps the setup favorably biased toward the upside. Pullback Scenario: If the breakout stalls, price may retest ₹1,835 or even ₹1,780. However, unless the stock breaches ₹1,780 decisively, the structure remains constructive and valid for a bullish breakout attempt.
Price Action
- ■Price action is structurally positive.
- ■Forming higher highs and higher lows.
Volume Profile
- ■Volume is supportive of the price action.
- ■Wait for volume expansion on breakout.
Key Levels
No zones specified
No zones specified
Invalidation Scenario
A weekly close below the support level invalidates this structure.
Bank of India
bullish fnoDouble Bottom Breakout
Daily Chart
Thesis & Analysis
No detailed thesis provided for this setup.
Price Action
- ■Price action is structurally positive.
- ■Forming higher highs and higher lows.
Volume Profile
- ■Volume is supportive of the price action.
- ■Wait for volume expansion on breakout.
Key Levels
No zones specified
No zones specified
Invalidation Scenario
A weekly close below the support level invalidates this structure.
BANK OF INDIA
bullish fnoRecent sessions have posted bullish candles with minor wicks and expanding real bodies—
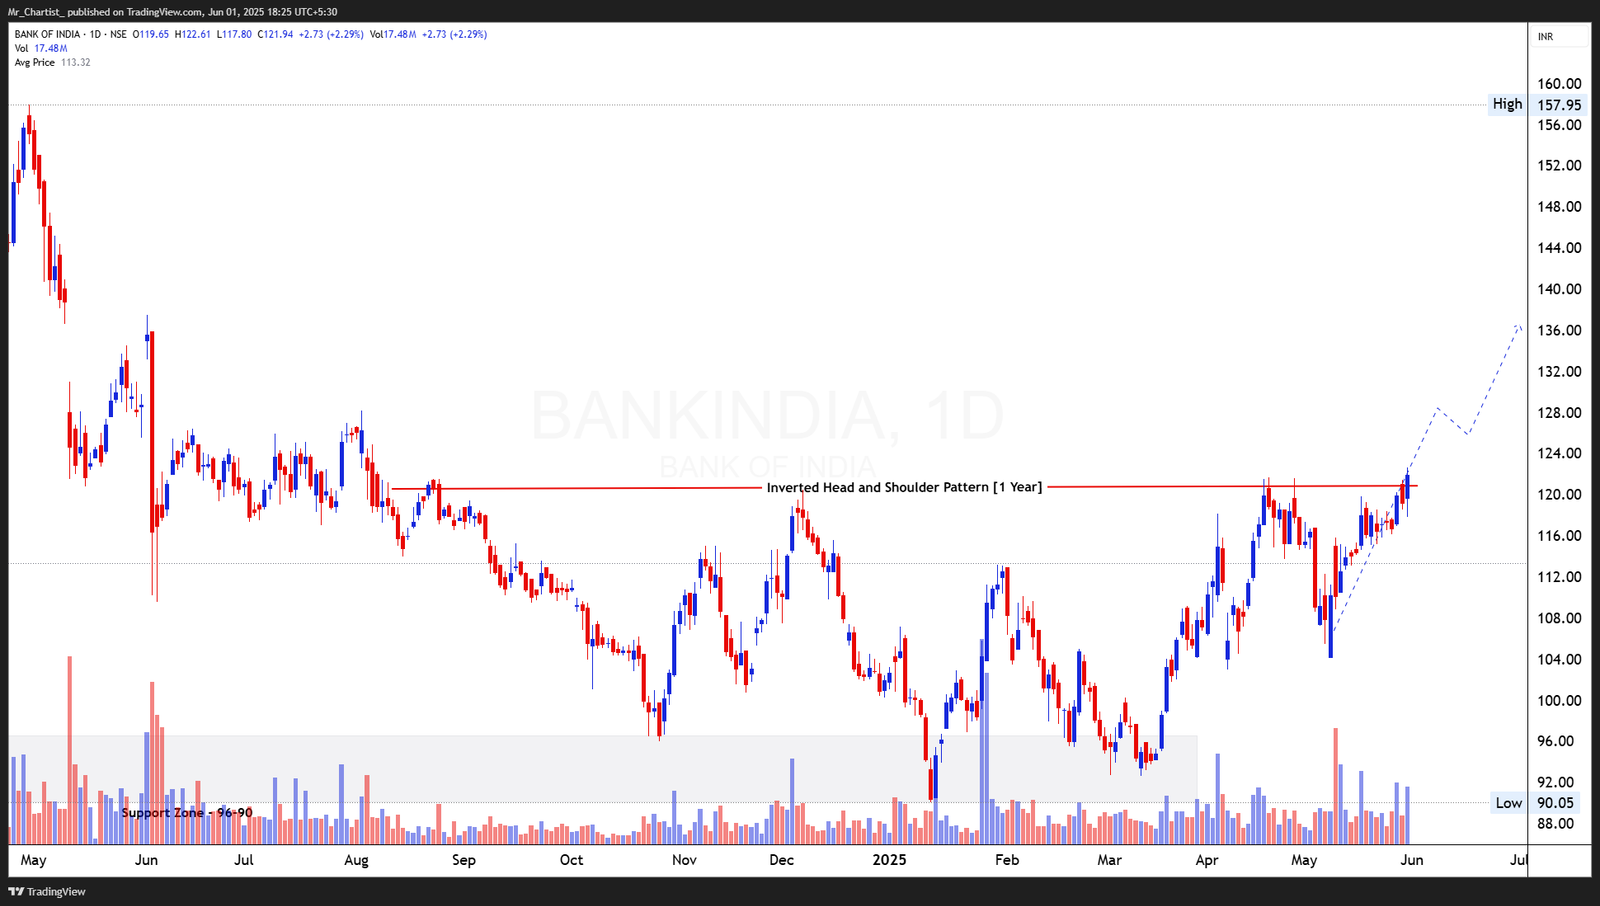
Inverted Head and Shoulder Pattern [1 Year]
Thesis & Analysis
Price Action Overview: Bank of India is displaying a well-developed inverted head and shoulder pattern, with a formation base extending over the past 12 months. The neckline resistance is situated at ₹122, which has been tested multiple times over the past few months without a decisive breakout. The recent rally from the ₹105 region has come with strong momentum, pushing the price toward the neckline with increasing volume and bullish intent. The pattern has a clearly defined left shoulder (June–Sept 2024), head (Dec 2024–Feb 2025), and right shoulder (April–May 2025), followed by a sharp ascending trendline leading to the neckline. The price is now hovering just below the breakout zone, setting up for a potential long-term reversal if the neckline is crossed. Candlestick Pattern: Recent sessions have posted bullish candles with minor wicks and expanding real bodies— evidence of growing momentum. There is no indication of reversal or selling exhaustion, favoring continuation. Volume Analysis: Volume has risen in tandem with the recent price ascent, indicating accumulation near the neckline. A volume surge above 18M on breakout would validate the inverted H&S structure and confirm breakout strength. 2. Crucial Support and Resistance Levels Support Levels: ₹116: Rising trendline support from right shoulder base. ₹108: Last pullback level before breakout push. ₹96–90: Strong multi-month base and neckline support of the head. Resistance Levels: ₹122: Neckline of the inverted head and shoulder; key breakout point. ₹128–130: Minor resistance from May 2023 price memory. ₹136–140: Measured breakout target based on pattern projection. 3. Strategic Trade Scenarios Bullish Scenario (Bias View): A confirmed close above ₹122 with strong volume would mark a long-term breakout from the inverted head and shoulder structure. This move would likely set a new bullish tone with upside potential toward ₹130 and ₹136–140. The current trajectory and rising volume support this scenario. Pullback Scenario: If the price faces rejection at ₹122, a pullback toward ₹116 could serve as a healthy retest. As long as the price holds above ₹108, the bullish structure remains intact.
Price Action
- ■Price action is structurally positive.
- ■Forming higher highs and higher lows.
Volume Profile
- ■Volume is supportive of the price action.
- ■Wait for volume expansion on breakout.
Key Levels
No zones specified
No zones specified
Invalidation Scenario
A weekly close below the support level invalidates this structure.
Pidilite Industries Ltd
bullish fnoDouble Bottom Breakout
Daily Chart
Thesis & Analysis
No detailed thesis provided for this setup.
Price Action
- ■Price action is structurally positive.
- ■Forming higher highs and higher lows.
Volume Profile
- ■Volume is supportive of the price action.
- ■Wait for volume expansion on breakout.
Key Levels
No zones specified
No zones specified
Invalidation Scenario
A weekly close below the support level invalidates this structure.
PIDILITE INDUSTRIES LTD
bullish fnoToday’s large bullish candle signals a strong reversal from the handle base and a clear
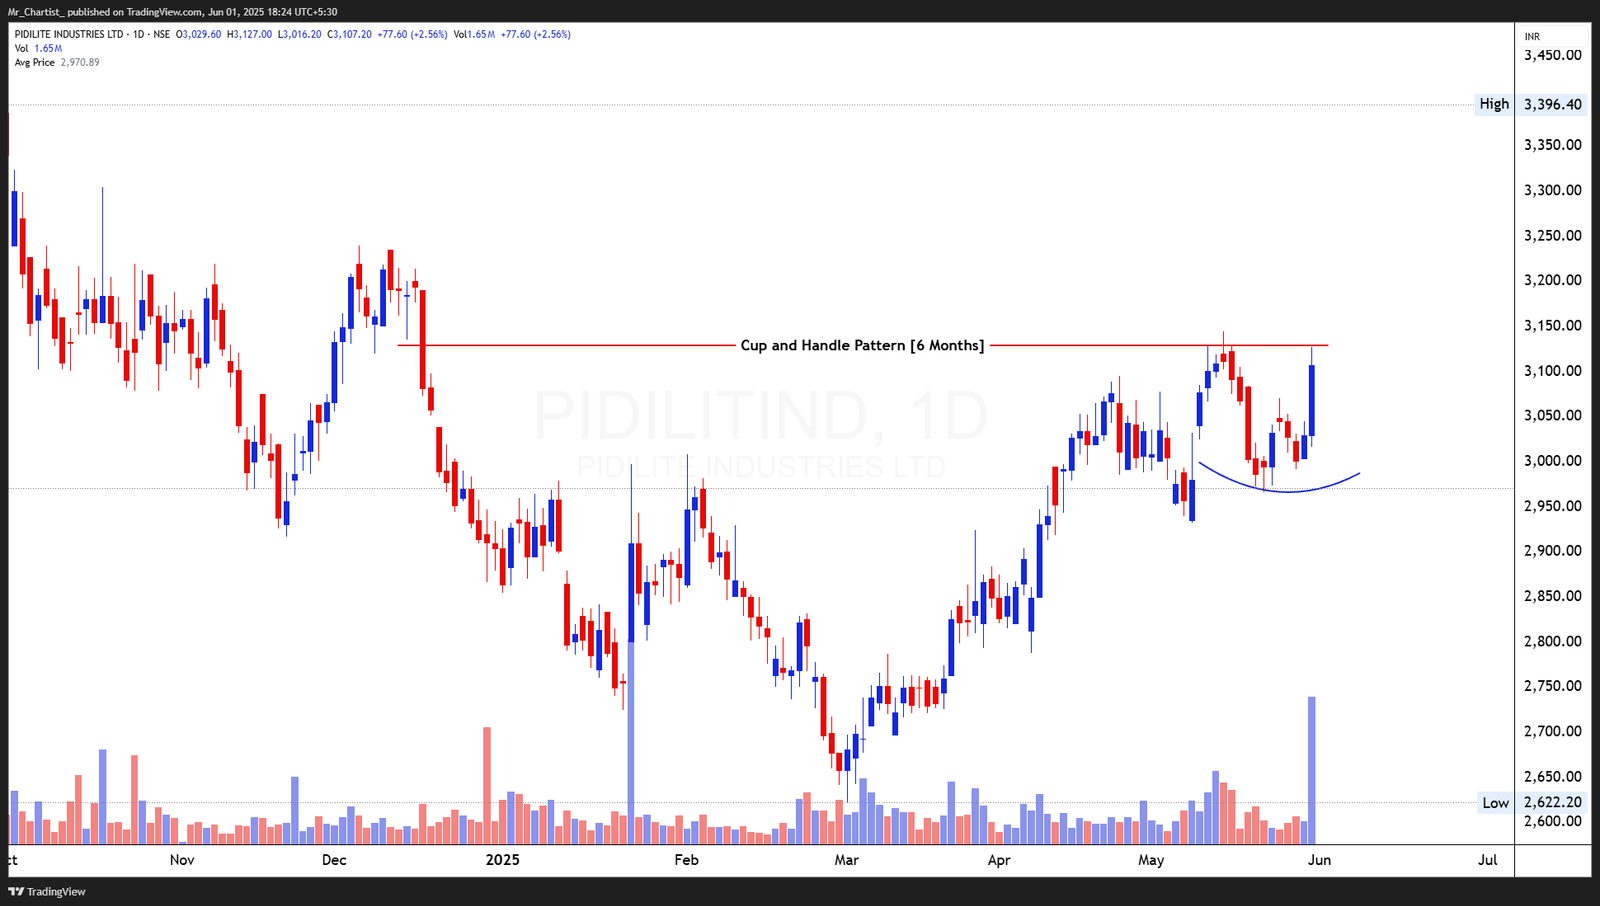
Cup and Handle Pattern [6 Months]
Thesis & Analysis
Price Action Overview: Pidilite is currently exhibiting a bullish cup and handle pattern, formed over the last 6 months. The cup was shaped between December 2024 and April 2025, with a smooth, rounded bottom indicative of accumulation. This was followed by a shallow corrective phase in May, forming the handle and maintaining the overall bullish structure. The price has now surged to the neckline region at ₹3,150, showing early signs of potential breakout. The structure remains well-aligned with classic breakout setups—rounded consolidation, minor retracement, and sharp upward drive toward resistance. Price is currently testing this zone with rising momentum, setting the stage for a breakout that could activate a medium-term rally. Candlestick Pattern: Today’s large bullish candle signals a strong reversal from the handle base and a clear attempt to break the neckline. The candle closed near day’s high with above-average range and no upper wick, indicating buyer dominance. Volume Analysis: Volume has expanded significantly during today’s move, suggesting strong demand at the neckline. This volume behavior is typical of pre-breakout stages and supports the bullish continuation bias. 2. Crucial Support and Resistance Levels Support Levels: ₹3,030: Handle base and immediate support for continuation. ₹2,960: Secondary support from recent consolidation zone. ₹2,850: Cup base low and trend invalidation zone. Resistance Levels: ₹3,150: Neckline of the cup and handle; breakout trigger. ₹3,250–3,300: Short-term target zone post-breakout. ₹3,396: Previous all-time high; longer-term upside potential. 3. Strategic Trade Scenarios Bullish Scenario (Bias View): A sustained move above ₹3,150 with continued volume expansion would confirm the cup and handle breakout. If confirmed, the breakout projection points toward an initial target of ₹3,250–3,300, with room to extend toward the ₹3,396 ATH. The pattern depth supports this outlook, and today's action tilts the bias strongly bullish. Pullback Scenario: A minor dip toward ₹3,030 could serve as a handle retest. The setup remains valid as long as price stays above ₹2,960, which represents the breakout base support.
Price Action
- ■Price action is structurally positive.
- ■Forming higher highs and higher lows.
Volume Profile
- ■Volume is supportive of the price action.
- ■Wait for volume expansion on breakout.
Key Levels
No zones specified
No zones specified
Invalidation Scenario
A weekly close below the support level invalidates this structure.
Punjab National Bank
bullish fnoDouble Bottom Breakout
Daily Chart
Thesis & Analysis
No detailed thesis provided for this setup.
Price Action
- ■Price action is structurally positive.
- ■Forming higher highs and higher lows.
Volume Profile
- ■Volume is supportive of the price action.
- ■Wait for volume expansion on breakout.
Key Levels
No zones specified
No zones specified
Invalidation Scenario
A weekly close below the support level invalidates this structure.
PUNJAB NATIONAL BANK
bullish fnoOn the daily chart, the breakout candle is strong and wide-bodied with no upper wick—clear
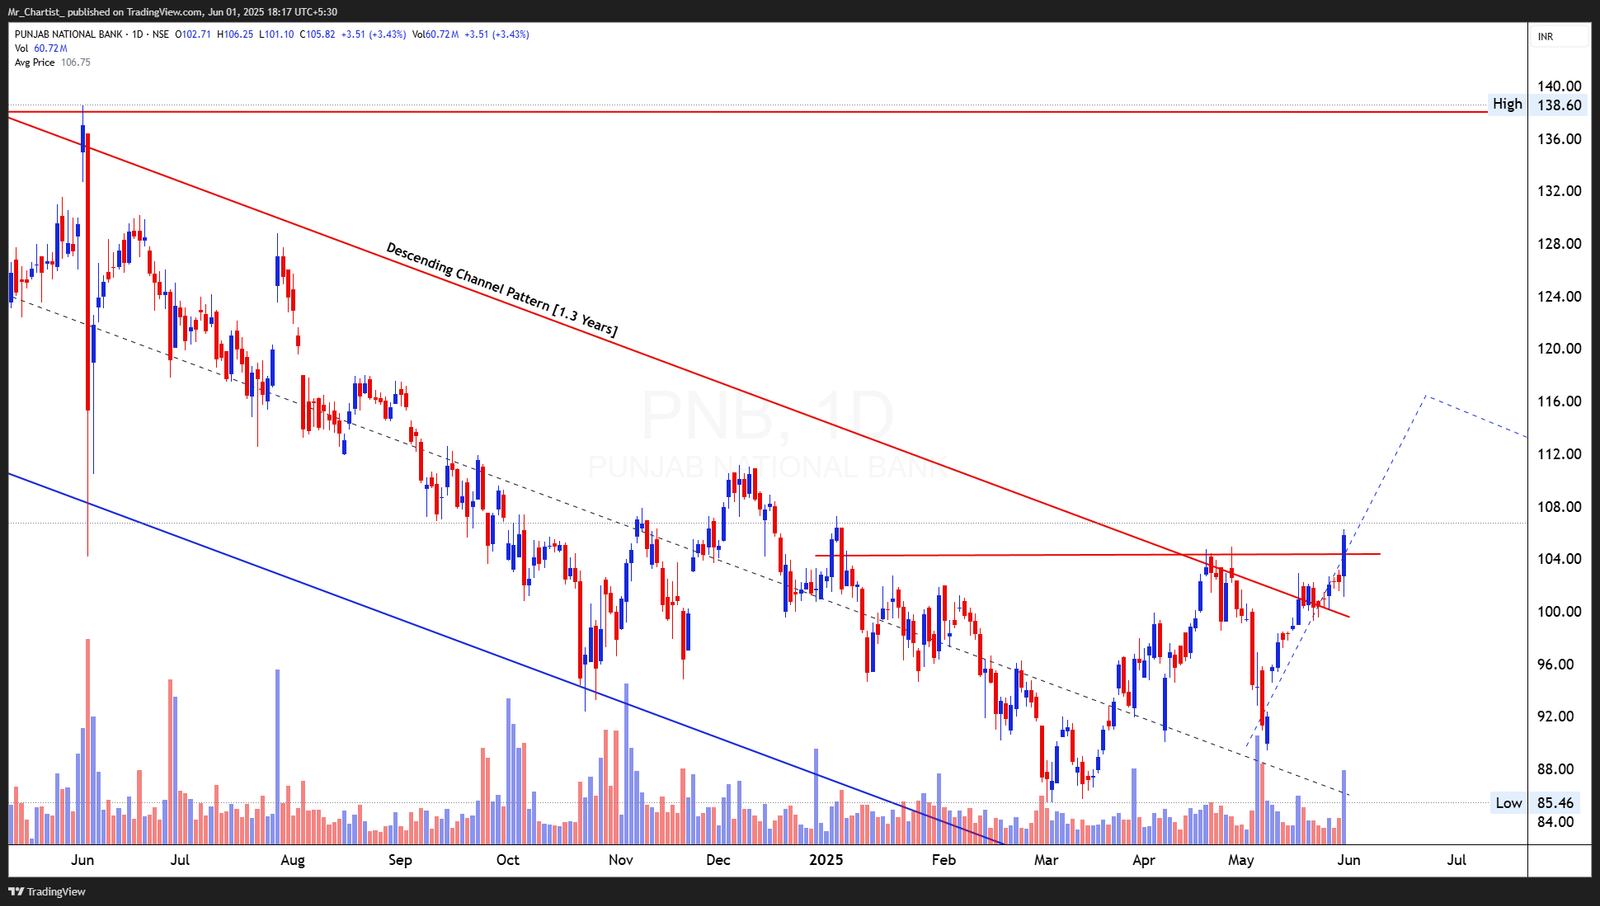
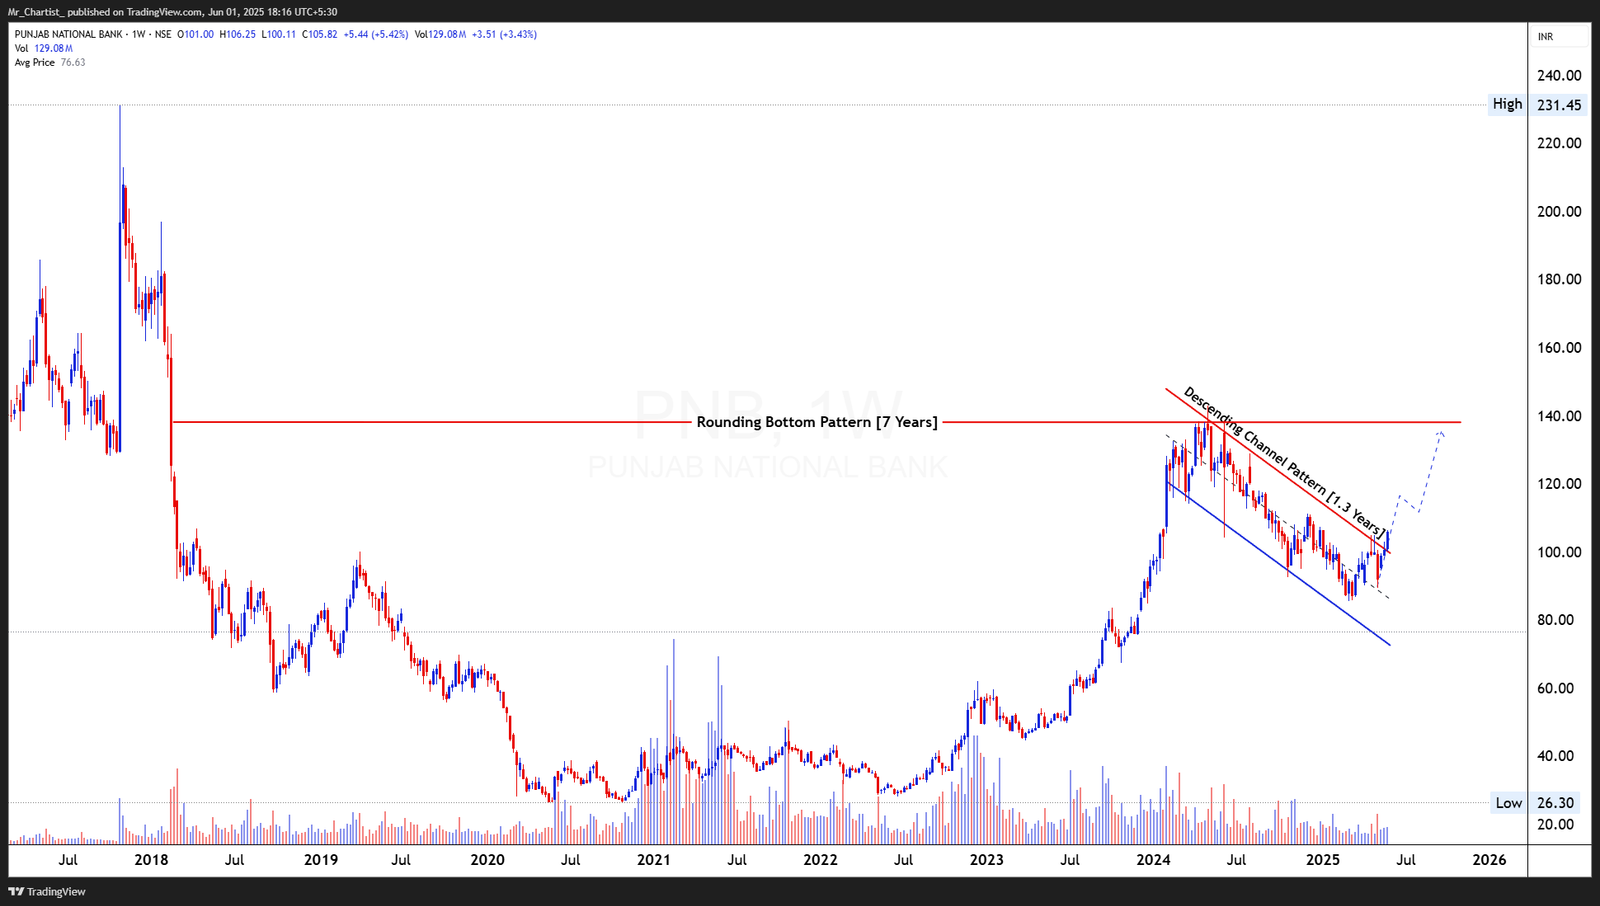
Descending Channel Breakout [1.3 Years]
Thesis & Analysis
Weekly Timeframe: Rounding Bottom Formation [7 Years] Price Action Overview: PNB has broken out of a 1.3-year descending channel on the daily chart, indicating a strong reversal of the prior downtrend. This breakout occurred after multiple failed attempts in recent months and is now confirmed by a surge above horizontal resistance near ₹104. Price action has turned parabolic with sharp momentum post-breakout. On the weekly chart, the stock is emerging from a 7-year rounding bottom pattern, which has been forming since the 2018 decline. This long-term base structure suggests a major structural shift in trend. The breakout from the descending channel aligns with the neckline retest of the rounding bottom near ₹106–108, creating a confluence zone supportive of a medium- to long- term upside. Candlestick Pattern: On the daily chart, the breakout candle is strong and wide-bodied with no upper wick—clear sign of aggressive buying. Weekly candles are building higher with increasing volume and a shift away from volatility, indicating strength behind the reversal. Volume Analysis: Both timeframes show strong volume confirmation—above 60M on the daily and 129M weekly —providing confidence in the sustainability of the breakout. The uptick in volume on breakout sessions signals fresh institutional participation. 2. Crucial Support and Resistance Levels Support Levels: ₹102–104: Immediate breakout retest zone (horizontal + channel top). ₹98: Consolidation base before breakout; minor pullback buffer. ₹88–90: Long-term support and base of the final channel wave. Resistance Levels: ₹115: Immediate breakout projection and interim swing high. ₹124–128: Previous resistance band from 2022 consolidation. ₹138–140: Rounding bottom neckline resistance and key breakout trigger for long-term continuation. 3. Strategic Trade Scenarios Bullish Scenario (Bias View): PNB has triggered a multi-timeframe breakout—from a descending channel and into the neckline zone of a 7-year rounding bottom. If price sustains above ₹104, the next bullish leg could drive it toward ₹115 and potentially ₹124–140 in the coming weeks to months. Volume support and structural shift lend strong credibility to the bullish bias. Pullback Scenario: Minor retests toward ₹102–98 can’t be ruled out, but any hold above this zone keeps the breakout structure valid. A drop below ₹98 would delay momentum but not necessarily negate the long-term setup unless ₹90 is violated.
Price Action
- ■Price action is structurally positive.
- ■Forming higher highs and higher lows.
Volume Profile
- ■Volume is supportive of the price action.
- ■Wait for volume expansion on breakout.
Key Levels
No zones specified
No zones specified
Invalidation Scenario
A weekly close below the support level invalidates this structure.
Glenmark Pharmaceuticals Ltd
bullish fnoDouble Bottom Breakout
Daily Chart
Thesis & Analysis
No detailed thesis provided for this setup.
Price Action
- ■Price action is structurally positive.
- ■Forming higher highs and higher lows.
Volume Profile
- ■Volume is supportive of the price action.
- ■Wait for volume expansion on breakout.
Key Levels
No zones specified
No zones specified
Invalidation Scenario
A weekly close below the support level invalidates this structure.
Chart Image Not Extracted
GLENMARK PHARMACEUTICALS LTD
bullish fnoToday’s wide-ranged bullish candle with minimal upper wick reflects aggressive buying.
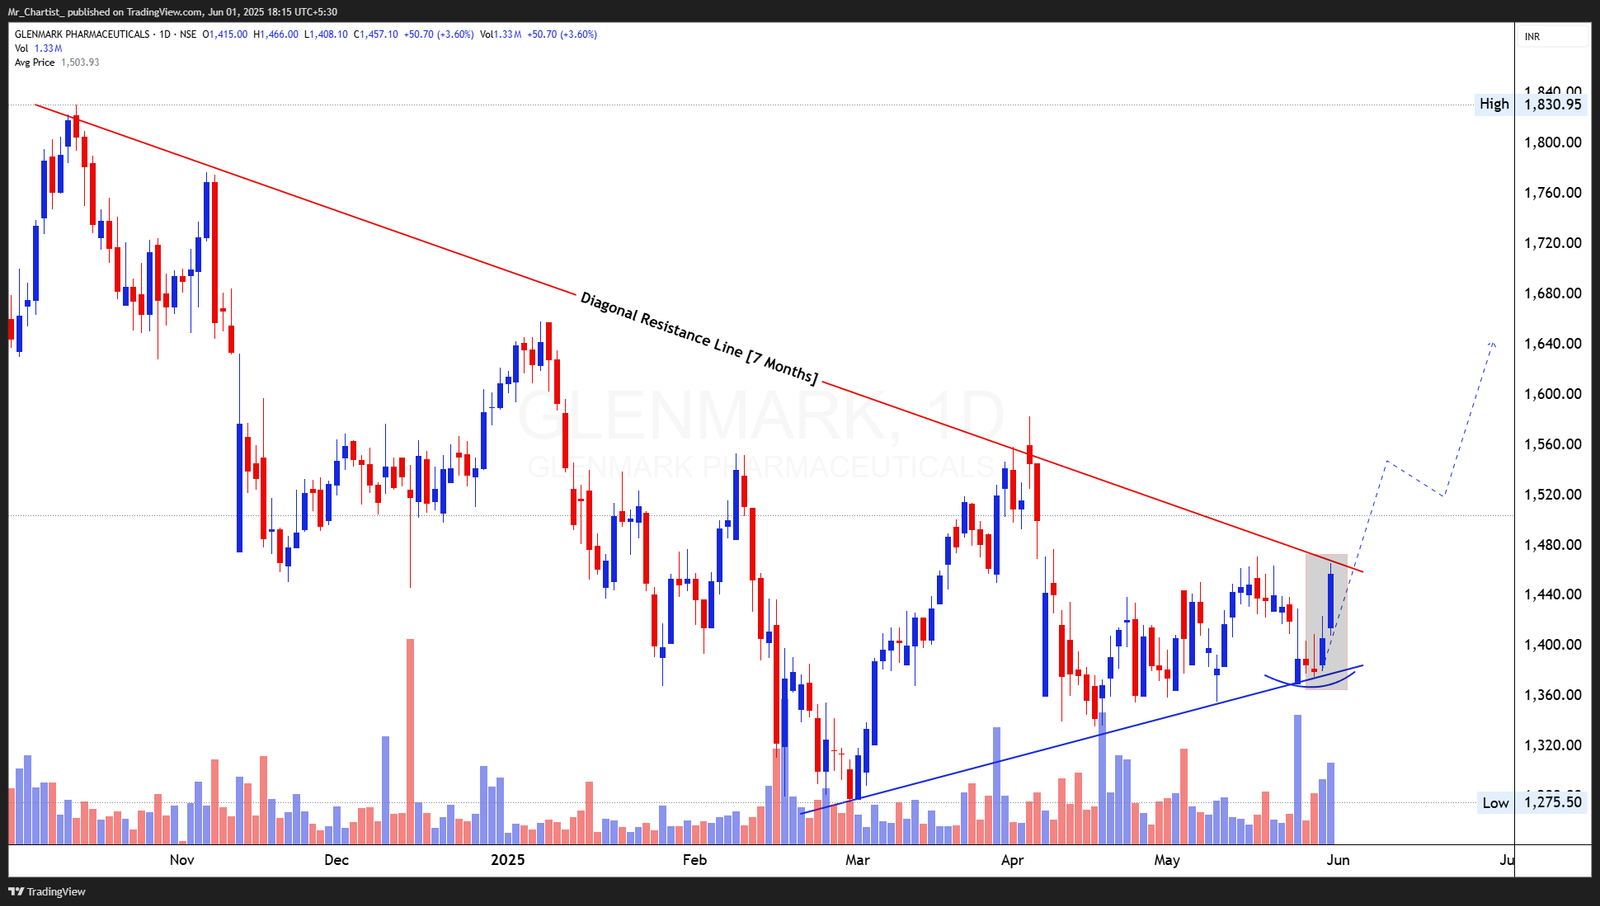
Symmetrical Triangle approaching Diagonal Resistance [7
Thesis & Analysis
Months] Price Action Overview: Glenmark Pharma is compressing within a symmetrical triangle pattern, nearing the apex just below a 7-month descending trendline. The stock has been steadily forming higher lows since March, indicating rising demand at every dip. This trendline, which previously acted as a ceiling since November 2024, is now being tested once again—this time with significantly improved momentum and a bullish context. The current structure signals a bullish breakout bias, especially after today’s sharp surge from the triangle base on strong volume. The price is pushing against the triangle’s upper boundary, and the coiling action combined with expanding range suggests that a breakout above ₹1,480–1,490 may unlock a fresh leg higher. Candlestick Pattern: Today’s wide-ranged bullish candle with minimal upper wick reflects aggressive buying. The price has engulfed previous sessions’ range and closed firmly near the resistance, increasing breakout probability. Volume Analysis: Volume has surged meaningfully over the last two sessions, particularly today, indicating early-stage accumulation. A follow-up breakout candle with volume above 1.5M would add conviction to the bullish resolution. 2. Crucial Support and Resistance Levels Support Levels: ₹1,420: Immediate rising support from triangle base. ₹1,380: Swing low and last consolidation bottom. ₹1,350: Structural support protecting the broader setup. Resistance Levels: ₹1,480–1,490: Breakout zone from triangle and trendline intersection. ₹1,560: Intermediate upside target post-breakout. ₹1,640–1,680: Broader pattern projection and major upside level. 3. Strategic Trade Scenarios Bullish Scenario (Bias View): If Glenmark breaks and closes above ₹1,490 with continued volume expansion, it would confirm a breakout from the symmetrical triangle and descending trendline. This would open up upside potential toward ₹1,560 and eventually ₹1,640. The volume and candlestick setup favor this scenario. Pullback Scenario: A mild retest of ₹1,420–1,400 is possible if momentum cools, but the pattern remains bullish as long as price holds above ₹1,380. A breach below ₹1,350 would weaken the current bullish formation.
Price Action
- ■Price action is structurally positive.
- ■Forming higher highs and higher lows.
Volume Profile
- ■Volume is supportive of the price action.
- ■Wait for volume expansion on breakout.
Key Levels
No zones specified
No zones specified
Invalidation Scenario
A weekly close below the support level invalidates this structure.
Bearish Charts [F&O]
Short setups indicating weakness
MEGATHERM INDUCTION LTD
bearish fnoDouble Bottom Breakout
Daily Chart
Thesis & Analysis
No detailed thesis provided for this setup.
Price Action
- ■Price action is structurally positive.
- ■Forming higher highs and higher lows.
Volume Profile
- ■Volume is supportive of the price action.
- ■Wait for volume expansion on breakout.
Key Levels
No zones specified
No zones specified
Invalidation Scenario
A weekly close below the support level invalidates this structure.
MEGATHERM INDUCTION LTD
bearish fnoThe latest price action shows a strong impulsive rally followed by a narrow-bodied red
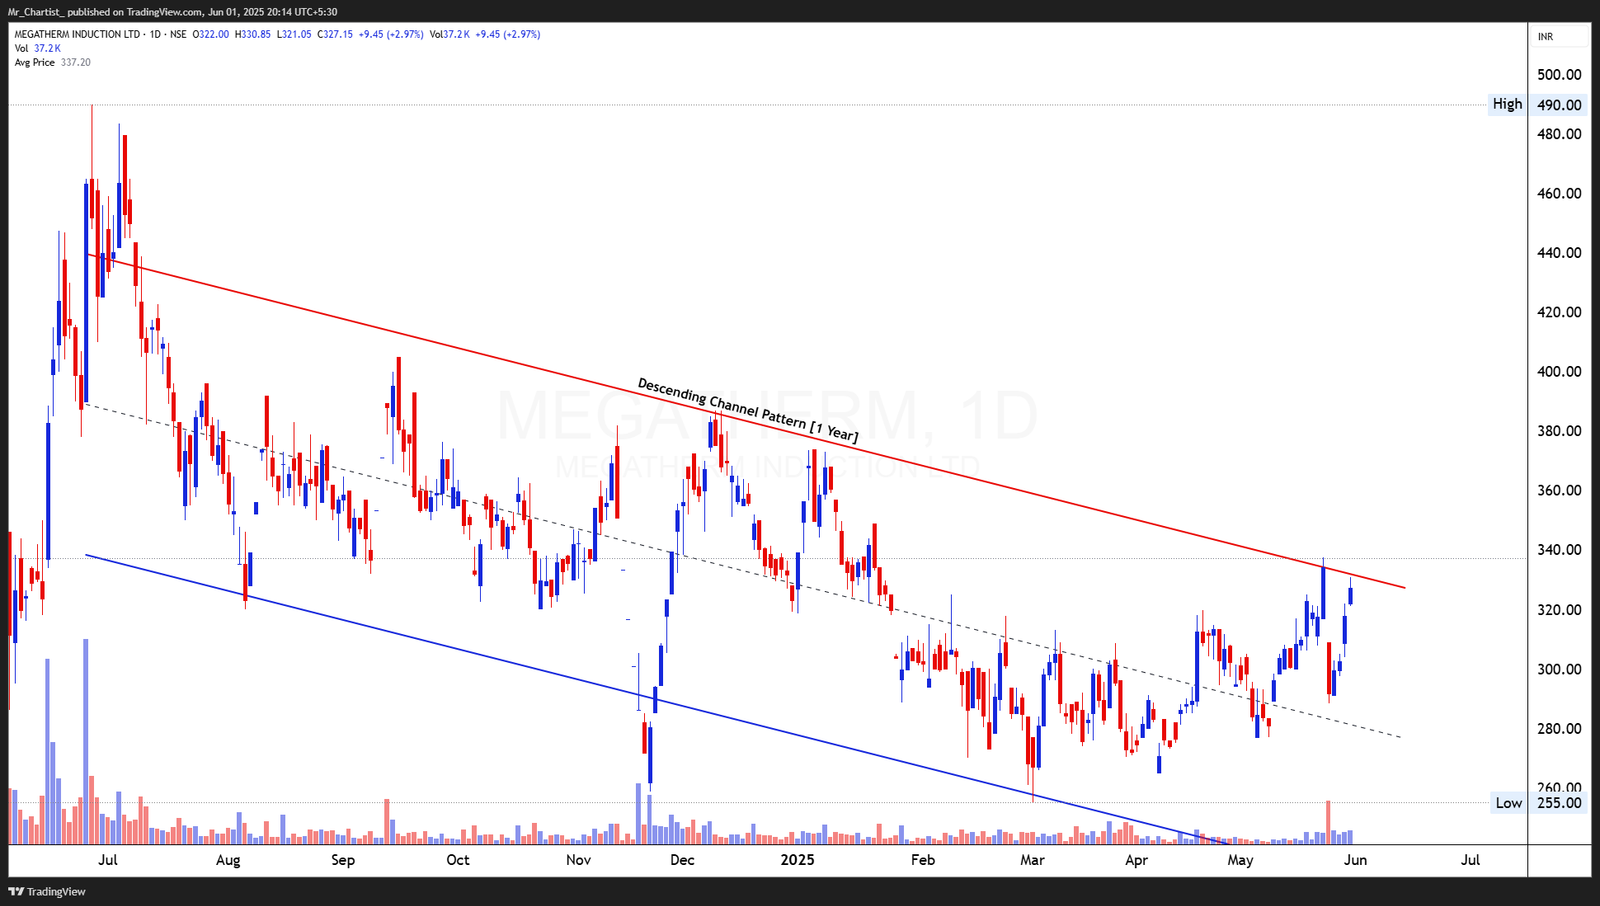
Descending Channel Pattern [1 Year]
Thesis & Analysis
Price Action Overview: Megatherm has been trading within a defined descending channel for the past year, making a series of lower highs and lower lows. The stock recently surged from the lower boundary of the channel and is now testing the upper resistance trendline (~₹335–₹340 zone). This rally was accompanied by a cluster of bullish candles, including a strong breakout attempt above the mid-channel pivot. However, today’s pullback near the upper boundary suggests momentary resistance being respected. Candlestick Pattern: The latest price action shows a strong impulsive rally followed by a narrow-bodied red candle—indicative of profit booking or hesitation near resistance. Prior candles showed persistent demand with higher closes—an encouraging sign of breakout pressure building. Volume Analysis: Volume surged in the recent up-leg and has stayed above the recent average, supporting accumulation. While today’s pullback came on lower volume, this reflects a healthy consolidation rather than aggressive selling. 2. Crucial Support and Resistance Levels Support Levels: ₹310 – Immediate support from prior breakout; recent congestion zone. ₹280 – Key mid-channel support; sustained accumulation seen here. ₹255 – Channel base and critical downside guardrail. Resistance Levels: ₹335–₹340 – Current resistance at upper boundary of the channel. ₹370–₹380 – Measured move target if channel breakout confirms. ₹410 – Broader swing resistance from Q4 2023 highs. 3. Strategic Trade Scenarios 🔹 Bullish Scenario (Bias View): A sustained daily close above the ₹340 mark with rising volume would confirm breakout from the 1-year descending channel, opening up potential for a trend reversal. Targets align toward the ₹370–₹380 range based on channel height and prior swing structures. 🔸 Pullback Scenario: A short-term rejection at ₹340 may invite a retest toward ₹310–₹300 zone. As long as the stock holds above ₹280, the bullish bias remains intact. A close below ₹280 would invalidate the breakout bias and reassert downward pressure within the channel.
Price Action
- ■Price action is structurally positive.
- ■Forming higher highs and higher lows.
Volume Profile
- ■Volume is supportive of the price action.
- ■Wait for volume expansion on breakout.
Key Levels
No zones specified
No zones specified
Invalidation Scenario
A weekly close below the support level invalidates this structure.
SAAKSHI MEDTECH & PANELS LTD
bearish fnoDouble Bottom Breakout
Daily Chart
Thesis & Analysis
No detailed thesis provided for this setup.
Price Action
- ■Price action is structurally positive.
- ■Forming higher highs and higher lows.
Volume Profile
- ■Volume is supportive of the price action.
- ■Wait for volume expansion on breakout.
Key Levels
No zones specified
No zones specified
Invalidation Scenario
A weekly close below the support level invalidates this structure.
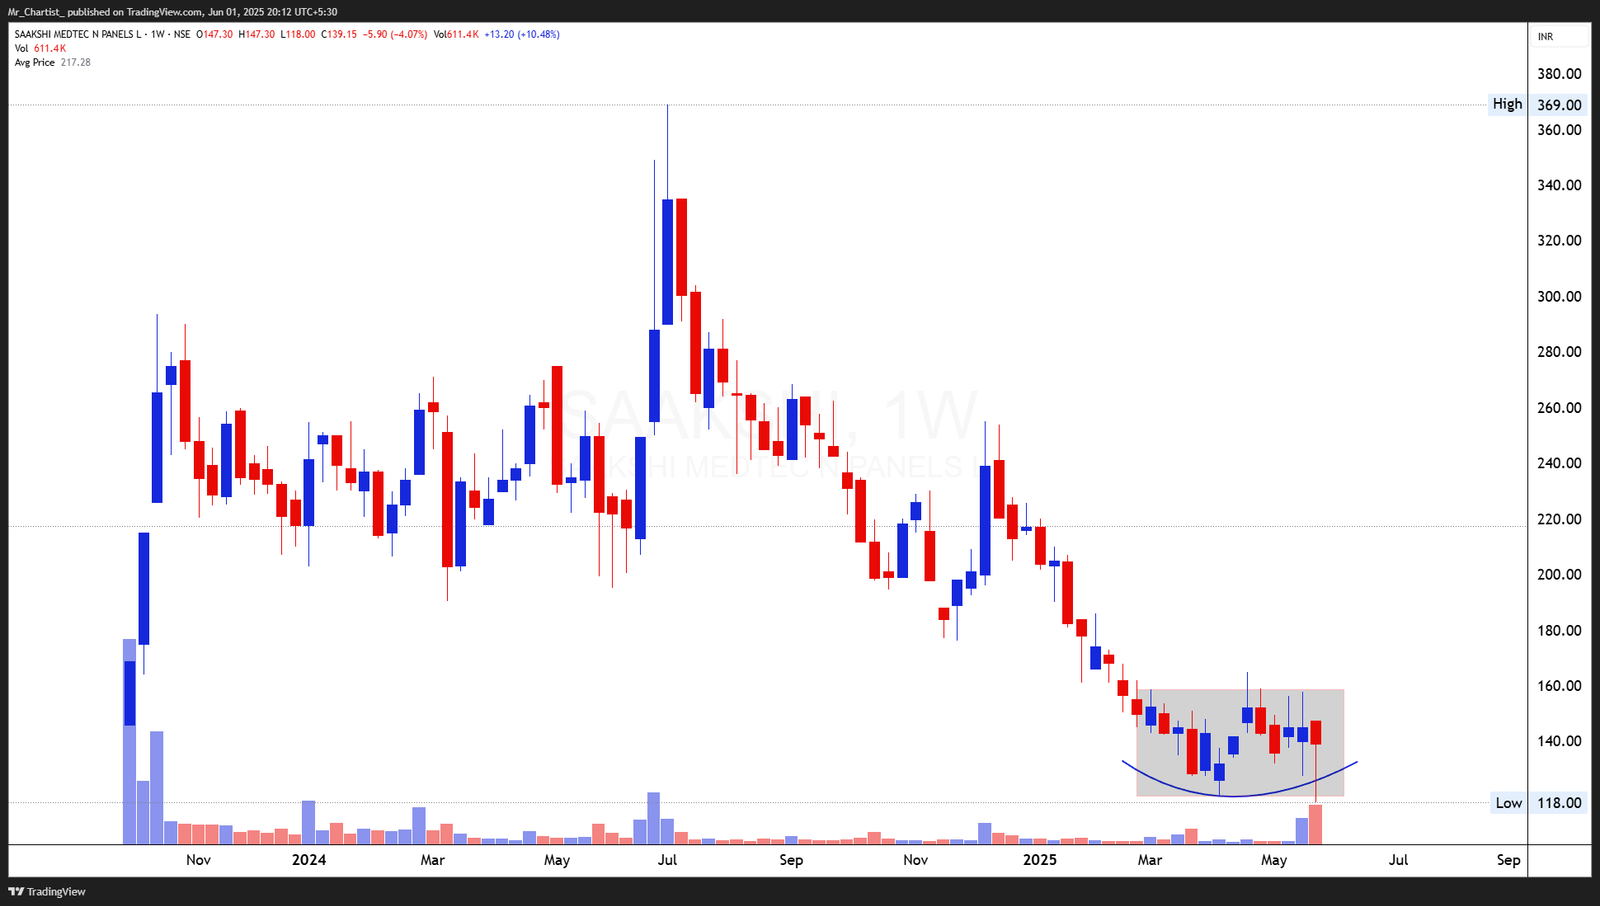
SAAKSHI MEDTECH
bearish fnoBase Formation / Bottom Consolidation [3 Months]
Daily Chart
Thesis & Analysis
No detailed thesis provided for this setup.
Price Action
- ■Price action is structurally positive.
- ■Forming higher highs and higher lows.
Volume Profile
- ■Volume is supportive of the price action.
- ■Wait for volume expansion on breakout.
Key Levels
No zones specified
No zones specified
Invalidation Scenario
A weekly close below the support level invalidates this structure.
MANGALAM ALLOYS LTD
bearish fnoDouble Bottom Breakout
Daily Chart
Thesis & Analysis
No detailed thesis provided for this setup.
Price Action
- ■Price action is structurally positive.
- ■Forming higher highs and higher lows.
Volume Profile
- ■Volume is supportive of the price action.
- ■Wait for volume expansion on breakout.
Key Levels
No zones specified
No zones specified
Invalidation Scenario
A weekly close below the support level invalidates this structure.
MANGALAM ALLOYS LTD
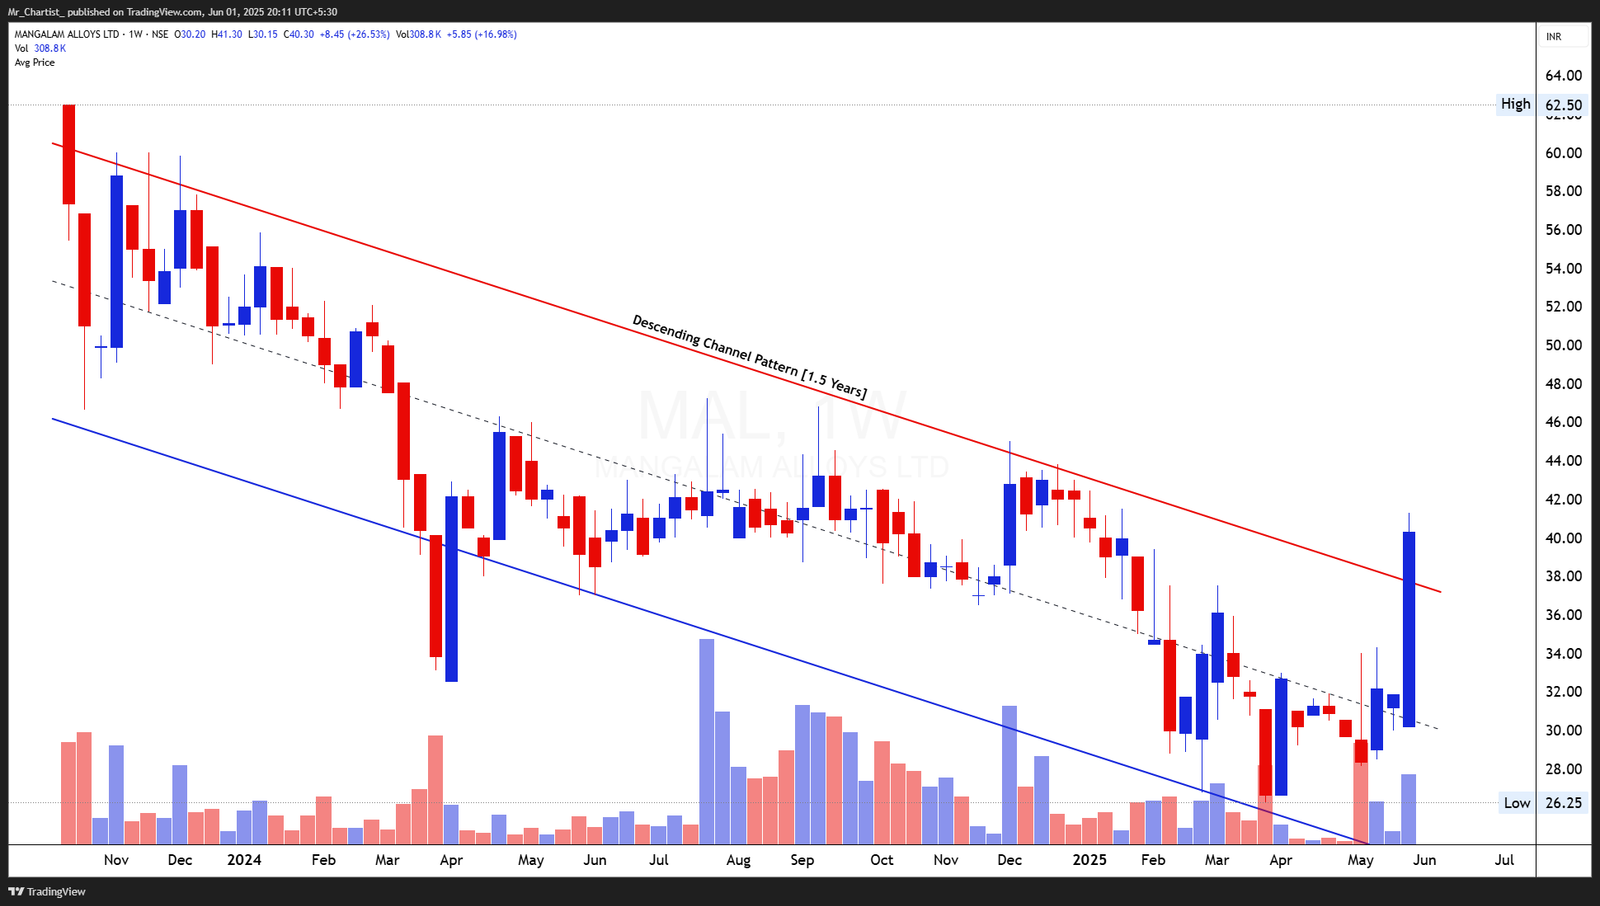
bearish fnoDouble Bottom Breakout
Descending Channel Pattern [1.5 Years]
Thesis & Analysis
Price Action Overview: Mangalam Alloys has decisively broken out of a prolonged 1.5-year descending channel, a pattern marked by lower highs and lower lows. The breakout comes after a sustained compression of volatility near the lower boundary, with the price surging past the upper trendline resistance with strong conviction. The current weekly candle represents a strong breakout bar, closing well above the channel’s upper boundary, indicating a shift in trend control from sellers to buyers. Candlestick Insight: The breakout candle is a large bullish candle with minimal upper wick, suggesting momentum continuation and low resistance at higher levels. It also clears prior swing highs, making this a structure-breaking move. Volume Analysis: Volume has surged to its highest weekly level in over 6 months, supporting the legitimacy of the breakout. The shift from low-volume drift to high-volume expansion hints at institutional accumulation and a potential trend reversal. 2. Crucial Support and Resistance Levels Support Zones: ₹36.00–₹38.00: Immediate post-breakout support from channel resistance. ₹30.00: Previous consolidation base and retest zone. ₹26.25: Pattern low, defining structural support. Resistance Zones: ₹44.00–₹46.00: Minor price congestion and historical pivot. ₹52.00–₹55.00: Next potential expansion zone based on measured move from channel width. 3. Strategic Trade Scenarios 🔹 Bullish Scenario (Bias View): The confirmed breakout from the descending channel, accompanied by volume surge, signals a structural reversal. As long as the price holds above ₹36 on pullbacks, upside continuation toward ₹44–₹46 appears likely. Sustained closing strength could extend the move to ₹52+ based on channel height projection. 🔸 Pullback Scenario: If price retests ₹36–₹38 and holds with declining volume, it may offer a secondary entry base. A close below ₹30 would weaken the current setup and invalidate the breakout bias in the short term.
Price Action
- ■Price action is structurally positive.
- ■Forming higher highs and higher lows.
Volume Profile
- ■Volume is supportive of the price action.
- ■Wait for volume expansion on breakout.
Key Levels
No zones specified
No zones specified
Invalidation Scenario
A weekly close below the support level invalidates this structure.
KP GREEN ENGINEERING LTD
bearish fnoDouble Bottom Breakout
Daily Chart
Thesis & Analysis
No detailed thesis provided for this setup.
Price Action
- ■Price action is structurally positive.
- ■Forming higher highs and higher lows.
Volume Profile
- ■Volume is supportive of the price action.
- ■Wait for volume expansion on breakout.
Key Levels
No zones specified
No zones specified
Invalidation Scenario
A weekly close below the support level invalidates this structure.
Chart Image Not Extracted
KP GREEN ENGINEERING LTD
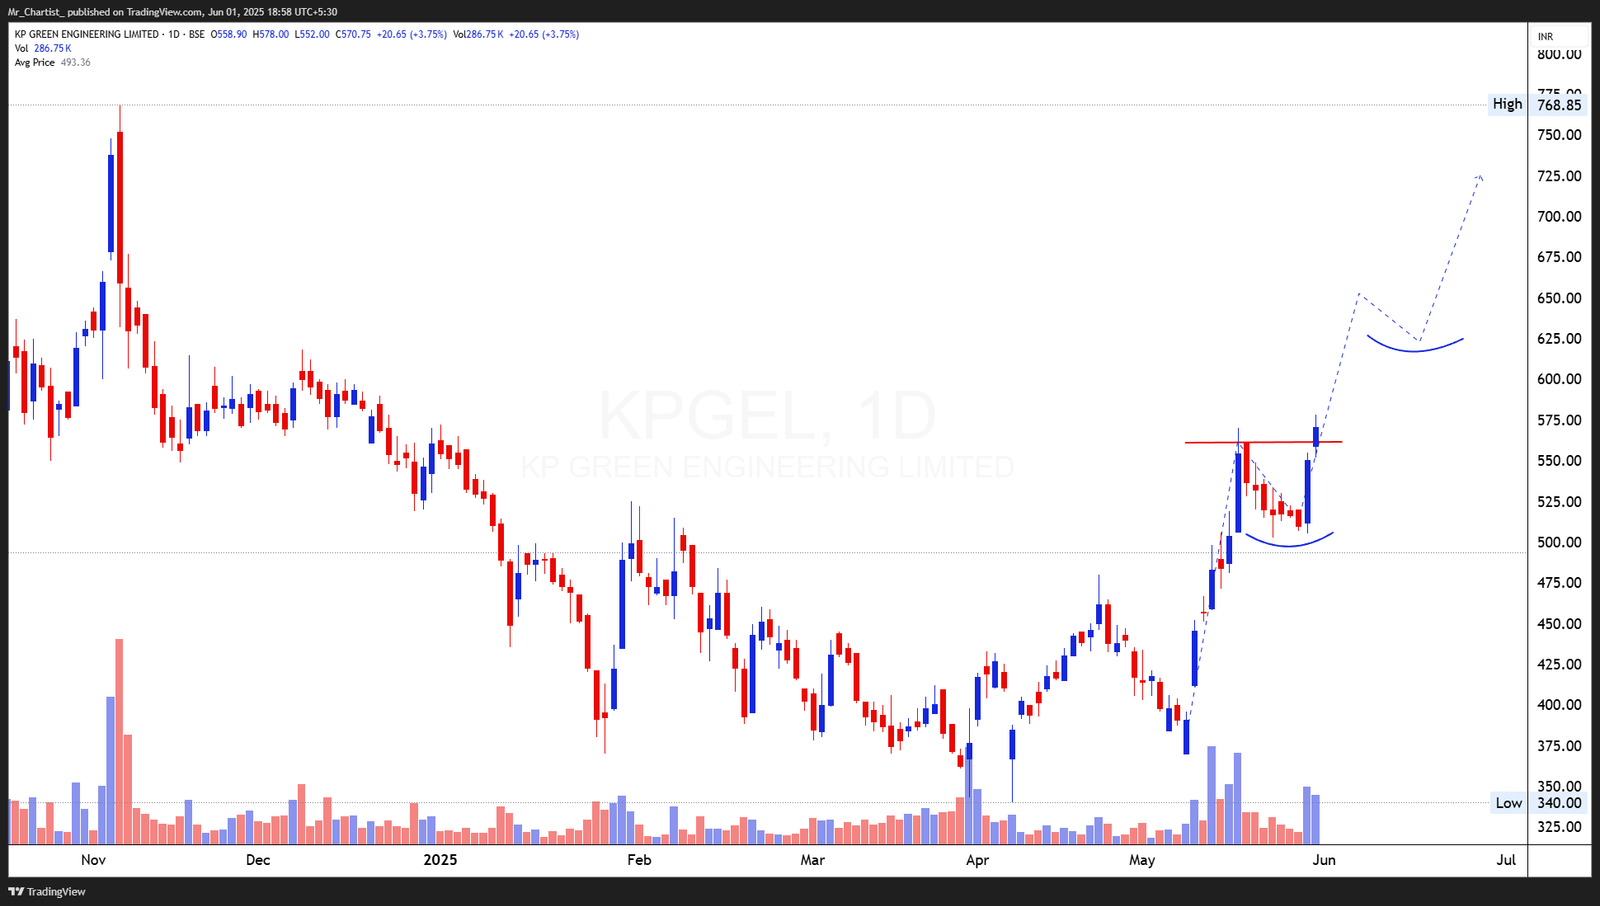
bearish fnoDouble Bottom Breakout
Base Breakout with Bullish Flag [2 Months]
Thesis & Analysis
Price Action Overview: KP Green Engineering has completed a classic flag and base breakout structure after a sharp vertical rally in May. Following the breakout leg, the stock went into a narrow range retracement, forming a mini rounding base just below ₹565–₹570 resistance. Today’s breakout candle confirms a breakout from this continuation base, aligning with a resumption of the prior uptrend. The move is visually supported by a V-shaped recovery structure, which often indicates buying absorption and control by bulls. Candlestick Insight: The breakout day featured a strong bullish candle with a wide body and minor upper wick, closing near the high—an indication of aggressive demand. The preceding candles formed a tight coil with a slight upward curve at the bottom, shaping a rounding base continuation setup. Volume Analysis: There’s a noticeable surge in volume, especially compared to prior days, confirming buyer participation. This aligns well with the bullish flag and breakout logic—volume contraction during the flag, followed by explosive expansion on breakout. 2. Crucial Support and Resistance Levels Support Levels: ₹565–₹570: Immediate breakout zone; acts as the first line of support. ₹525: Mid-pivot of the flag structure. ₹485: Origin of the rally and demand shelf. Resistance Levels: ₹630–₹650: Near-term target based on pattern projection. ₹710+: Longer-term resistance and extended move potential if momentum continues. 3. Strategic Trade Scenarios 🔹 Bullish Scenario (Bias View): With a decisive breakout from the mini-flag/rounding base near ₹570, the stock is poised for trend continuation toward ₹630–₹650. Sustained strength above ₹570 with rising volume would reinforce bullish sentiment and confirm this level as a reliable support base. 🔸 Pullback Scenario: In case of a pullback, ₹565 should be defended to maintain the breakout integrity. A retest and hold near this zone, especially with low volume, could provide secondary continuation entries. A breakdown below ₹525 would disrupt the structure and put near- term bullishness on hold.
Price Action
- ■Price action is structurally positive.
- ■Forming higher highs and higher lows.
Volume Profile
- ■Volume is supportive of the price action.
- ■Wait for volume expansion on breakout.
Key Levels
No zones specified
No zones specified
Invalidation Scenario
A weekly close below the support level invalidates this structure.
VALIANT ORGANICS LTD
bearish fnoDouble Bottom Breakout
Daily Chart
Thesis & Analysis
No detailed thesis provided for this setup.
Price Action
- ■Price action is structurally positive.
- ■Forming higher highs and higher lows.
Volume Profile
- ■Volume is supportive of the price action.
- ■Wait for volume expansion on breakout.
Key Levels
No zones specified
No zones specified
Invalidation Scenario
A weekly close below the support level invalidates this structure.
VALIANT ORGANICS LTD
bearish fnoWeekly candles have expanded significantly in range, with bullish dominance and no
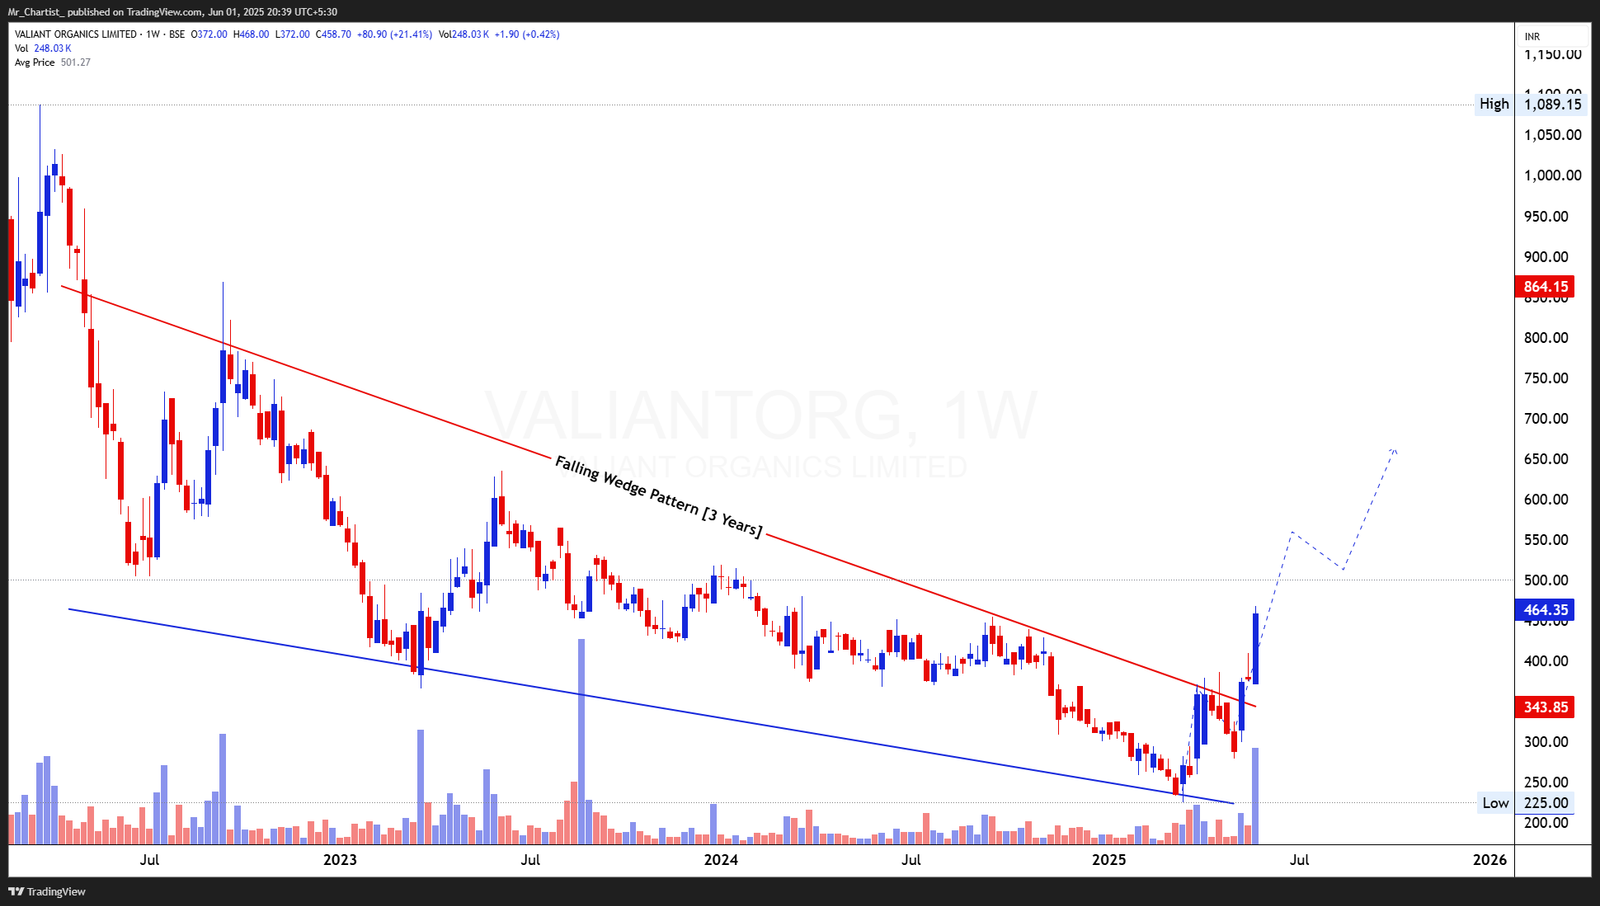
Falling Wedge Pattern [3 Years]
Thesis & Analysis
Price Action Overview: Valiant Organics has recently broken out of a long-term falling wedge pattern that persisted for nearly three years, stretching from mid-2022 to May 2025. This pattern, marked by converging downward sloping trendlines, typically signals a reversal of prolonged downtrends. After grinding along the lower wedge support through late 2024, the stock has now decisively breached the wedge resistance with a sharp bullish breakout. The post-breakout momentum has been strong, pushing the stock up by over 35% in a matter of weeks. The breakout candle is well-defined, and the strength of the move suggests a structural reversal. The falling wedge breakout also aligns with a multi-year support zone, making the setup fundamentally stronger. Candlestick Pattern: Weekly candles have expanded significantly in range, with bullish dominance and no significant upper wicks—evidence of strong sustained buying interest. The breakout bar is followed by a continuation candle, confirming follow-through. Volume Analysis: Volume surged dramatically during the breakout week, crossing well above the 3-year average. This volume explosion supports the breakout's validity and points to strong institutional accumulation. 2. Crucial Support and Resistance Levels Support Levels: ₹425: Post-breakout support zone; likely to act as demand in pullbacks. ₹380–390: Former wedge resistance now turned support. ₹343: Last base before breakout and key level for structure integrity. Resistance Levels: ₹500: Psychological level and minor consolidation zone. ₹575–600: Historical supply zone from mid-2022. ₹700: Measured move projection based on wedge depth. 3. Strategic Trade Scenarios Bullish Scenario (Bias View): With a clean breakout from a multi-year wedge backed by strong volume, the chart presents a clear bullish bias. Sustaining above ₹425 could lead the stock toward ₹500 and eventually ₹575–600, with potential to stretch to ₹700 based on the breakout projection. The pattern suggests a longer-term trend reversal is underway. Pullback Scenario: A retest of the breakout zone near ₹425 is possible; as long as it holds, the setup remains intact. A fall below ₹380 would weaken the pattern, but the broader bias stays constructive until ₹343 is breached.
Price Action
- ■Price action is structurally positive.
- ■Forming higher highs and higher lows.
Volume Profile
- ■Volume is supportive of the price action.
- ■Wait for volume expansion on breakout.
Key Levels
No zones specified
No zones specified
Invalidation Scenario
A weekly close below the support level invalidates this structure.
IFB AGRO INDUSTRIES LTD
bearish fnoDouble Bottom Breakout
Daily Chart
Thesis & Analysis
No detailed thesis provided for this setup.
Price Action
- ■Price action is structurally positive.
- ■Forming higher highs and higher lows.
Volume Profile
- ■Volume is supportive of the price action.
- ■Wait for volume expansion on breakout.
Key Levels
No zones specified
No zones specified
Invalidation Scenario
A weekly close below the support level invalidates this structure.
IFB AGRO INDUSTRIES LTD
bearish fnoA dominant breakout candle with extreme range and a near high-close—this is a classic
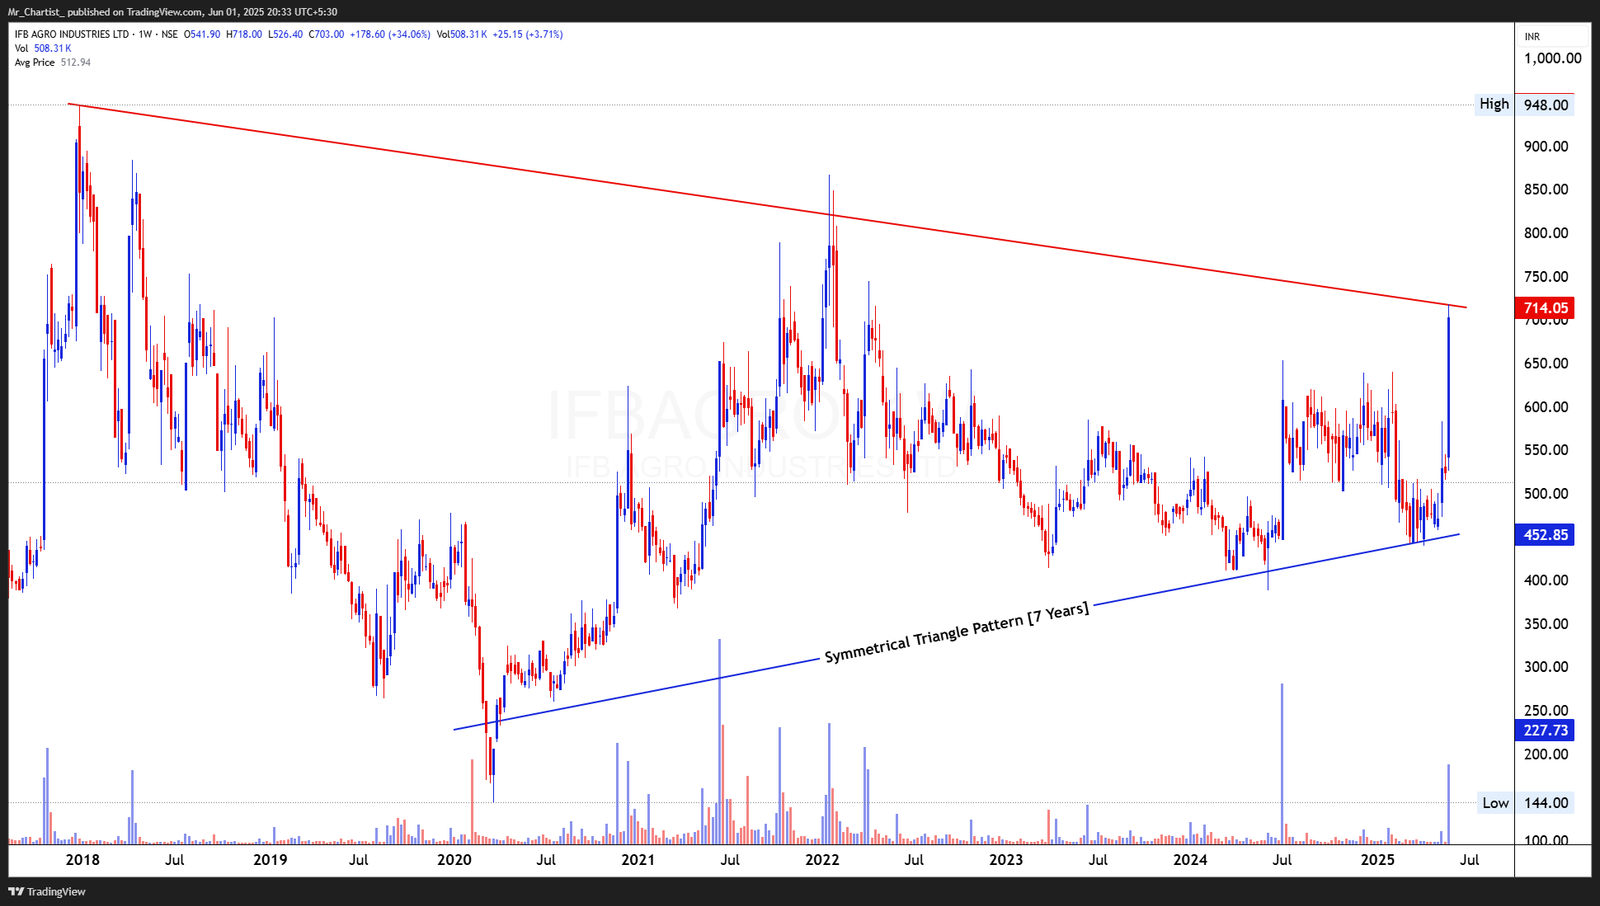
Symmetrical Triangle Pattern [7 Years]
Thesis & Analysis
Price Action Overview: IFB Agro has executed a powerful breakout from a 7-year symmetrical triangle that has constrained price action since 2018. This long-term structure is defined by a gradually rising support line and a declining resistance trendline, resulting in years of compression. This week's breakout marks the first significant breach of the upper resistance band near ₹714, accompanied by a massive single-week gain of over 34%. Such a breakout after extended contraction reflects a potential secular trend reversal. The sharp upward spike reflects renewed investor interest and a likely shift in valuation perception. The large weekly candle also cleared prior congestion zones decisively, leaving minimal overhead supply up to the ₹850–₹950 band. Candlestick Pattern: A dominant breakout candle with extreme range and a near high-close—this is a classic breakout signal. No upper rejection wick, showing aggressive buyers in control throughout the week. Volume Analysis: Weekly volume at 508K is the highest in years and validates the structural breakout. The volume surge aligns with major institutions or informed buying, reinforcing the bullish outlook. 2. Crucial Support and Resistance Levels Support Levels: ₹650: Minor consolidation support after the breakout impulse. ₹580: Breakout retest zone and previous resistance zone. ₹452: Triangle base support, now strong long-term demand. Resistance Levels: ₹714–720: Zone currently being tested; breakout to be confirmed. ₹850: Medium-term swing high (2021 peak zone). ₹948: Major historical resistance and long-term upside target. 3. Strategic Trade Scenarios Bullish Scenario (Bias View): With a breakout from a 7-year symmetrical triangle, IFB Agro presents a rare long-term reversal opportunity. Sustaining above ₹714 would confirm the structural breakout and open the path toward ₹850 and ₹948 in the coming months. The breakout bar, volume, and multi- year compression suggest significant follow-through potential. Pullback Scenario: A short-term dip toward ₹650–₹580 would be healthy and offer a retest opportunity. Only a drop below ₹452 would materially damage the structural bullish setup.
Price Action
- ■Price action is structurally positive.
- ■Forming higher highs and higher lows.
Volume Profile
- ■Volume is supportive of the price action.
- ■Wait for volume expansion on breakout.
Key Levels
No zones specified
No zones specified
Invalidation Scenario
A weekly close below the support level invalidates this structure.
SRM CONTRACTORS LTD
bearish fnoDouble Bottom Breakout
Daily Chart
Thesis & Analysis
No detailed thesis provided for this setup.
Price Action
- ■Price action is structurally positive.
- ■Forming higher highs and higher lows.
Volume Profile
- ■Volume is supportive of the price action.
- ■Wait for volume expansion on breakout.
Key Levels
No zones specified
No zones specified
Invalidation Scenario
A weekly close below the support level invalidates this structure.
SRM CONTRACTORS LTD
bearish fnoBreakout candles are long-bodied with minimal upper shadows, suggesting decisive buying
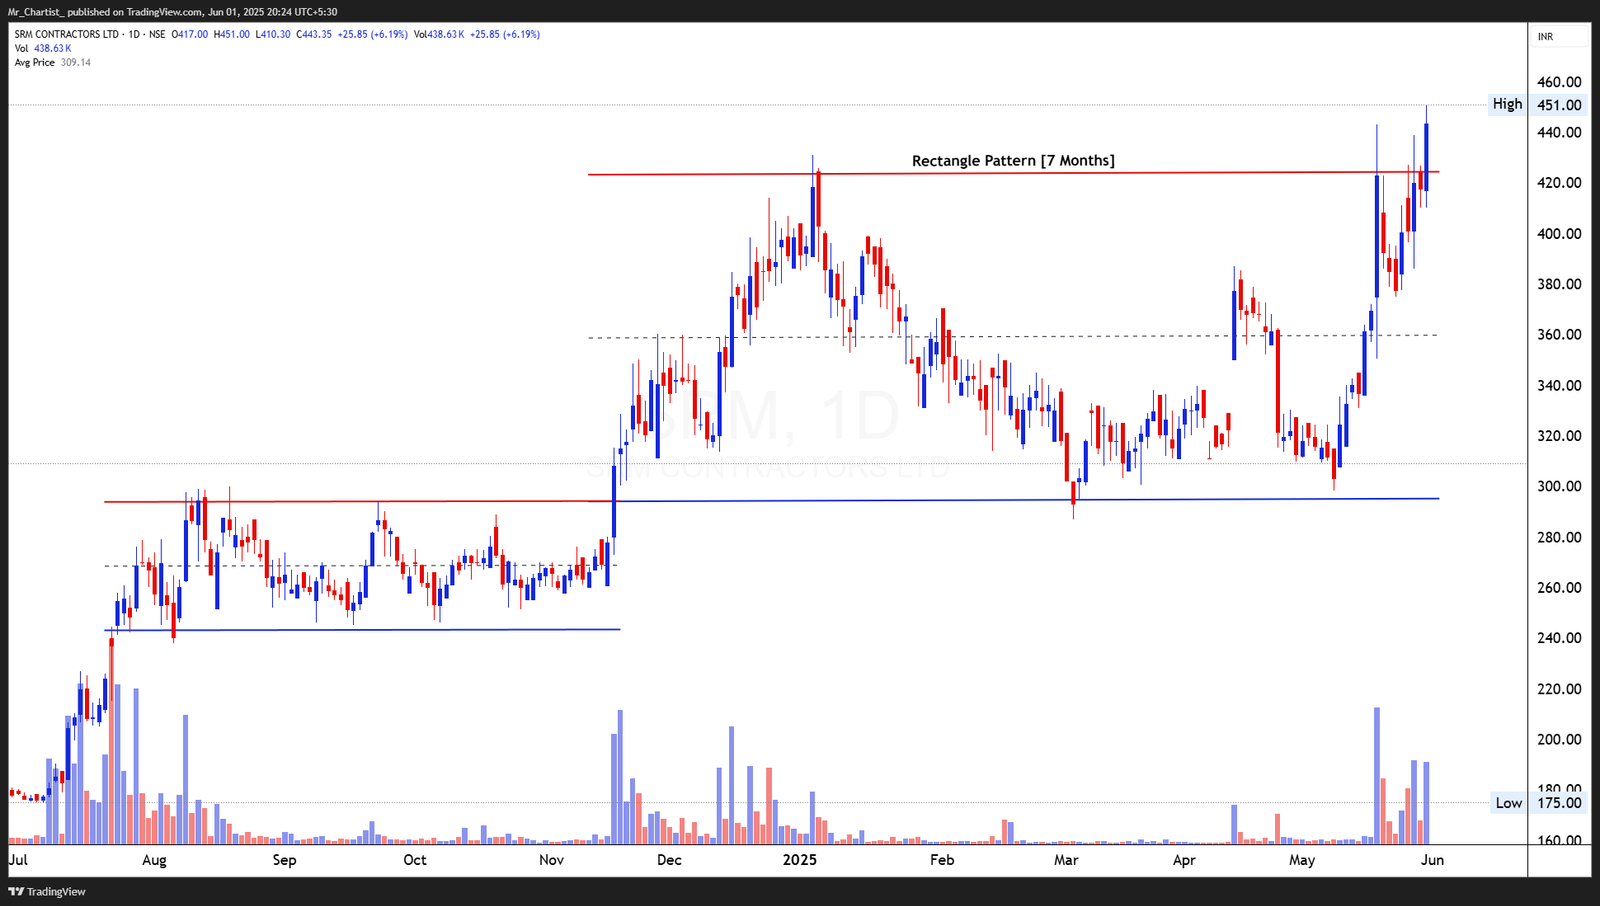
Rectangle Pattern [7 Months]
Thesis & Analysis
Price Action Overview: SRM Contractors has successfully broken out of a 7-month rectangle range, marked by horizontal boundaries between ₹300 and ₹425. The stock had spent a prolonged period oscillating within this band, consolidating previous gains after a sharp up-move in 2023. The recent breakout above ₹425 comes after a series of strong bullish candles and marks a fresh upward trend resumption. What makes this breakout notable is the vertical nature of the rally from the ₹310 region, indicating strong buying conviction. The prior resistance level around ₹425 is now being retested as support, and price is continuing higher, confirming follow-through strength. Candlestick Pattern: Breakout candles are long-bodied with minimal upper shadows, suggesting decisive buying pressure. Today’s session reflects breakout continuation and minimal rejection near recent highs, supporting the bullish narrative. Volume Analysis: Volume has surged significantly during and post-breakout, far exceeding the average from the consolidation phase. This volume breakout confirmation adds weight to the bullish move and implies institutional participation. 2. Crucial Support and Resistance Levels Support Levels: ₹425: Recent breakout zone; immediate support. ₹385: Pre-breakout consolidation peak. ₹300: Base of the rectangle; long-term structure level. Resistance Levels: ₹460–475: Minor extension zone above breakout. ₹500: Psychological round number and potential medium-term target. ₹525–540: Measured move from rectangle height. 3. Strategic Trade Scenarios Bullish Scenario (Bias View): The breakout above ₹425 from a multi-month rectangle pattern indicates a structural resumption of trend. Sustained momentum above ₹440–445 may carry the stock toward ₹475 initially, followed by ₹500–525 based on the pattern’s projection. With strong volume confirmation, this is a high-conviction continuation move. Pullback Scenario: If the price dips, a retest of ₹425 is healthy and could offer a second entry opportunity. The structure remains bullish as long as price holds above ₹385. A close below ₹385 would weaken the current breakout conviction.
Price Action
- ■Price action is structurally positive.
- ■Forming higher highs and higher lows.
Volume Profile
- ■Volume is supportive of the price action.
- ■Wait for volume expansion on breakout.
Key Levels
No zones specified
No zones specified
Invalidation Scenario
A weekly close below the support level invalidates this structure.
VENUS REMEDIES LTD
bearish fnoDouble Bottom Breakout
Daily Chart
Thesis & Analysis
No detailed thesis provided for this setup.
Price Action
- ■Price action is structurally positive.
- ■Forming higher highs and higher lows.
Volume Profile
- ■Volume is supportive of the price action.
- ■Wait for volume expansion on breakout.
Key Levels
No zones specified
No zones specified
Invalidation Scenario
A weekly close below the support level invalidates this structure.
VENUS REMEDIES LTD
bearish fnoThe breakout candle is wide-ranged, strong-bodied, and closes at the top of the weekly
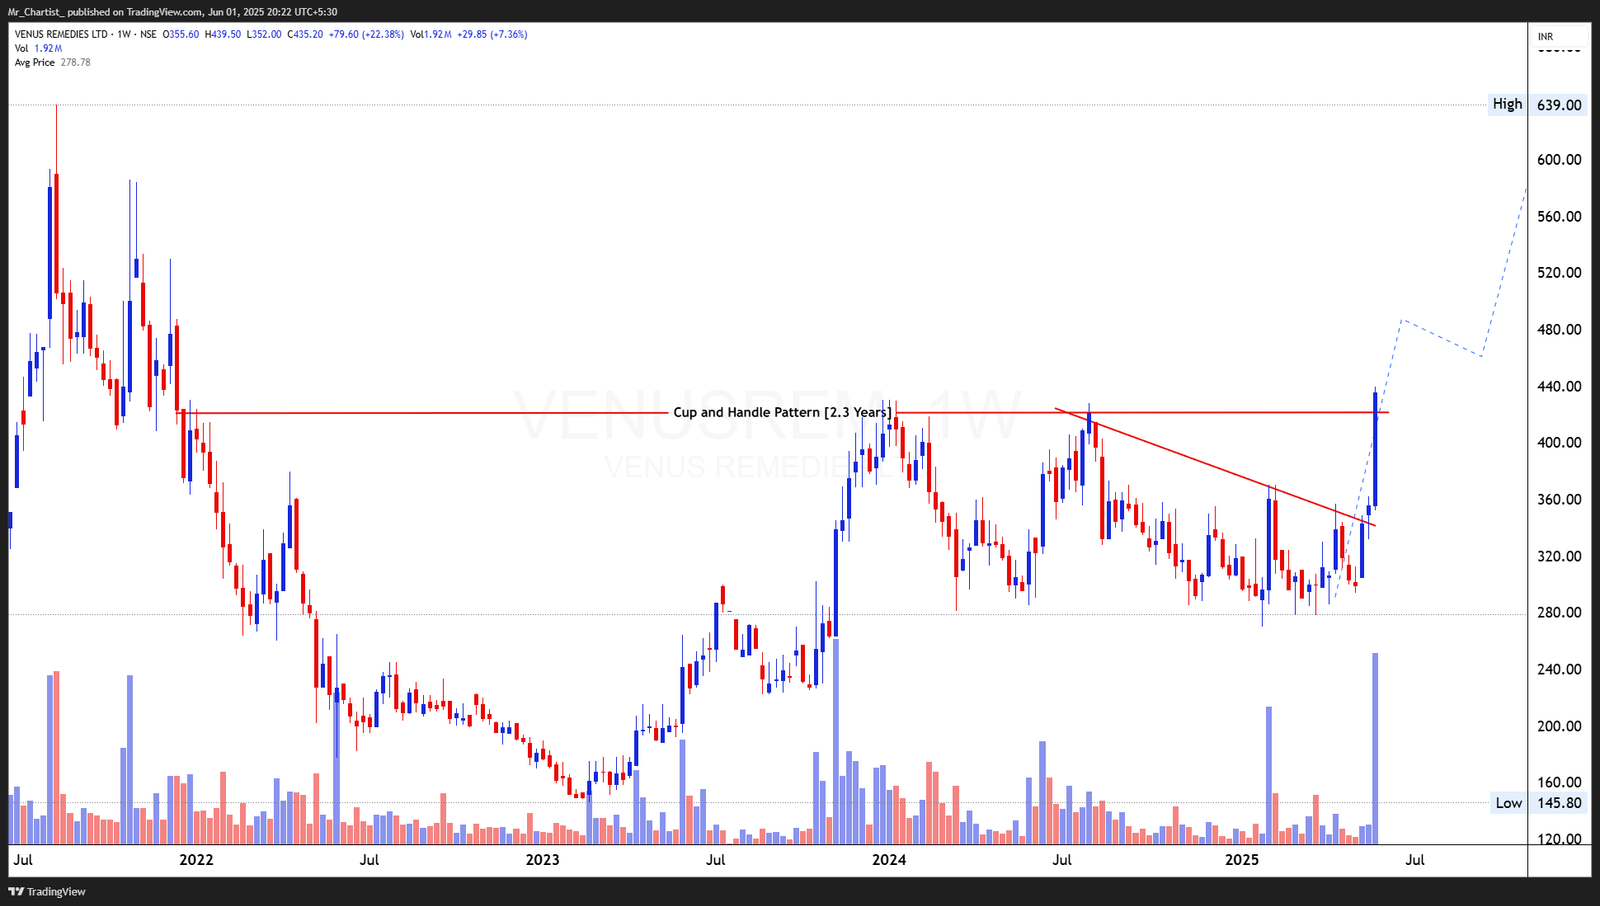
Cup and Handle Pattern [2.3 Years]
Thesis & Analysis
Price Action Overview: Venus Remedies has broken out of a 2.3-year cup and handle formation on the weekly chart. The base of the cup formed gradually from late 2022 into mid-2024, while the handle developed as a tight sideways consolidation over the last several months. The breakout above ₹435 marks a significant structural shift, representing a trend reversal after a prolonged accumulation phase. The sharp breakout candle with strong price extension signals the activation of the pattern. The long base adds weight to the setup, and the breakout follows a period of declining volatility—often a precursor to major directional moves. Candlestick Pattern: The breakout candle is wide-ranged, strong-bodied, and closes at the top of the weekly range—indicative of strong buyer conviction. It cleared the neckline decisively without rejection wicks. Volume Analysis: Weekly volume surged significantly, nearing multi-year highs, validating the breakout and confirming accumulation beneath the neckline. This adds strong confirmation to the bullish shift. 2. Crucial Support and Resistance Levels Support Levels: ₹410–₹420: Neckline and breakout retest zone. ₹375: Handle base and intermediate pivot. ₹320: Pre-breakout consolidation base. Resistance Levels: ₹480: Minor resistance zone from past reactive highs. ₹520–540: Medium-term target based on handle depth. ₹639: Long-term resistance from April 2022 swing high. 3. Strategic Trade Scenarios Bullish Scenario (Bias View): With a breakout above a multi-year cup and handle structure backed by explosive volume, Venus Remedies has entered a strong bullish phase. Sustaining above ₹435 would keep momentum alive, with expected targets in the range of ₹480 to ₹540 over the medium term, and potentially extending toward ₹639 if strength continues. Pullback Scenario: A minor dip toward ₹410–₹420 can be expected, which would serve as a breakout retest. As long as price holds above ₹375, the breakout remains technically valid and biased toward higher levels.
Price Action
- ■Price action is structurally positive.
- ■Forming higher highs and higher lows.
Volume Profile
- ■Volume is supportive of the price action.
- ■Wait for volume expansion on breakout.
Key Levels
No zones specified
No zones specified
Invalidation Scenario
A weekly close below the support level invalidates this structure.
HCP PLASTENE BULKPACK LTD
bearish fnoDouble Bottom Breakout
Daily Chart
Thesis & Analysis
No detailed thesis provided for this setup.
Price Action
- ■Price action is structurally positive.
- ■Forming higher highs and higher lows.
Volume Profile
- ■Volume is supportive of the price action.
- ■Wait for volume expansion on breakout.
Key Levels
No zones specified
No zones specified
Invalidation Scenario
A weekly close below the support level invalidates this structure.
HCP PLASTENE BULKPACK LTD
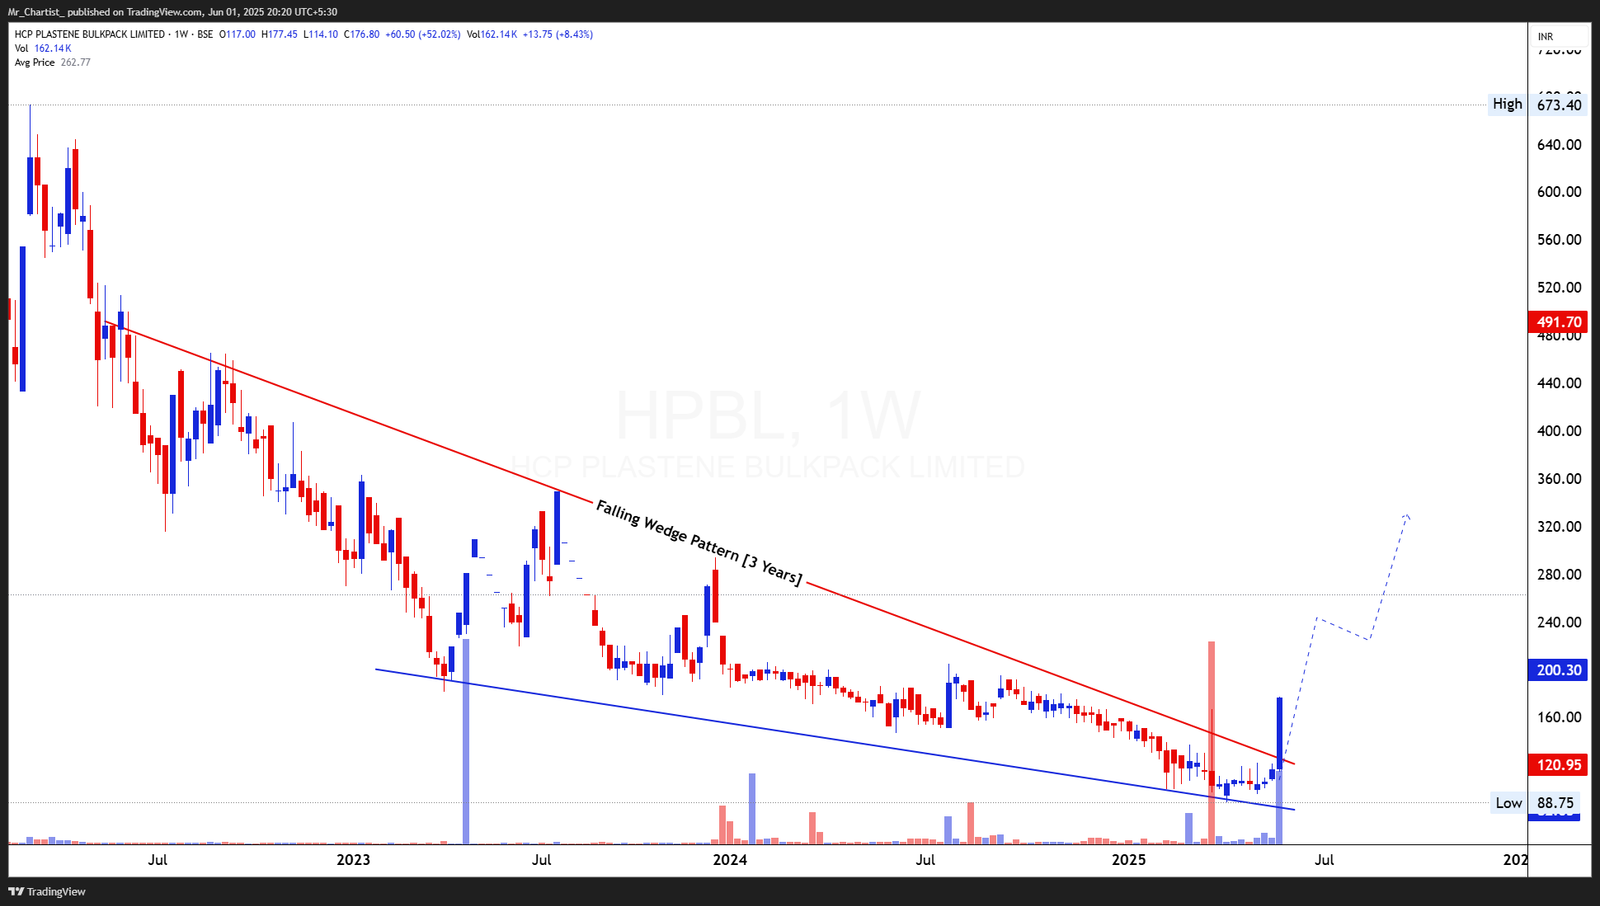
bearish fnoThis week’s candle is long-bodied and closed near the weekly high, with no upper shadow
Falling Wedge Pattern [3 Years]
Thesis & Analysis
Price Action Overview: HCP Plastene Bulkpack has broken out from a classic falling wedge formation, which had constrained price action for nearly three years. This multi-year compression featured declining highs and lows, forming a tapering wedge. Price action had been coiling within a narrow band until a strong bullish breakout unfolded this week, signaling a long-term trend reversal. The breakout not only clears the wedge resistance line but also reclaims multiple recent swing highs in a single sharp move—indicating a strong shift in momentum. The overall setup suggests the beginning of a broader uptrend, particularly after such an extended phase of base formation and accumulation. Candlestick Pattern: This week’s candle is long-bodied and closed near the weekly high, with no upper shadow —textbook breakout confirmation. The bullish engulfing structure over several weeks of prior candles enhances reliability. Volume Analysis: Volume exploded during the breakout, crossing over the average of the last 3 years. This volume breakout confirms heavy accumulation, likely involving institutional activity or long-term participants entering decisively. 2. Crucial Support and Resistance Levels Support Levels: ₹160–₹165: Immediate breakout zone and nearest retest region. ₹145: Last pre-breakout swing high; buffer zone. ₹121: Historical wedge base and structural demand zone. Resistance Levels: ₹200–₹203: Minor resistance from March 2023 high. ₹240–₹250: Medium-term swing high and volume cluster. ₹320: Long-term price target based on measured wedge breakout. 3. Strategic Trade Scenarios Bullish Scenario (Bias View): A confirmed weekly breakout from a 3-year falling wedge backed by strong volume tilts the bias strongly bullish. Sustaining above ₹165 opens up targets toward ₹203 and ₹250, with eventual upside toward ₹320 over the medium term. The wedge’s structural context supports sustained momentum continuation. Pullback Scenario: A mild pullback toward ₹160–₹145 could offer a healthy breakout retest. The setup remains intact unless price falls below ₹121, which would invalidate the bullish pattern.
Price Action
- ■Price action is structurally positive.
- ■Forming higher highs and higher lows.
Volume Profile
- ■Volume is supportive of the price action.
- ■Wait for volume expansion on breakout.
Key Levels
No zones specified
No zones specified
Invalidation Scenario
A weekly close below the support level invalidates this structure.
LYPSA GEMS & JEWEL LTD
bearish fnoDouble Bottom Breakout
Daily Chart
Thesis & Analysis
No detailed thesis provided for this setup.
Price Action
- ■Price action is structurally positive.
- ■Forming higher highs and higher lows.
Volume Profile
- ■Volume is supportive of the price action.
- ■Wait for volume expansion on breakout.
Key Levels
No zones specified
No zones specified
Invalidation Scenario
A weekly close below the support level invalidates this structure.
Chart Image Not Extracted
LYPSA GEMS & JEWEL LTD
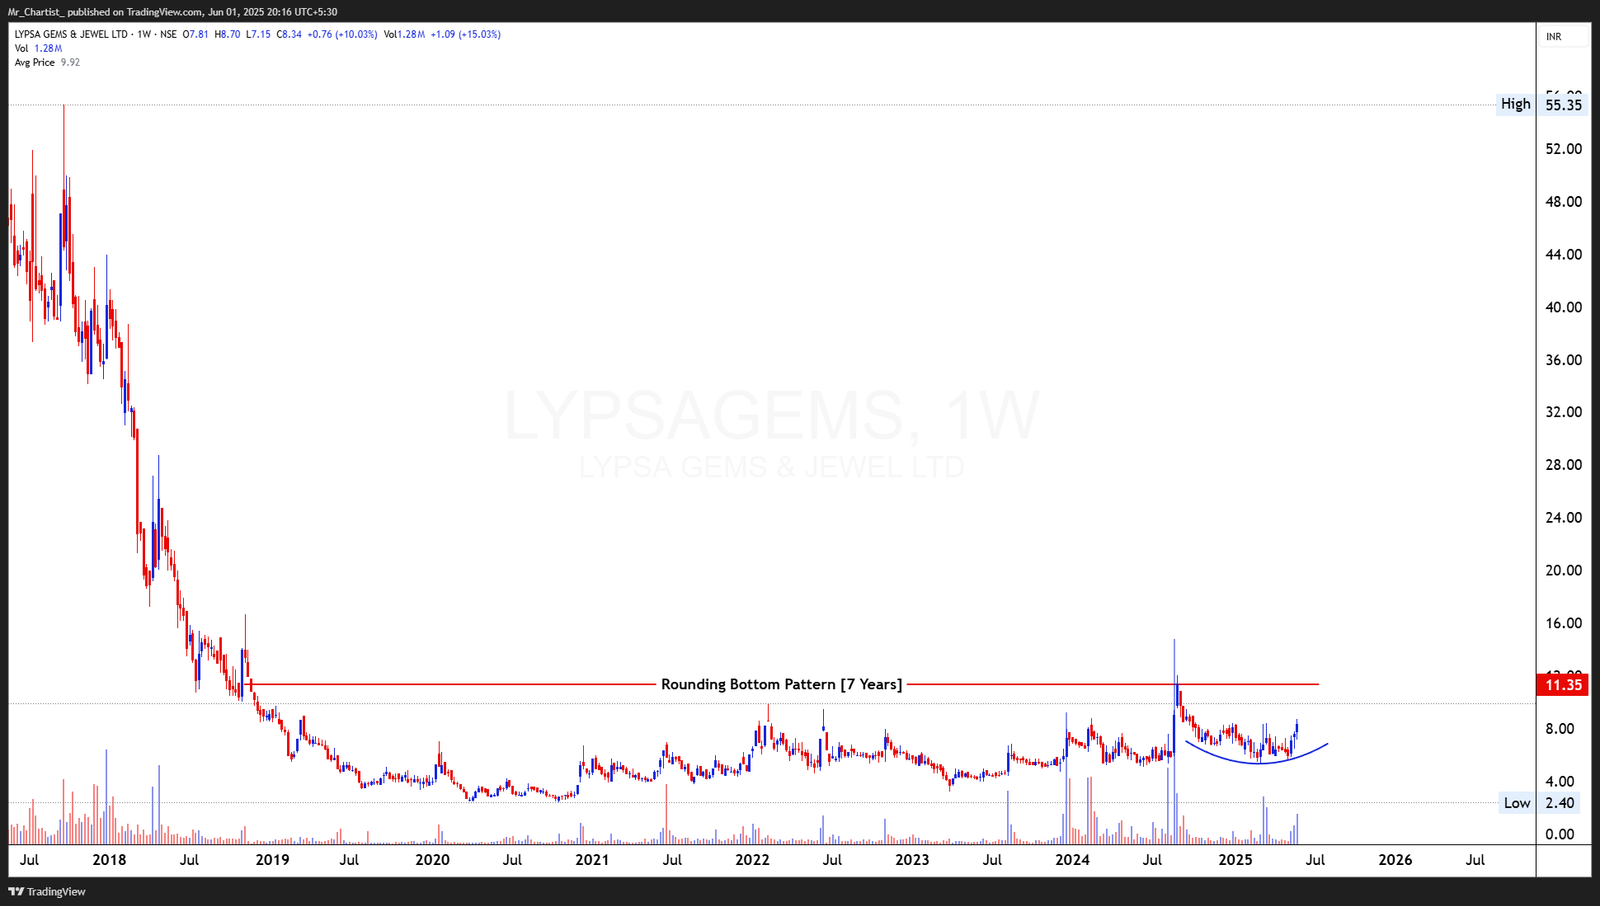
bearish fnoThe recent weekly candles show a clear bullish bias, with higher closes and small lower
Rounding Bottom Pattern [7 Years]
Thesis & Analysis
Price Action Overview: Lypsa Gems is in the late stage of forming a 7-year rounding bottom—a long-term basing pattern that typically precedes major structural reversals. Since bottoming out around ₹2.40 in early 2020, the stock has slowly carved out a shallow upward curve. The price is now climbing toward the neckline resistance near ₹11.35, supported by rising volume and tighter price action—classic characteristics of a breakout buildup. The current advance is part of the right-side curve of the formation, indicating renewed accumulation and improving sentiment. Price has already absorbed multiple supply zones along the base and is approaching a potential breakout trigger point. Candlestick Pattern: The recent weekly candles show a clear bullish bias, with higher closes and small lower wicks. The latest candle is strong-bodied with a 10% gain—indicating buyer dominance with minimal supply rejection. Volume Analysis: Volume has picked up sharply in the last few weeks—well above the multi-year average of ~300K—suggesting a new wave of participation. A surge above ₹11.35 on volume exceeding 2M would be an ideal breakout confirmation. 2. Crucial Support and Resistance Levels Support Levels: ₹7.40: Recent swing low and demand zone. ₹6.25: Previous congestion base from late 2023. ₹4.80: Structural support from rounded base’s midpoint. Resistance Levels: ₹11.35: Neckline and multi-year breakout point. ₹15.00: First upside hurdle post-breakout. ₹22.00–25.00: Long-term retracement zone from 2019-2020 decline. 3. Strategic Trade Scenarios Bullish Scenario (Bias View): A breakout above ₹11.35 with volume confirmation would activate this multi-year rounding bottom, potentially unlocking a structural move toward ₹15 and ₹22 over the medium term. The increasing volume, tightening structure, and basing duration all support a high-conviction bullish outlook. Pullback Scenario: If price pauses or dips below ₹8.00, it may consolidate around ₹7.40 before making a fresh attempt. The long-term structure remains bullish as long as ₹6.25 holds.
Price Action
- ■Price action is structurally positive.
- ■Forming higher highs and higher lows.
Volume Profile
- ■Volume is supportive of the price action.
- ■Wait for volume expansion on breakout.
Key Levels
No zones specified
No zones specified
Invalidation Scenario
A weekly close below the support level invalidates this structure.
DCB BANK LTD
bearish fnoDouble Bottom Breakout
Daily Chart
Thesis & Analysis
No detailed thesis provided for this setup.
Price Action
- ■Price action is structurally positive.
- ■Forming higher highs and higher lows.
Volume Profile
- ■Volume is supportive of the price action.
- ■Wait for volume expansion on breakout.
Key Levels
No zones specified
No zones specified
Invalidation Scenario
A weekly close below the support level invalidates this structure.
DCB BANK LTD
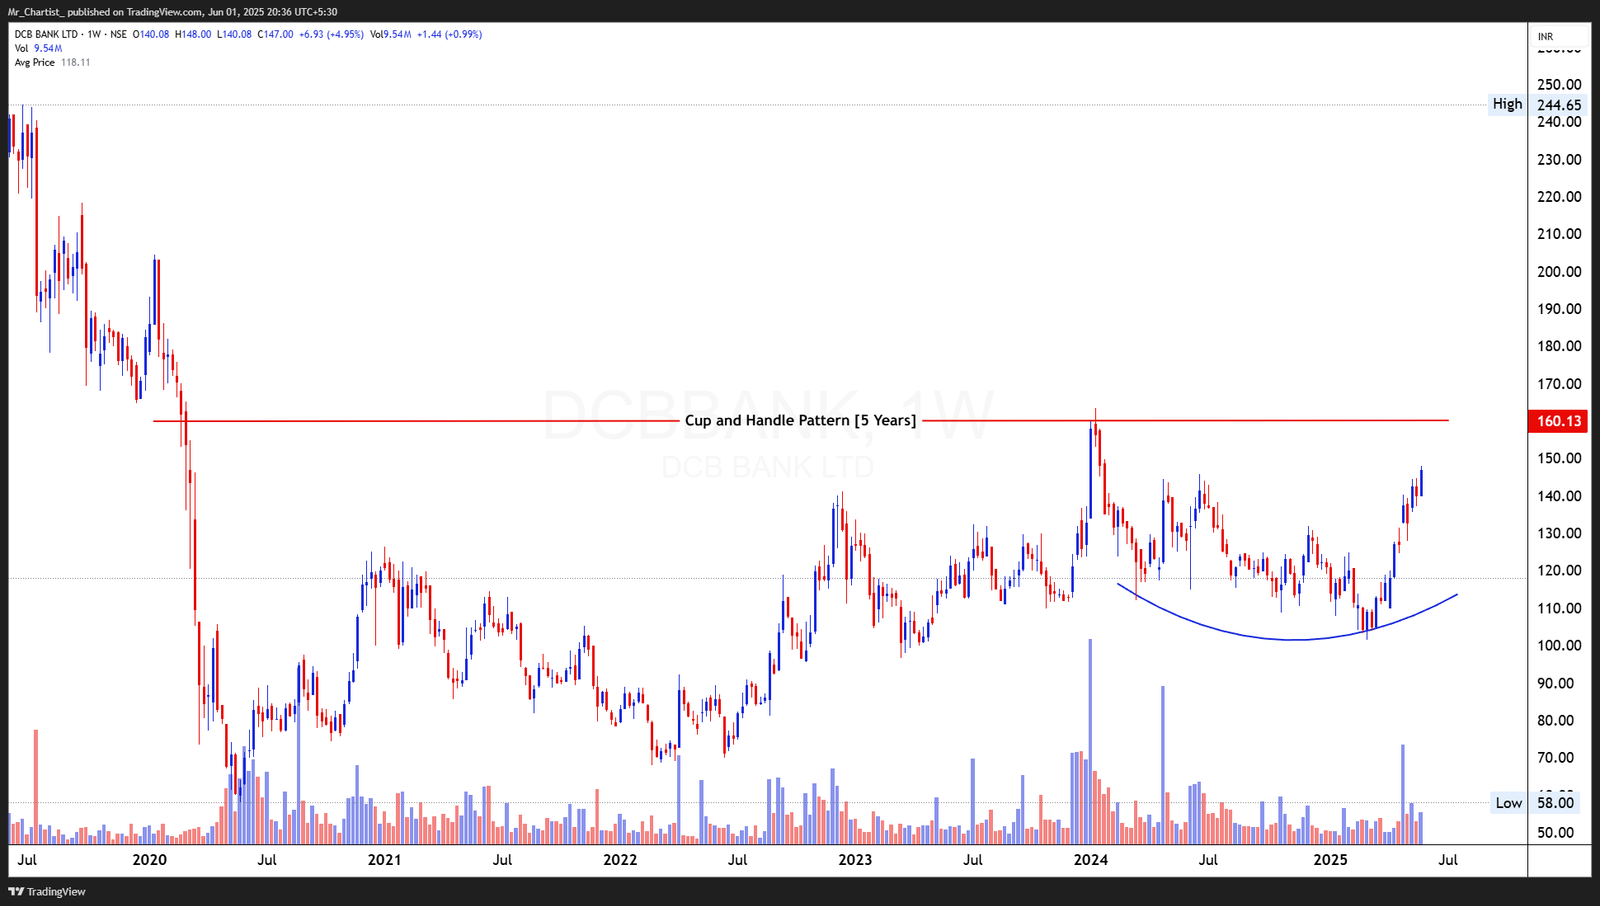
bearish fnoWeekly candles have shown consistent bullish bodies over the past few sessions with
Cup and Handle Pattern [5 Years]
Thesis & Analysis
Price Action Overview: DCB Bank is approaching a major breakout level after completing a 5-year cup and handle pattern. The cup base was formed gradually between 2020 and 2023, while the handle portion developed in a smooth, corrective structure during 2024. The stock has recently rallied off the handle’s base and is now closing in on the neckline resistance near ₹160.13. This long-duration pattern signifies extended accumulation and investor patience. The current rally shows improving momentum and breadth, suggesting the potential for a breakout that could trigger a multi-quarter trend reversal. Candlestick Pattern: Weekly candles have shown consistent bullish bodies over the past few sessions with higher lows and strong follow-through. There is no sign of supply rejection yet as price inches closer to the neckline. Volume Analysis: Volume is picking up gradually, especially on up weeks. A sharp spike above 10M during a breakout above ₹160 would provide the final confirmation of pattern validation and increase the likelihood of sustained move. 2. Crucial Support and Resistance Levels Support Levels: ₹138: Recent swing low from this rally leg. ₹125–128: Handle base support. ₹110: Broader consolidation zone from 2023–2024. Resistance Levels: ₹160.13: Cup and handle neckline and immediate breakout level. ₹180: Short-term target if breakout confirms. ₹200–210: Measured move zone based on cup depth. 3. Strategic Trade Scenarios Bullish Scenario (Bias View): A breakout above ₹160.13 with strong volume would confirm this rare multi-year bullish reversal, targeting ₹180 initially and potentially ₹200+ over the medium term. The structure is highly constructive and supported by improving volume and consistent higher closes. Pullback Scenario: If the price pauses or corrects, any retest of ₹138–₹128 could serve as a bullish re-entry area. The breakout setup remains valid unless price breaks decisively below ₹110.
Price Action
- ■Price action is structurally positive.
- ■Forming higher highs and higher lows.
Volume Profile
- ■Volume is supportive of the price action.
- ■Wait for volume expansion on breakout.
Key Levels
No zones specified
No zones specified
Invalidation Scenario
A weekly close below the support level invalidates this structure.
IDBI BANK LTD
bearish fnoDouble Bottom Breakout
Daily Chart
Thesis & Analysis
No detailed thesis provided for this setup.
Price Action
- ■Price action is structurally positive.
- ■Forming higher highs and higher lows.
Volume Profile
- ■Volume is supportive of the price action.
- ■Wait for volume expansion on breakout.
Key Levels
No zones specified
No zones specified
Invalidation Scenario
A weekly close below the support level invalidates this structure.
IDBI BANK LTD
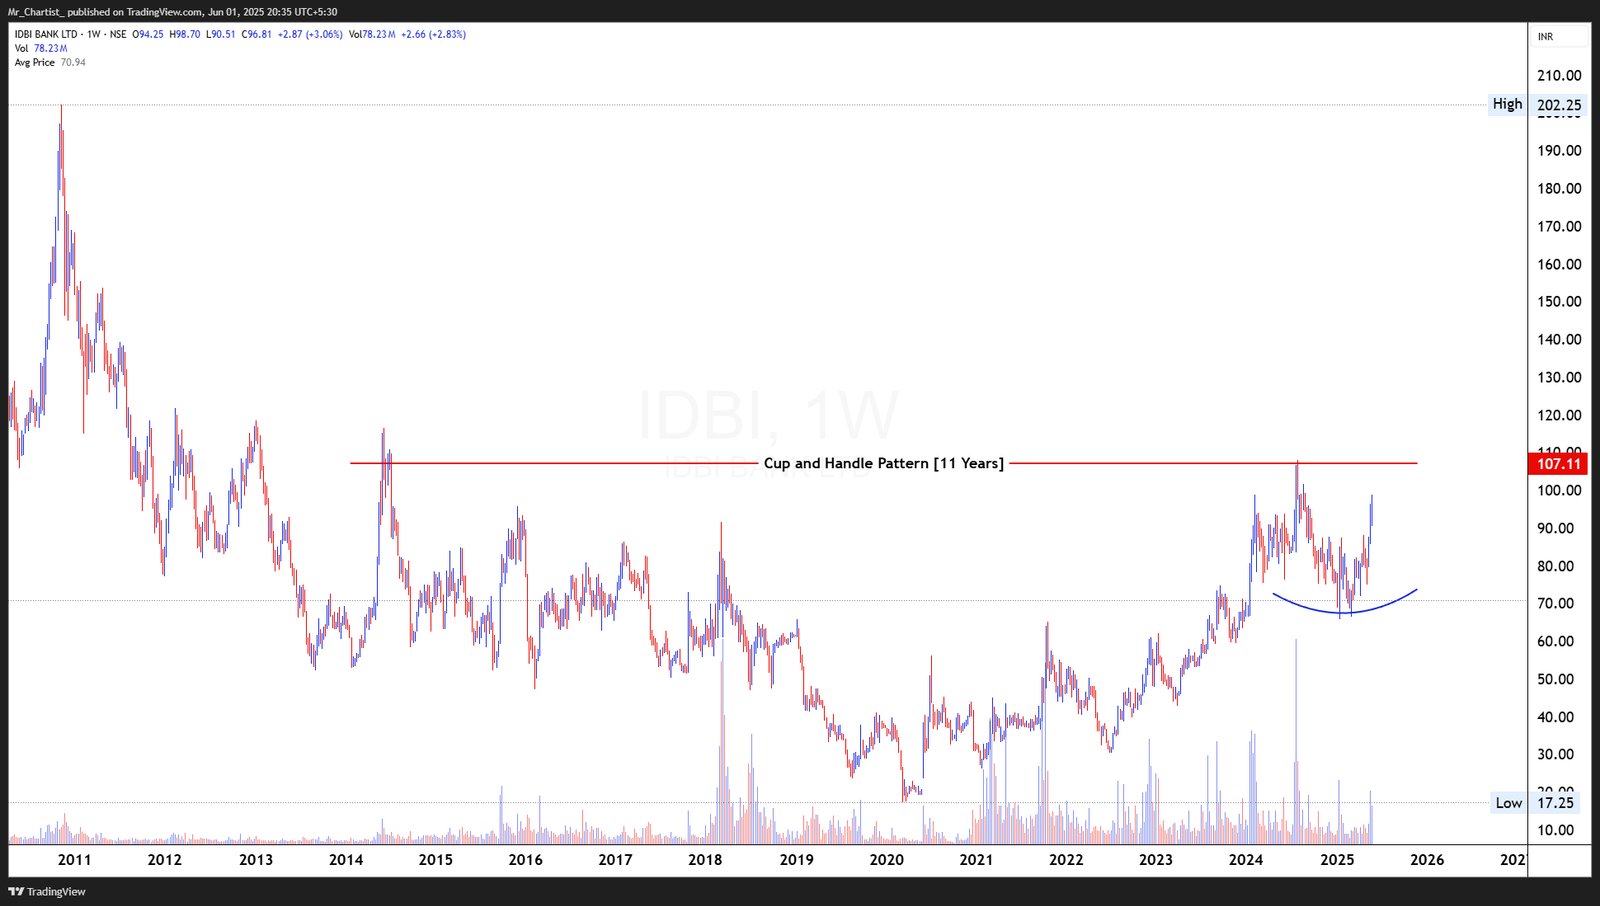
bearish fnoRecent weekly candles are rising in strength with increasing body sizes and higher lows.
Cup and Handle Pattern [11 Years]
Thesis & Analysis
Price Action Overview: IDBI Bank is at the verge of completing a rare and extremely long-term cup and handle pattern stretching over 11 years. The rounded base took shape between 2014 and 2022, while the handle has developed more recently between 2023 and 2025. The price is now building momentum on the right side of the handle, approaching the crucial neckline at ₹107.11. This is a structurally powerful setup where a breakout could trigger a multi-year trend reversal. The handle formation has been relatively shallow with tightening ranges, indicating constructive consolidation and low volatility—often preceding explosive breakouts. Candlestick Pattern: Recent weekly candles are rising in strength with increasing body sizes and higher lows. There are no signs of upper rejection so far, reflecting consistent accumulation and bullish participation. Volume Analysis: Volume has shown consistent expansion on up weeks, particularly since the start of 2025. A breakout above ₹107 on volume north of 100M would serve as a confirmation trigger, validating the pattern’s integrity. 2. Crucial Support and Resistance Levels Support Levels: ₹88–90: Immediate short-term support from last swing low. ₹76–78: Handle base and rising support line. ₹65: Long-term structural base of the last accumulation phase. Resistance Levels: ₹107.11: Neckline and all-important breakout level. ₹125–130: First post-breakout swing target. ₹160–170: Long-term pattern projection zone based on cup depth. 3. Strategic Trade Scenarios Bullish Scenario (Bias View): A breakout above ₹107.11 with convincing volume would activate this multi-decade trend reversal and could lead to substantial upside over time. Initial targets lie at ₹125 and ₹160+, while the base and handle formation support the long-term bullish outlook. Pullback Scenario: Should price pause, a healthy dip toward ₹88 or ₹76 would be an ideal retest of the handle base. As long as ₹65 holds, the structural setup remains bullish and valid.
Price Action
- ■Price action is structurally positive.
- ■Forming higher highs and higher lows.
Volume Profile
- ■Volume is supportive of the price action.
- ■Wait for volume expansion on breakout.
Key Levels
No zones specified
No zones specified
Invalidation Scenario
A weekly close below the support level invalidates this structure.
STRIDES PHARMA SCIENCE LTD
bearish fnoDouble Bottom Breakout
Daily Chart
Thesis & Analysis
No detailed thesis provided for this setup.
Price Action
- ■Price action is structurally positive.
- ■Forming higher highs and higher lows.
Volume Profile
- ■Volume is supportive of the price action.
- ■Wait for volume expansion on breakout.
Key Levels
No zones specified
No zones specified
Invalidation Scenario
A weekly close below the support level invalidates this structure.
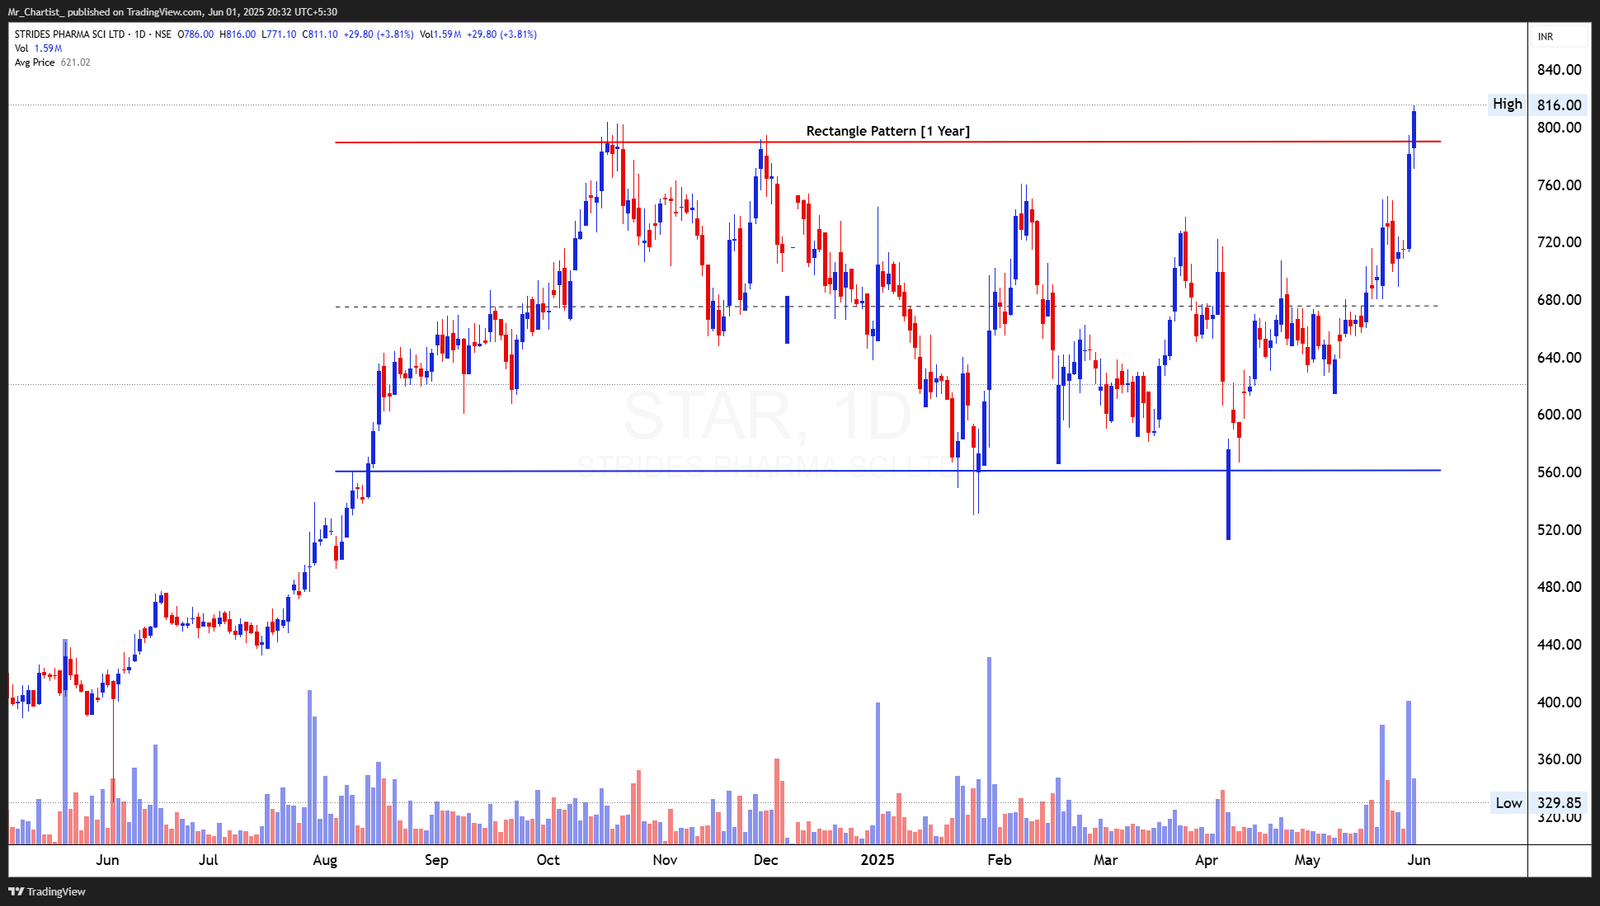
STRIDES PHARMA SCIENCE LTD
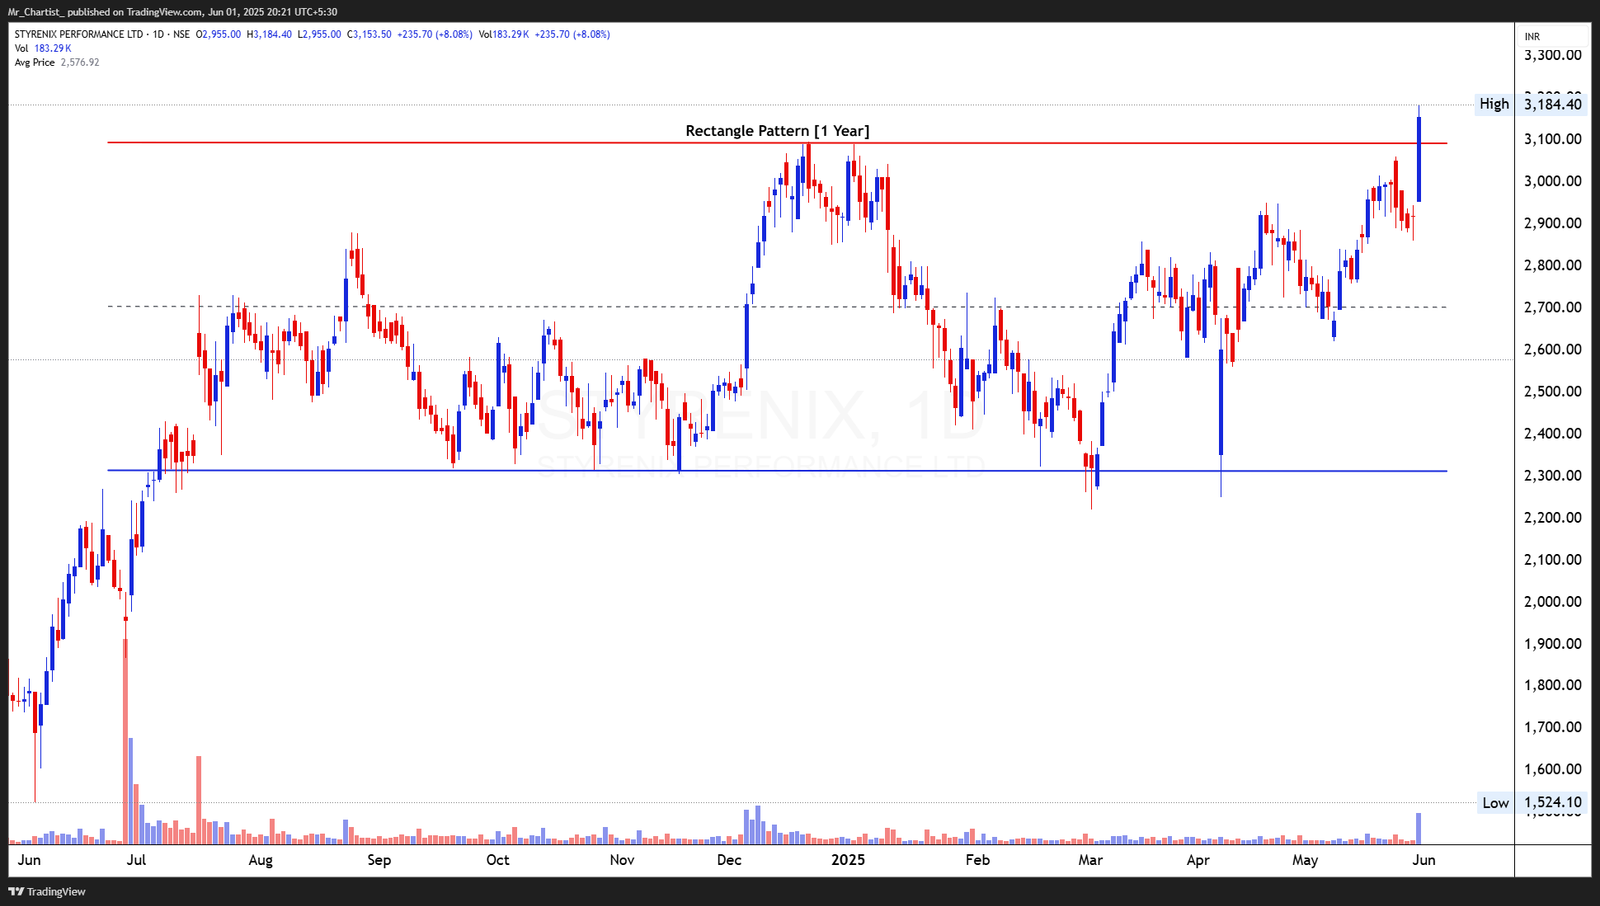
bearish fnoThe breakout candle is wide-ranged and closes strongly above the upper resistance with
Rectangle Pattern [1 Year]
Thesis & Analysis
Price Action Overview: Strides Pharma has successfully broken out of a 1-year rectangle consolidation zone, bounded between ₹565 and ₹805. This prolonged range had developed after a strong prior uptrend, making it a classic continuation setup. The breakout above ₹805 occurred with sharp momentum, suggesting renewed trend expansion after a year of sideways compression. This type of technical breakout following long consolidation often leads to a measured move rally, particularly when the pre-consolidation trend was strong—adding weight to the bullish continuation case. Candlestick Pattern: The breakout candle is wide-ranged and closes strongly above the upper resistance with minimal upper wick, suggesting follow-through potential. Prior candles showed narrowing ranges and higher lows, confirming breakout anticipation. Volume Analysis: Volume has expanded notably in the last two sessions, significantly above the 20-day average. This volume breakout confirms institutional participation and adds credibility to the pattern resolution. 2. Crucial Support and Resistance Levels Support Levels: ₹805: Breakout level and immediate support on retest. ₹745–750: Recent breakout buildup zone. ₹685: Midpoint of the rectangle and former resistance-turned-support. Resistance Levels: ₹850: Psychological barrier and minor overhead supply zone. ₹900–920: Projected range target based on rectangle height. ₹980–1,000: Extension level from previous trend rally. 3. Strategic Trade Scenarios Bullish Scenario (Bias View): The confirmed breakout from a year-long rectangle with rising volume opens the path for continuation toward ₹900–₹920, and potentially ₹1,000 if momentum persists. Sustained price action above ₹805 keeps the bullish trend intact. Pullback Scenario: A shallow pullback toward ₹805–₹785 is possible; however, any hold above this zone would offer fresh entry opportunity. Breakdown below ₹745 would weaken near-term momentum but not invalidate the broader structure unless ₹685 is breached.
Price Action
- ■Price action is structurally positive.
- ■Forming higher highs and higher lows.
Volume Profile
- ■Volume is supportive of the price action.
- ■Wait for volume expansion on breakout.
Key Levels
No zones specified
No zones specified
Invalidation Scenario
A weekly close below the support level invalidates this structure.
FEDERAL-MOGUL GOETZE (INDIA) LTD
bearish fnoDouble Bottom Breakout
Daily Chart
Thesis & Analysis
No detailed thesis provided for this setup.
Price Action
- ■Price action is structurally positive.
- ■Forming higher highs and higher lows.
Volume Profile
- ■Volume is supportive of the price action.
- ■Wait for volume expansion on breakout.
Key Levels
No zones specified
No zones specified
Invalidation Scenario
A weekly close below the support level invalidates this structure.
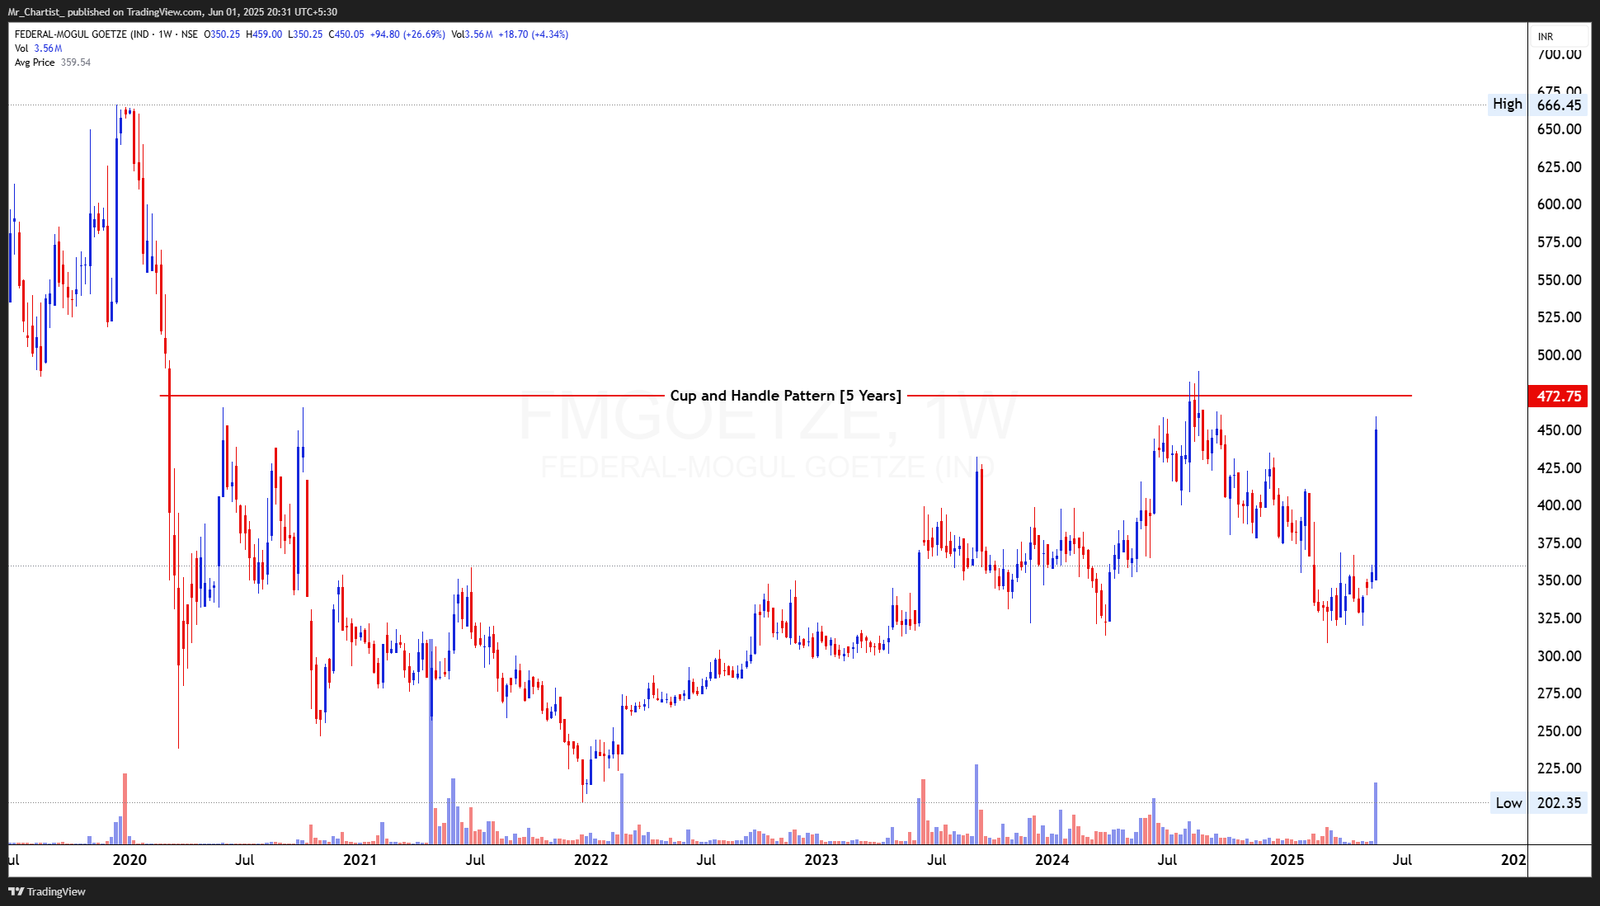
FEDERAL-MOGUL GOETZE (INDIA) LTD
bearish fnoThe latest candle is a strong, long-bodied bullish bar that covers multiple prior weekly
Cup and Handle Pattern [5 Years]
Thesis & Analysis
Price Action Overview: Federal-Mogul Goetze is nearing a decisive breakout from a 5-year cup and handle formation, with the neckline placed at ₹472.75. The cup base formed through a long accumulation phase from 2020–2023, and the handle emerged as a downward-sloping consolidation during 2024–early 2025. The recent surge off the handle low has resulted in a strong weekly bar, closing just below the breakout trigger level. This structure suggests a potential transition from accumulation to markup phase, with price preparing to challenge multi-year resistance. The pattern is wide and well-formed, which increases its reliability. Candlestick Pattern: The latest candle is a strong, long-bodied bullish bar that covers multiple prior weekly highs in a single move, confirming dominance by buyers. This setup reflects breakout anticipation and strengthens the bullish tone. Volume Analysis: Volume has expanded to a multi-quarter high during the current upswing. This early volume expansion suggests institutional interest building up ahead of a potential breakout. 2. Crucial Support and Resistance Levels Support Levels: ₹420: Near-term support from recent breakout bar. ₹390: Handle midpoint and prior resistance. ₹345: Handle base and structure-defining level. Resistance Levels: ₹472.75: Key neckline of cup and handle; breakout trigger. ₹525–540: Immediate post-breakout supply zone. ₹600–620: Projected zone based on pattern depth. 3. Strategic Trade Scenarios Bullish Scenario (Bias View): A breakout above ₹472.75 on strong weekly volume would confirm the cup and handle breakout, with targets around ₹525 followed by ₹600. The multi-year basing pattern and rising volume profile reinforce a bullish bias. Pullback Scenario: A dip toward ₹420–₹390 is possible and would offer a potential base-building opportunity before breakout. Structure remains bullish unless price drops below ₹345, which would invalidate the handle.
Price Action
- ■Price action is structurally positive.
- ■Forming higher highs and higher lows.
Volume Profile
- ■Volume is supportive of the price action.
- ■Wait for volume expansion on breakout.
Key Levels
No zones specified
No zones specified
Invalidation Scenario
A weekly close below the support level invalidates this structure.
CARYSIL LTD
bearish fnoDouble Bottom Breakout
Daily Chart
Thesis & Analysis
No detailed thesis provided for this setup.
Price Action
- ■Price action is structurally positive.
- ■Forming higher highs and higher lows.
Volume Profile
- ■Volume is supportive of the price action.
- ■Wait for volume expansion on breakout.
Key Levels
No zones specified
No zones specified
Invalidation Scenario
A weekly close below the support level invalidates this structure.
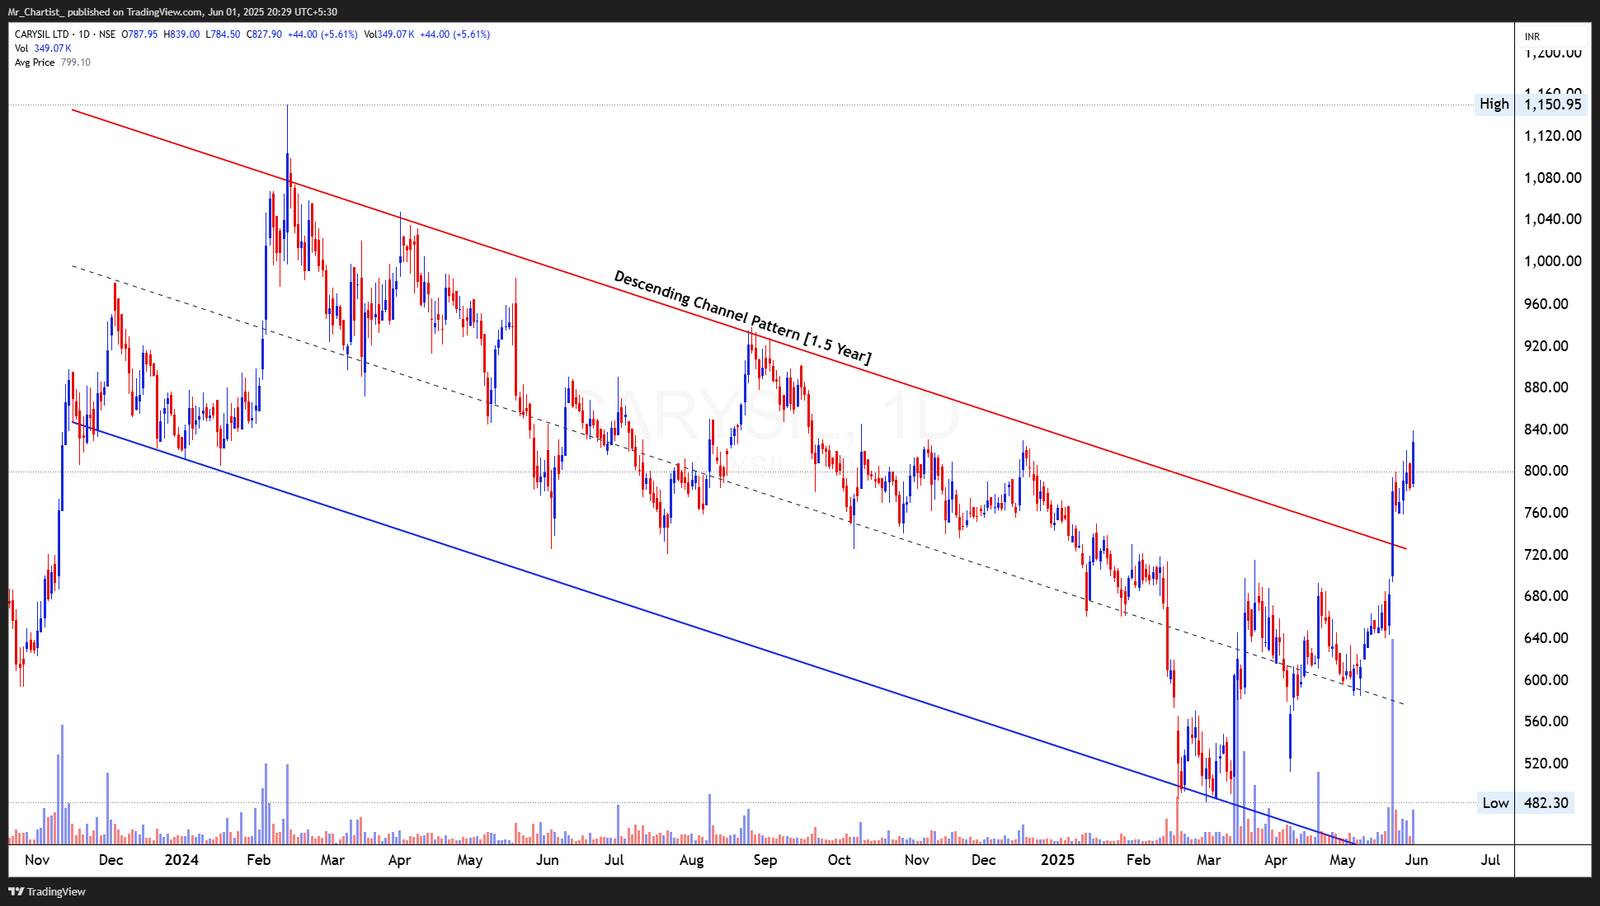
CARYSIL LTD
bearish fnoThe breakout session is a wide-bodied bullish candle with a close near the high of
Descending Channel Pattern [1.5 Years]
Thesis & Analysis
Price Action Overview: Carysil has decisively broken out from a 1.5-year descending channel, which had contained price action since early 2023. The breakout came after multiple tests of both lower and upper bounds, suggesting weakening seller control and a potential trend reversal. The breakout candle is robust, cutting through the channel resistance with strong momentum. Notably, the move also reclaimed a long stretch of supply zones, marking a bullish shift from contraction to expansion. Candlestick Pattern: The breakout session is a wide-bodied bullish candle with a close near the high of the day, confirming strength and urgency. Preceding candles showed higher lows and rising range, foreshadowing the move. Volume Analysis: Volume surged well above the 20-day average, with strong accumulation visible throughout the breakout leg. This is a textbook volume confirmation for a channel breakout, underscoring conviction behind the move. 2. Crucial Support and Resistance Levels Support Levels: ₹790–₹800: Breakout zone and short-term retest area. ₹720: Last pre-breakout consolidation zone. ₹650: Key structural swing low from April. Resistance Levels: ₹880: Intermediate hurdle from July 2023 swing high. ₹920–940: Previous supply cluster and psychological level. ₹1,000+: Channel projection and prior highs. 3. Strategic Trade Scenarios Bullish Scenario (Bias View): With a confirmed breakout from a long descending channel backed by high volume, Carysil enters a fresh bullish phase. A sustained close above ₹800 increases the probability of a rally toward ₹880–₹940, with room for further upside toward ₹1,000 over time. Pullback Scenario: Should price revisit the breakout zone, the ₹790–₹720 band serves as a healthy re- entry zone. Only a breakdown below ₹650 would damage the bullish outlook.
Price Action
- ■Price action is structurally positive.
- ■Forming higher highs and higher lows.
Volume Profile
- ■Volume is supportive of the price action.
- ■Wait for volume expansion on breakout.
Key Levels
No zones specified
No zones specified
Invalidation Scenario
A weekly close below the support level invalidates this structure.
MMTC LTD
bearish fnoDouble Bottom Breakout
Daily Chart
Thesis & Analysis
No detailed thesis provided for this setup.
Price Action
- ■Price action is structurally positive.
- ■Forming higher highs and higher lows.
Volume Profile
- ■Volume is supportive of the price action.
- ■Wait for volume expansion on breakout.
Key Levels
No zones specified
No zones specified
Invalidation Scenario
A weekly close below the support level invalidates this structure.
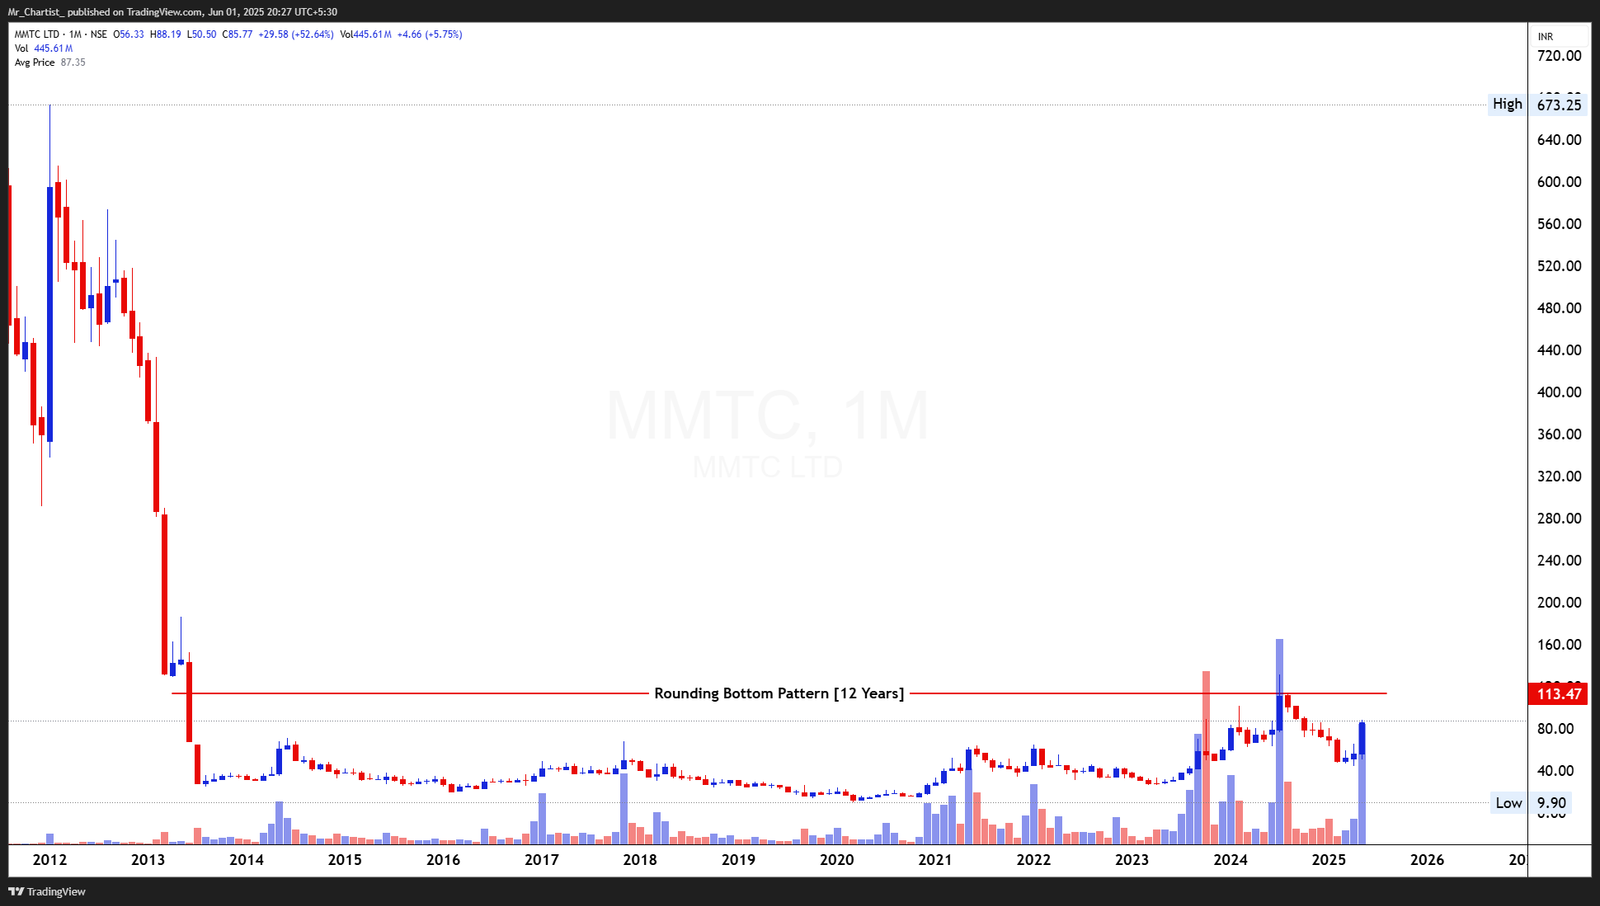
MMTC LTD
bearish fnoThe latest monthly candle is a large bullish bar, engulfing multiple prior ranges, with a
Rounding Bottom Pattern [12 Years]
Thesis & Analysis
Price Action Overview: MMTC is exhibiting one of the most extended rounding bottom formations, developing over 12 years since its post-2011 decline. After years of horizontal base-building between ₹20–₹50, the stock has been forming higher lows over the past 2–3 years, now approaching the long-standing neckline resistance at ₹113.47. The structural maturity of this pattern indicates a long-term accumulation cycle nearing completion. Recent candles show expanding bodies and strong volume support, highlighting institutional interest and bullish positioning ahead of a potential breakout. Candlestick Pattern: The latest monthly candle is a large bullish bar, engulfing multiple prior ranges, with a close near the high and no upper wick—reflecting strong conviction. Previous candles formed a tight base near the ₹55–65 range, supporting a buildup scenario. Volume Analysis: Volume has risen sharply over recent months, especially during bullish advances. The consistent surges on up-months reflect early breakout accumulation, aligning with classical rounding bottom behavior. 2. Crucial Support and Resistance Levels Support Levels: ₹72: Last breakout base on the monthly chart. ₹60: Rising demand zone from early 2024. ₹45: Structural low of the base, significant long-term support. Resistance Levels: ₹113.47: Decisive multi-year neckline resistance. ₹130: Minor post-breakout psychological level. ₹160–180: Long-term rally projection based on base height. 3. Strategic Trade Scenarios Bullish Scenario (Bias View): A monthly close above ₹113.47 with strong volume would trigger a major bullish breakout, potentially unlocking a long-term rally toward ₹160 and beyond. The 12-year rounding bottom sets the stage for a powerful cyclical reversal with deep market memory. Pullback Scenario: Any retracement toward ₹72–₹60 would remain structurally bullish, offering a healthy retest before the breakout. Breakdown below ₹45 would negate the entire rounding base.
Price Action
- ■Price action is structurally positive.
- ■Forming higher highs and higher lows.
Volume Profile
- ■Volume is supportive of the price action.
- ■Wait for volume expansion on breakout.
Key Levels
No zones specified
No zones specified
Invalidation Scenario
A weekly close below the support level invalidates this structure.
CLEAN SCIENCE & TECHNOLOGY LTD
bearish fnoDouble Bottom Breakout
Daily Chart
Thesis & Analysis
No detailed thesis provided for this setup.
Price Action
- ■Price action is structurally positive.
- ■Forming higher highs and higher lows.
Volume Profile
- ■Volume is supportive of the price action.
- ■Wait for volume expansion on breakout.
Key Levels
No zones specified
No zones specified
Invalidation Scenario
A weekly close below the support level invalidates this structure.
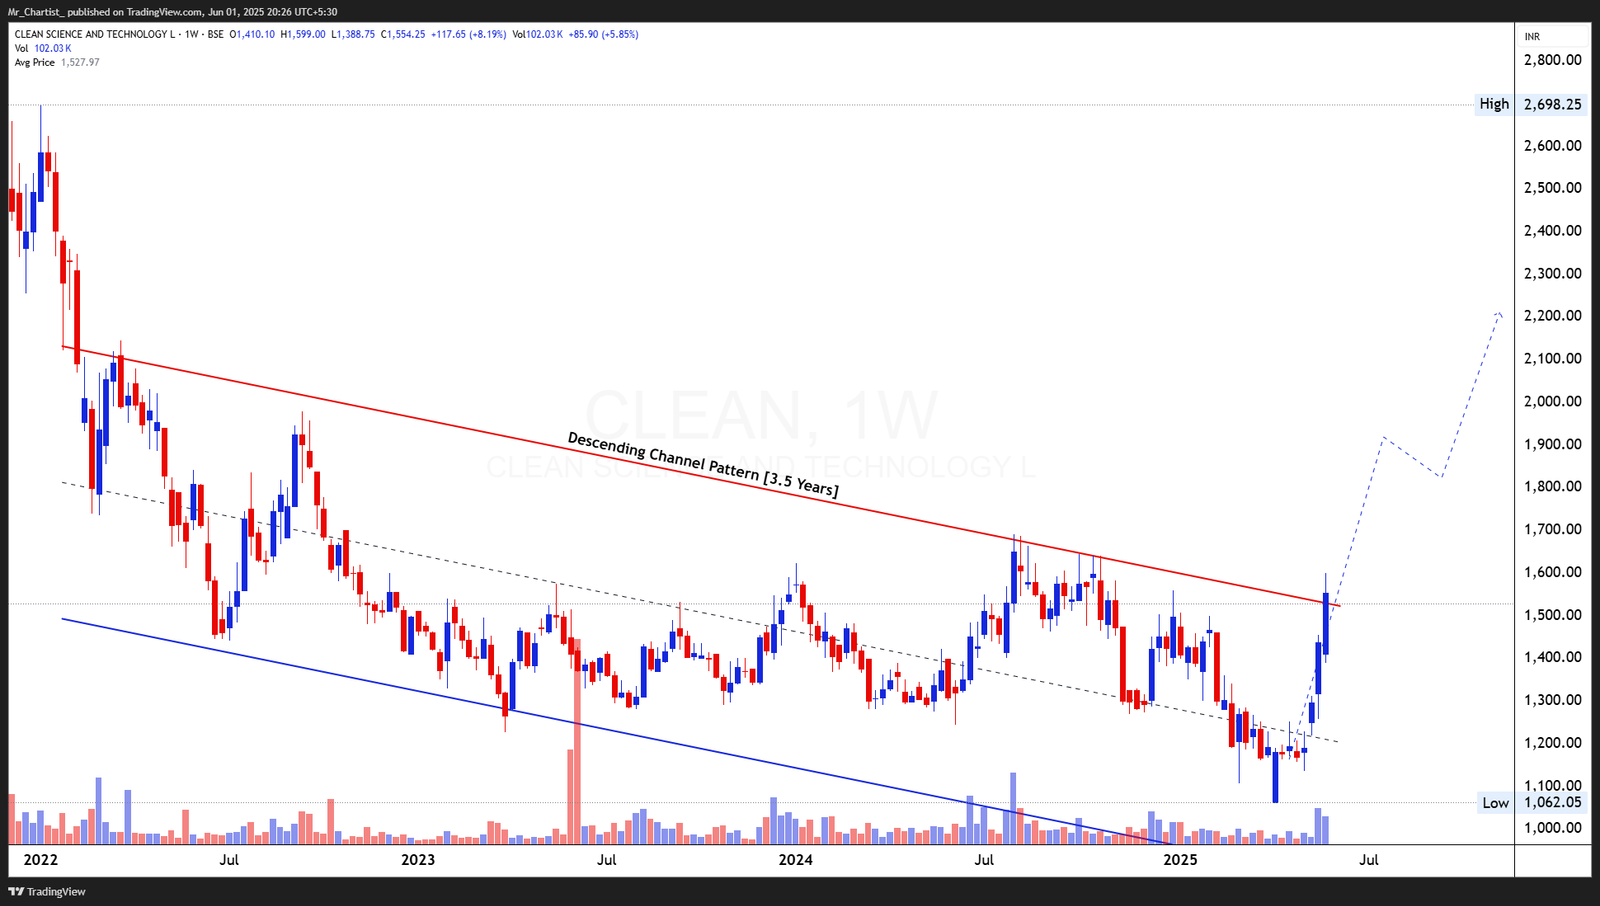
CLEAN SCIENCE
bearish fnoThe latest weekly candle is a long bullish bar, extending above the channel boundary
Descending Channel Pattern [3.5 Years]
Thesis & Analysis
Price Action Overview: Clean Science & Technology has staged a breakout from a long-standing descending channel that governed the trend since late 2021. The breakout comes after a sharp, impulsive move from the lower boundary of the channel and is now pushing through the upper resistance with strong price action and rising volume. This breakout ends a prolonged downtrend and hints at a structural reversal, especially given the smooth price curvature and clear change in momentum since mid-May. Candlestick Pattern: The latest weekly candle is a long bullish bar, extending above the channel boundary with a decisive close near the high. The two-week pattern preceding it forms a mini- bullish reversal base, adding weight to the breakout’s sustainability. Volume Analysis: Volume has expanded notably on the breakout bar—its highest in months. This volume confirmation is crucial, as it suggests accumulation by smart money ahead of a potential trend reversal. 2. Crucial Support and Resistance Levels Support Levels: ₹1,480–1,500: Fresh breakout zone and immediate short-term support. ₹1,360: Last minor swing before breakout. ₹1,200: Channel midpoint and structural higher low. Resistance Levels: ₹1,720: Minor swing high from late 2023. ₹1,900: Psychological level and early post-breakout milestone. ₹2,200–2,300: Extended projection zone based on channel width. 3. Strategic Trade Scenarios Bullish Scenario (Bias View): A confirmed breakout from a multi-year descending channel coupled with rising volume suggests strong reversal potential. If the stock holds above ₹1,500, there's scope for a continued rally toward ₹1,720–₹1,900, with ₹2,200 as a longer-term positional target. Pullback Scenario: A retest toward ₹1,480–₹1,360 could emerge post-breakout cooling, offering a strong structural support zone. The outlook remains bullish unless price re-enters the channel below ₹1,200.
Price Action
- ■Price action is structurally positive.
- ■Forming higher highs and higher lows.
Volume Profile
- ■Volume is supportive of the price action.
- ■Wait for volume expansion on breakout.
Key Levels
No zones specified
No zones specified
Invalidation Scenario
A weekly close below the support level invalidates this structure.
MADHYA BHARAT AGRO PRODUCTS LTD (MBAPL)
bearish fnoDouble Bottom Breakout
Daily Chart
Thesis & Analysis
No detailed thesis provided for this setup.
Price Action
- ■Price action is structurally positive.
- ■Forming higher highs and higher lows.
Volume Profile
- ■Volume is supportive of the price action.
- ■Wait for volume expansion on breakout.
Key Levels
No zones specified
No zones specified
Invalidation Scenario
A weekly close below the support level invalidates this structure.
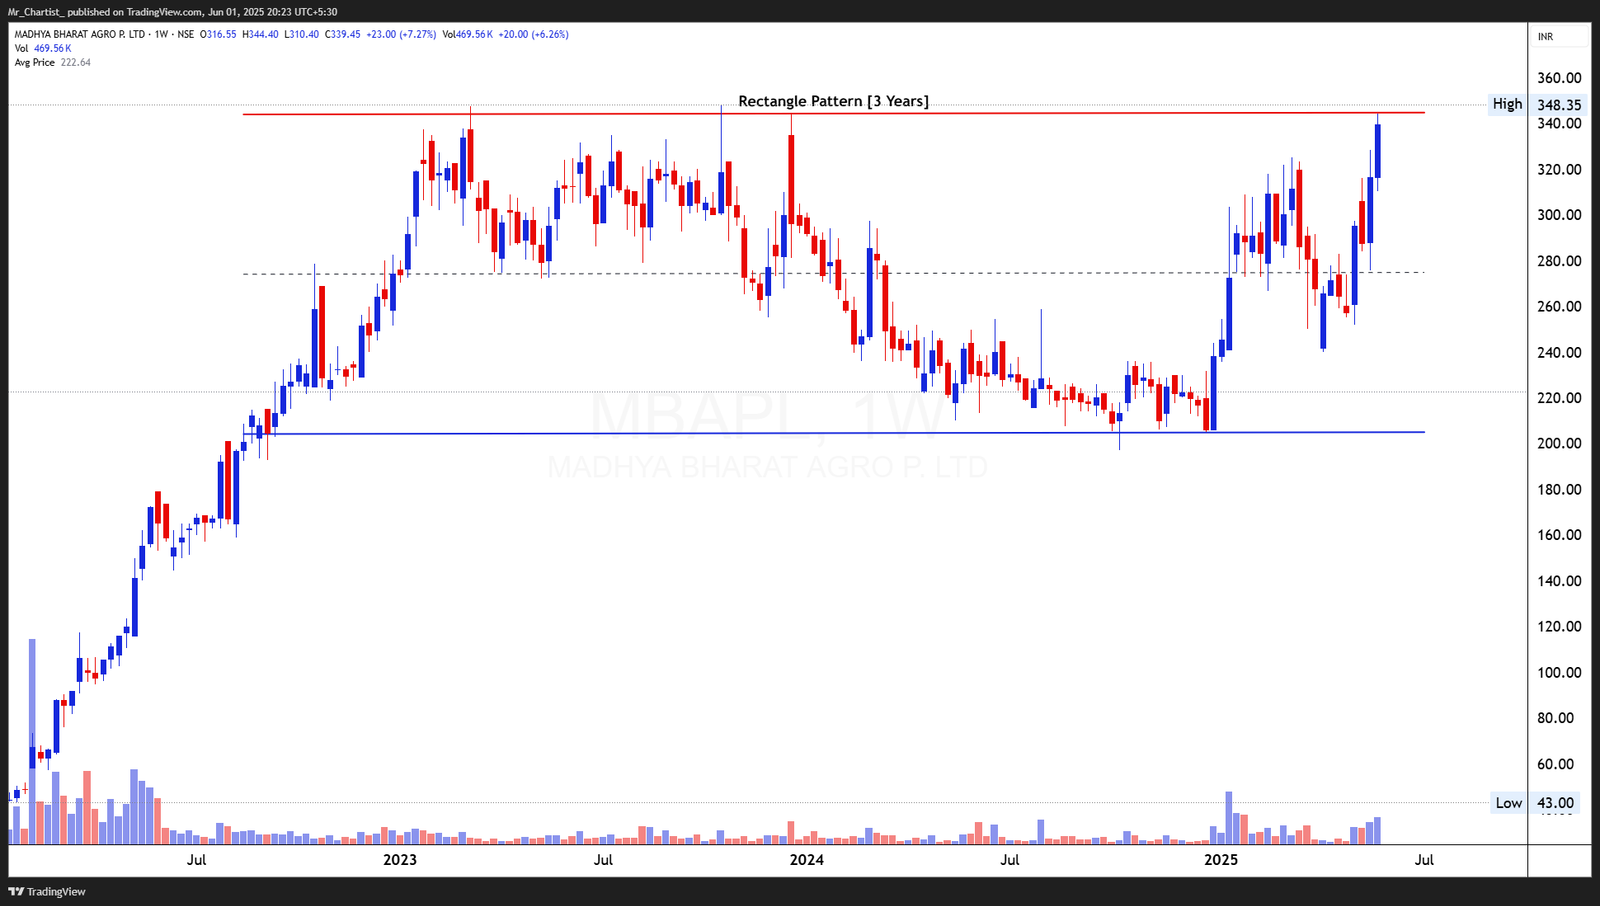
MBAPL
bearish fnoThe current candle is a strong bullish continuation bar with minor upper wick,
Rectangle Pattern [3 Years]
Thesis & Analysis
Price Action Overview: MBAPL has approached the upper boundary of a well-defined rectangle range that has held for over three years, with price oscillating between ₹210 and ₹348. The current upmove from the lower boundary has been sharp and controlled, suggesting institutional accumulation during the prior base formation. This recent rally marks the third retest of the ₹348 ceiling—making it a critical resistance level. Price surged over 6% this week with a strong weekly close just beneath this zone, hinting at a potential breakout attempt underway. Candlestick Pattern: The current candle is a strong bullish continuation bar with minor upper wick, signifying persistent demand near resistance. The three-week structure before this rally formed a tight higher-low base, supportive of sustained upside pressure. Volume Analysis: Volume surged consistently through the rally phase, confirming strong participation. The latest push into resistance is backed by rising volume, aligning with breakout preconditions in rectangle structures. 2. Crucial Support and Resistance Levels Support Levels: ₹285–₹290: Recent breakout pivot within the rectangle range. ₹240: Previous demand zone and short-term retracement base. ₹210: Historical multi-year support and rectangle floor. Resistance Levels: ₹348: Rectangle resistance zone in place since 2022. ₹370–₹385: Minor psychological extensions post-breakout. ₹425+: Projected move using height of the rectangle pattern. 3. Strategic Trade Scenarios Bullish Scenario (Bias View): A weekly close above ₹348 would confirm a breakout from this 3-year consolidation pattern. Based on rectangle height (~₹135), this implies potential upside toward ₹425+ in the coming months, especially if breakout volume expands further. Pullback Scenario: Failure to break and sustain above ₹348 may lead to a retest toward ₹290–₹285. This zone remains a higher base support unless the price closes back into the core of the rectangle (below ₹240), which would neutralize the breakout outlook.
Price Action
- ■Price action is structurally positive.
- ■Forming higher highs and higher lows.
Volume Profile
- ■Volume is supportive of the price action.
- ■Wait for volume expansion on breakout.
Key Levels
No zones specified
No zones specified
Invalidation Scenario
A weekly close below the support level invalidates this structure.
STYRENIX PERFORMANCE LTD
bearish fnoDouble Bottom Breakout
Daily Chart
Thesis & Analysis
No detailed thesis provided for this setup.
Price Action
- ■Price action is structurally positive.
- ■Forming higher highs and higher lows.
Volume Profile
- ■Volume is supportive of the price action.
- ■Wait for volume expansion on breakout.
Key Levels
No zones specified
No zones specified
Invalidation Scenario
A weekly close below the support level invalidates this structure.
Chart Image Not Extracted
STYRENIX PERFORMANCE LTD
bearish fnoA large bullish marubozu-type candle stands out in today’s move—evidence of one-sided
Rectangle Pattern [1 Year]
Thesis & Analysis
Price Action Overview: Styrenix has just delivered a decisive breakout from a 12-month horizontal rectangle pattern, with the price closing above the key resistance at ₹3,100. This level had capped every rally since mid-2024, creating a broad consolidation range between ₹2,300 and ₹3,100. After multiple failed attempts, the stock finally pierced this ceiling with a strong bullish candle and no upper wick, suggesting firm momentum and minimal resistance during the breakout session. Candlestick Pattern: A large bullish marubozu-type candle stands out in today’s move—evidence of one-sided strength. Prior candles showed a sequence of higher lows, forming a tight ascending base into resistance—a common breakout setup. Volume Analysis: Volume expanded sharply on the breakout day, surpassing the 1-year average volume, signaling conviction buying. The accumulation phase over the past few months showed gradually rising volume on up days—a leading indicator for breakout success. 2. Crucial Support and Resistance Levels Support Levels: ₹3,100: Now acting as immediate breakout support. ₹2,750: Mid-range pivot within rectangle; important reference for pullbacks. ₹2,300: Multi-month rectangle base and structural support. Resistance Levels: ₹3,320–₹3,380: Near-term measured target from rectangle height. ₹3,600+: Longer-term expansion zone, contingent on sustained follow-through. 3. Strategic Trade Scenarios Bullish Scenario (Bias View): A clean daily close above ₹3,100, coupled with elevated volume, affirms the rectangle breakout. A price expansion toward the projected range of ₹3,320–₹3,380 appears logical based on pattern height. Sustaining above ₹3,100 without re-entering the range would reinforce bullish continuation. Pullback Scenario: Any short-term dip that holds above ₹3,100 could offer a retest-buy scenario. A failed breakout with price slipping back into the rectangle and closing below ₹2,950 would negate immediate bullish momentum and shift focus back to the lower boundary at ₹2,300.
Price Action
- ■Price action is structurally positive.
- ■Forming higher highs and higher lows.
Volume Profile
- ■Volume is supportive of the price action.
- ■Wait for volume expansion on breakout.
Key Levels
No zones specified
No zones specified
Invalidation Scenario
A weekly close below the support level invalidates this structure.
Charts to Watch
Setups forming favorable structures
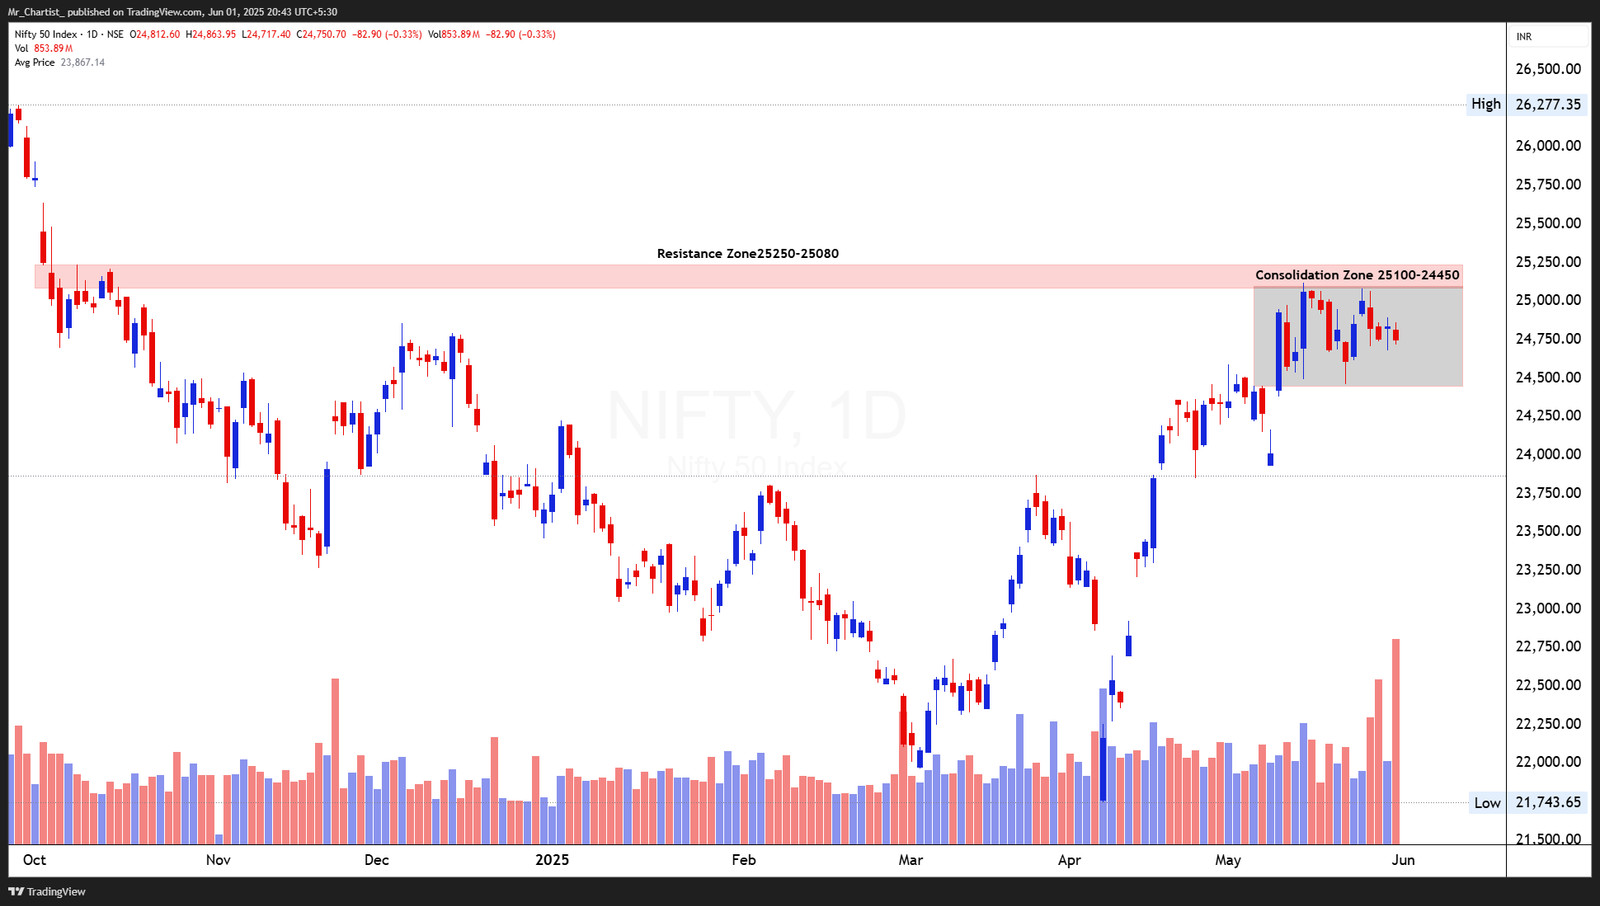
Nifty 50 Index
charts to-watchDouble Bottom Breakout
Daily Chart
Thesis & Analysis
No detailed thesis provided for this setup.
Price Action
- ■Price action is structurally positive.
- ■Forming higher highs and higher lows.
Volume Profile
- ■Volume is supportive of the price action.
- ■Wait for volume expansion on breakout.
Key Levels
No zones specified
No zones specified
Invalidation Scenario
A weekly close below the support level invalidates this structure.
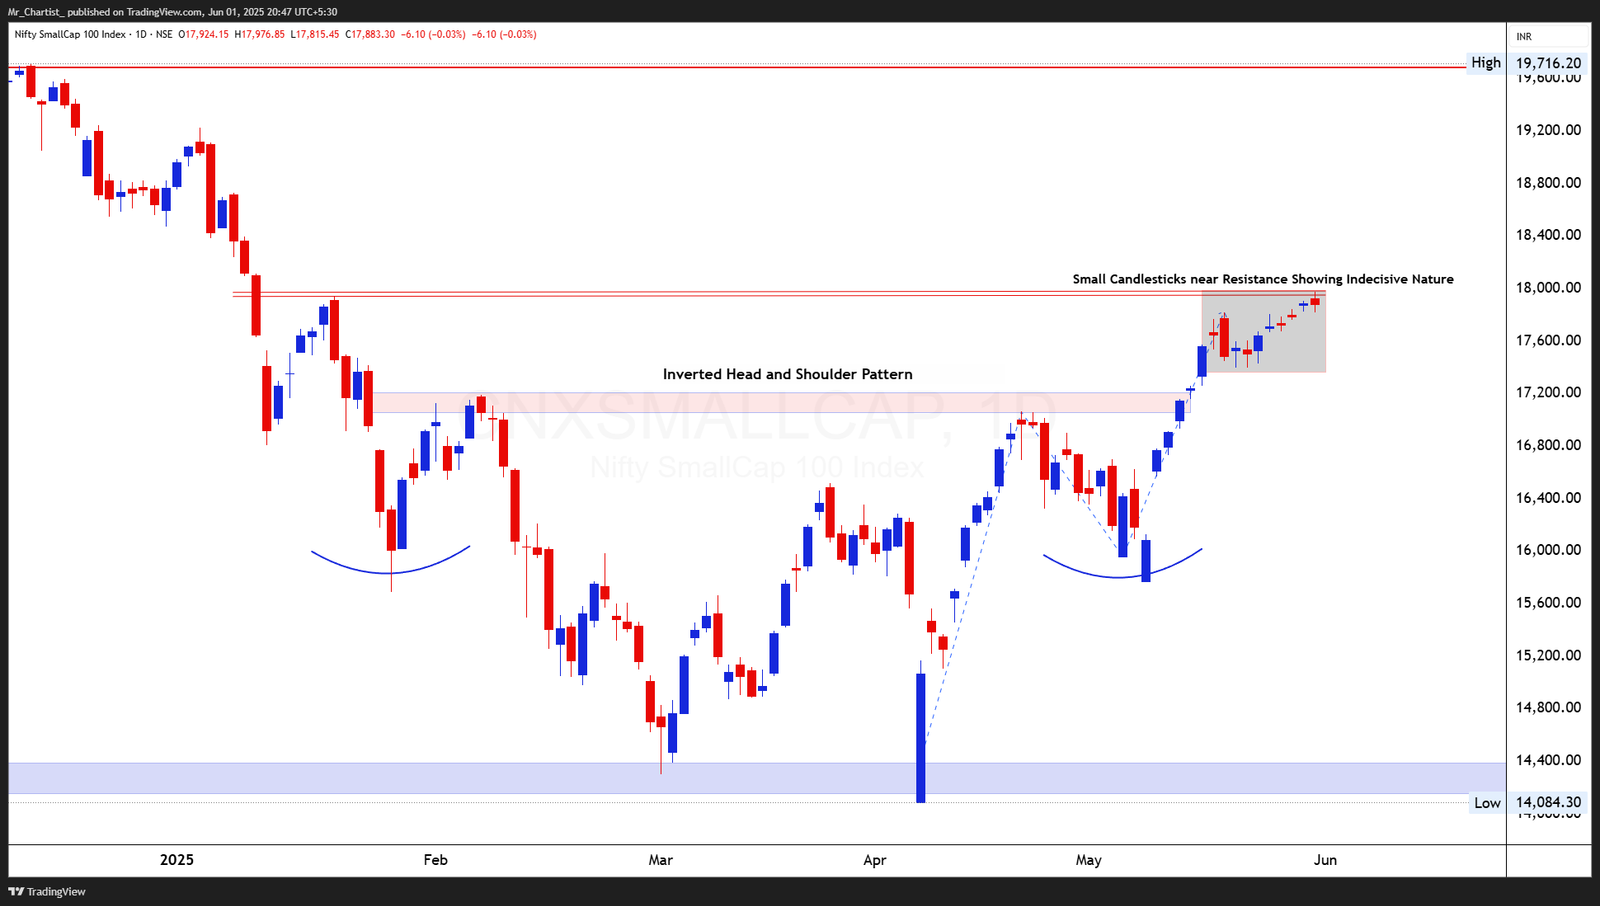
NIFTY 50 INDEX
charts to-watchRecent candles are relatively small-bodied with alternating colors, signaling indecision and lack of
Sideways Consolidation Zone [4 Weeks]
Thesis & Analysis
Price Action Overview: The Nifty 50 index has entered a phase of tight consolidation between 24,450 and 25,100 after a sharp rally that began from the 23,250 level in April. This range-bound structure is forming just below a critical resistance zone at 25,250–25,080, which has historical significance. The current phase reflects a pause in momentum, with prices trading within a well-defined rectangle. The structure appears healthy from a bullish continuation perspective, provided the index eventually breaks above the upper band. Despite several attempts to test the top of the consolidation zone, price has failed to register a decisive breakout so far. However, the lack of sharp rejection candles at resistance indicates that bears are not in control either, pointing to a neutral but potentially bullish setup. Candlestick Pattern: Recent candles are relatively small-bodied with alternating colors, signaling indecision and lack of directional momentum. No major reversal pattern is evident yet, but the absence of strong bullish candles at the upper band shows hesitation. Volume Analysis: Volume has tapered during the consolidation, which is typical in such structures. A volume breakout above 950M accompanied by a large bullish candle would be a key signal for range resolution. 2. Crucial Support and Resistance Levels Support Levels: 24,450: The lower end of the current consolidation; tested multiple times without breakdown. 24,000: Short-term swing support from late April. 23,250: Major breakout base from early May; a critical level for trend continuation. Resistance Levels: 25,100: Immediate ceiling of the current consolidation. 25,250–25,080: A significant horizontal resistance zone that has capped upside for months. 26,277: Previous all-time high and eventual target if breakout succeeds. 3. Strategic Trade Scenarios Bullish Scenario: If Nifty manages to close above 25,100 with rising volume, particularly over 950M, it would signal a likely breakout from the ongoing consolidation. In such a case, the index could resume its prior trend and aim for 25,600 initially, followed by 26,000–26,277 in the short to medium term. A clean breakout with strong price action near the upper band would be critical for confirmation. Bearish Scenario: On the downside, failure to hold above 24,450 could lead to a breakdown from the consolidation range. A strong bearish candle closing below this level, especially with volume expansion, may drag the index toward 24,000 or even the 23,250 support base. This would weaken the current bullish bias and shift sentiment toward short-term caution.
Price Action
- ■Price action is structurally positive.
- ■Forming higher highs and higher lows.
Volume Profile
- ■Volume is supportive of the price action.
- ■Wait for volume expansion on breakout.
Key Levels
No zones specified
No zones specified
Invalidation Scenario
A weekly close below the support level invalidates this structure.
Nifty Smallcap 100 Index
charts to-watchDouble Bottom Breakout
Daily Chart
Thesis & Analysis
No detailed thesis provided for this setup.
Price Action
- ■Price action is structurally positive.
- ■Forming higher highs and higher lows.
Volume Profile
- ■Volume is supportive of the price action.
- ■Wait for volume expansion on breakout.
Key Levels
No zones specified
No zones specified
Invalidation Scenario
A weekly close below the support level invalidates this structure.
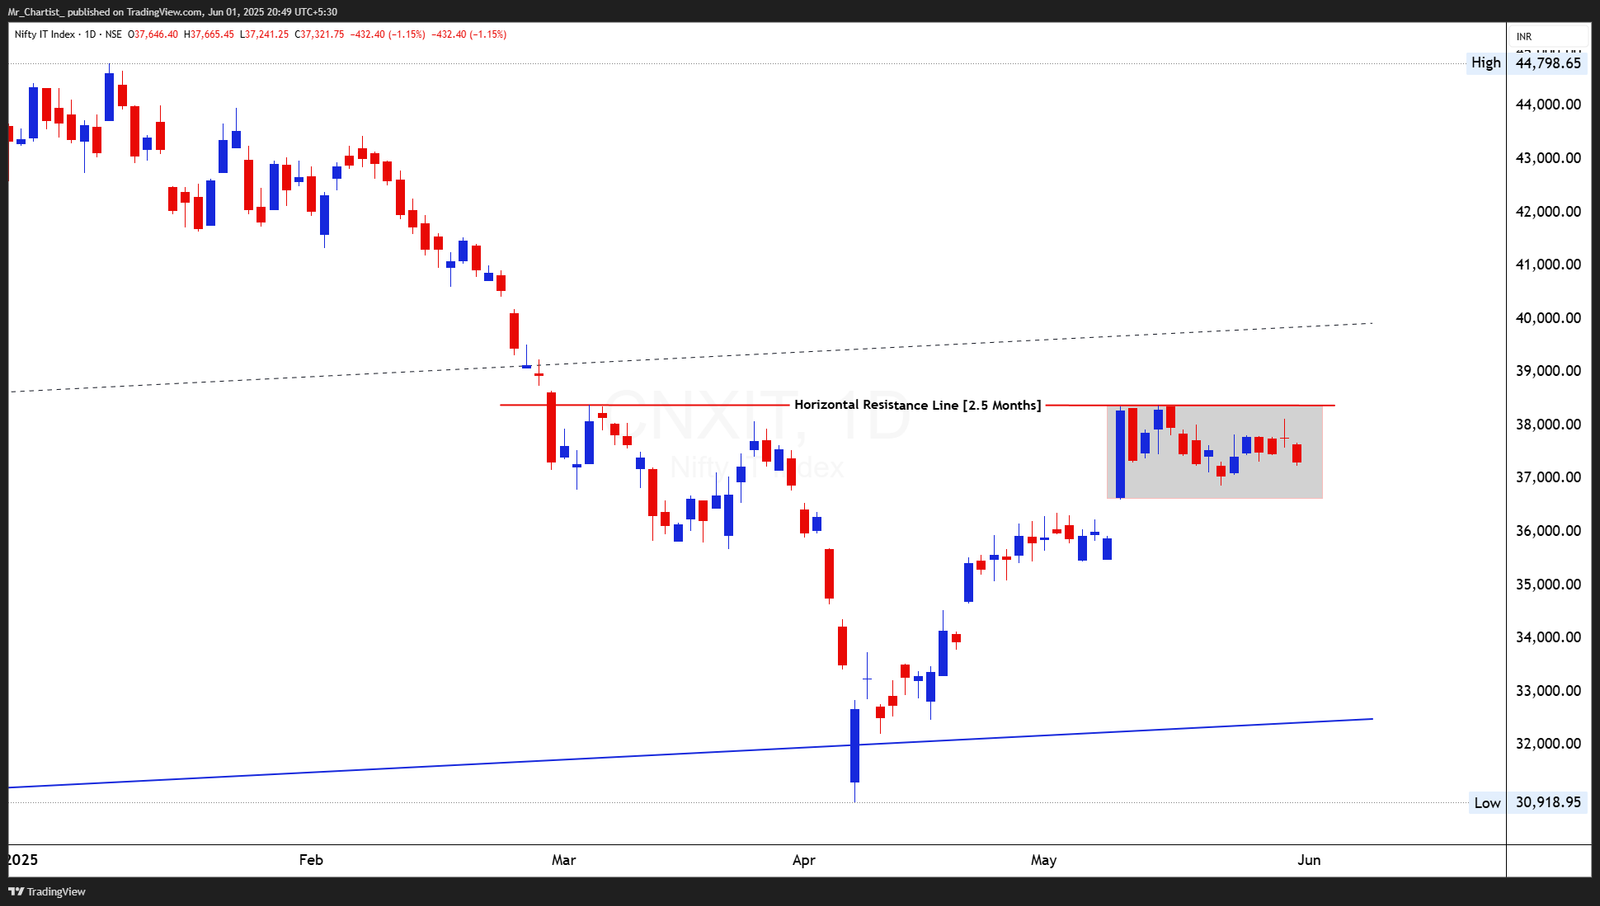
NIFTY SMALLCAP 100 INDEX
charts to-watchThe last several sessions have printed small-bodied candles with narrow ranges, signaling
Inverted Head and Shoulders [3.5 Months]
Thesis & Analysis
Price Action Overview: The Nifty Smallcap 100 has completed a classic inverted head and shoulders formation, with the neckline breakout occurring around the 17,200 level in early May. Post-breakout, the index rallied sharply, gaining over 10% in just a few weeks, showcasing strong bullish conviction. However, it is now facing resistance around the 17,900–18,000 zone, where price action has transitioned into a tight, flat consolidation marked by small-bodied candles. This minor consolidation at the top suggests a pause in momentum, often seen before either a continuation or reversal. The earlier rally was steep, and the current sideways movement reflects short-term indecision. A breakout above 18,000 could lead to fresh upside continuation, while a breakdown from the range would raise caution about overextension. Candlestick Pattern: The last several sessions have printed small-bodied candles with narrow ranges, signaling waning momentum and indecision near resistance. No bearish engulfing or reversal signals have formed yet, but the structure shows hesitation. 2. Crucial Support and Resistance Levels Support Levels: 17,600: Immediate support at the bottom of current consolidation. 17,200: Neckline of the inverted H&S, now a strong retest zone. 16,500: Previous swing high before the breakout; structural support. Resistance Levels: 18,000: Psychological and technical ceiling from where prices have stalled. 18,400–18,600: Next visible zone of supply on the chart. 19,716: Previous all-time high; major level to watch in the medium term. 3. Strategic Trade Scenarios Bullish Scenario: If the index breaks above 18,000 with expanding volume and a strong bullish candle, it would confirm a continuation from the inverted head and shoulders breakout. This would open up further upside toward 18,600 and eventually 19,700 in the medium term. The 17,600 level remains a critical short-term pivot for maintaining bullish structure. Bearish Scenario: A breakdown below 17,600, especially with increasing sell-side volume, would signal exhaustion post-breakout and could initiate a pullback toward 17,200. A deeper correction below the neckline would weaken the pattern implications and turn sentiment cautious.
Price Action
- ■Price action is structurally positive.
- ■Forming higher highs and higher lows.
Volume Profile
- ■Volume is supportive of the price action.
- ■Wait for volume expansion on breakout.
Key Levels
No zones specified
No zones specified
Invalidation Scenario
A weekly close below the support level invalidates this structure.
Nifty IT Index
charts to-watchDouble Bottom Breakout
Daily Chart
Thesis & Analysis
No detailed thesis provided for this setup.
Price Action
- ■Price action is structurally positive.
- ■Forming higher highs and higher lows.
Volume Profile
- ■Volume is supportive of the price action.
- ■Wait for volume expansion on breakout.
Key Levels
No zones specified
No zones specified
Invalidation Scenario
A weekly close below the support level invalidates this structure.
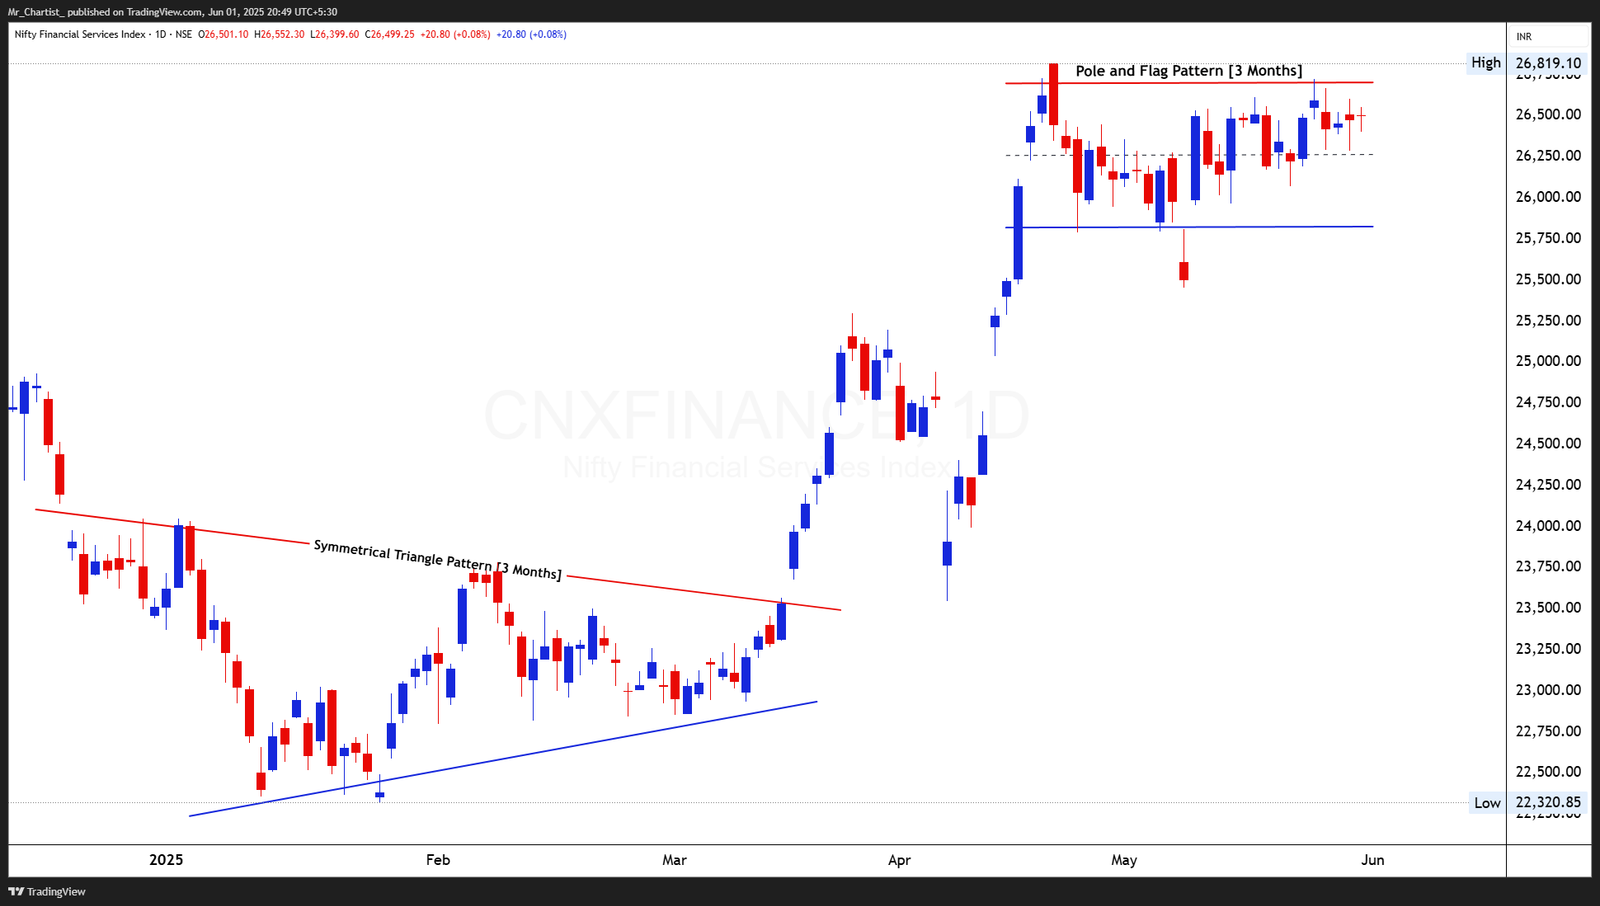
NIFTY IT INDEX
charts to-watchThe recent candles have shown mixed sentiment, but the latest bearish body breaking
Horizontal Resistance + Box Range [2.5 Months]
Thesis & Analysis
Price Action Overview: The Nifty IT Index has been range-bound below a defined horizontal resistance near the 38,500 level for the past 2.5 months. After a sharp rebound in April, the index encountered this resistance and has since moved sideways in a flat rectangular structure between ~36,900 and 38,500. This suggests an equilibrium phase where neither bulls nor bears have asserted control. The price attempted to break above this zone multiple times but failed to sustain, and the most recent candle reflects renewed selling pressure near the upper band of the range. The pattern now reflects fatigue in the upward momentum, and today’s bearish candle hints at possible weakness setting in unless the resistance is breached decisively. Candlestick Pattern: The recent candles have shown mixed sentiment, but the latest bearish body breaking below the mid-zone of the range increases the chance of further decline. Absence of strong bullish follow-through after each test of the resistance reinforces the idea of a possible distribution phase. 2. Crucial Support and Resistance Levels Support Levels: 36,900: Lower boundary of the current box range; critical short-term support. 36,000: April swing low before the breakout attempt. 34,500: Structural demand zone from March consolidation. Resistance Levels: 38,500: Strong horizontal resistance tested multiple times. 39,200–39,500: Minor overhead supply zone. 40,800: Upper trendline resistance visible from long-term structure. 3. Strategic Trade Scenarios Bearish Scenario: If the index breaks below 36,900 with volume support and a strong bearish close, it would indicate breakdown from the current consolidation range. In that case, price may slip toward 36,000 initially, followed by a deeper correction toward 34,500 if selling pressure accelerates. Bullish Scenario: For any bullish case to materialize, the index must decisively clear the 38,500 resistance with a daily close supported by high volume. Only then would the pattern convert into a continuation setup with potential targets at 39,500 and 40,800.
Price Action
- ■Price action is structurally positive.
- ■Forming higher highs and higher lows.
Volume Profile
- ■Volume is supportive of the price action.
- ■Wait for volume expansion on breakout.
Key Levels
No zones specified
No zones specified
Invalidation Scenario
A weekly close below the support level invalidates this structure.
Nifty Financial Services Index
charts to-watchDouble Bottom Breakout
Daily Chart
Thesis & Analysis
No detailed thesis provided for this setup.
Price Action
- ■Price action is structurally positive.
- ■Forming higher highs and higher lows.
Volume Profile
- ■Volume is supportive of the price action.
- ■Wait for volume expansion on breakout.
Key Levels
No zones specified
No zones specified
Invalidation Scenario
A weekly close below the support level invalidates this structure.
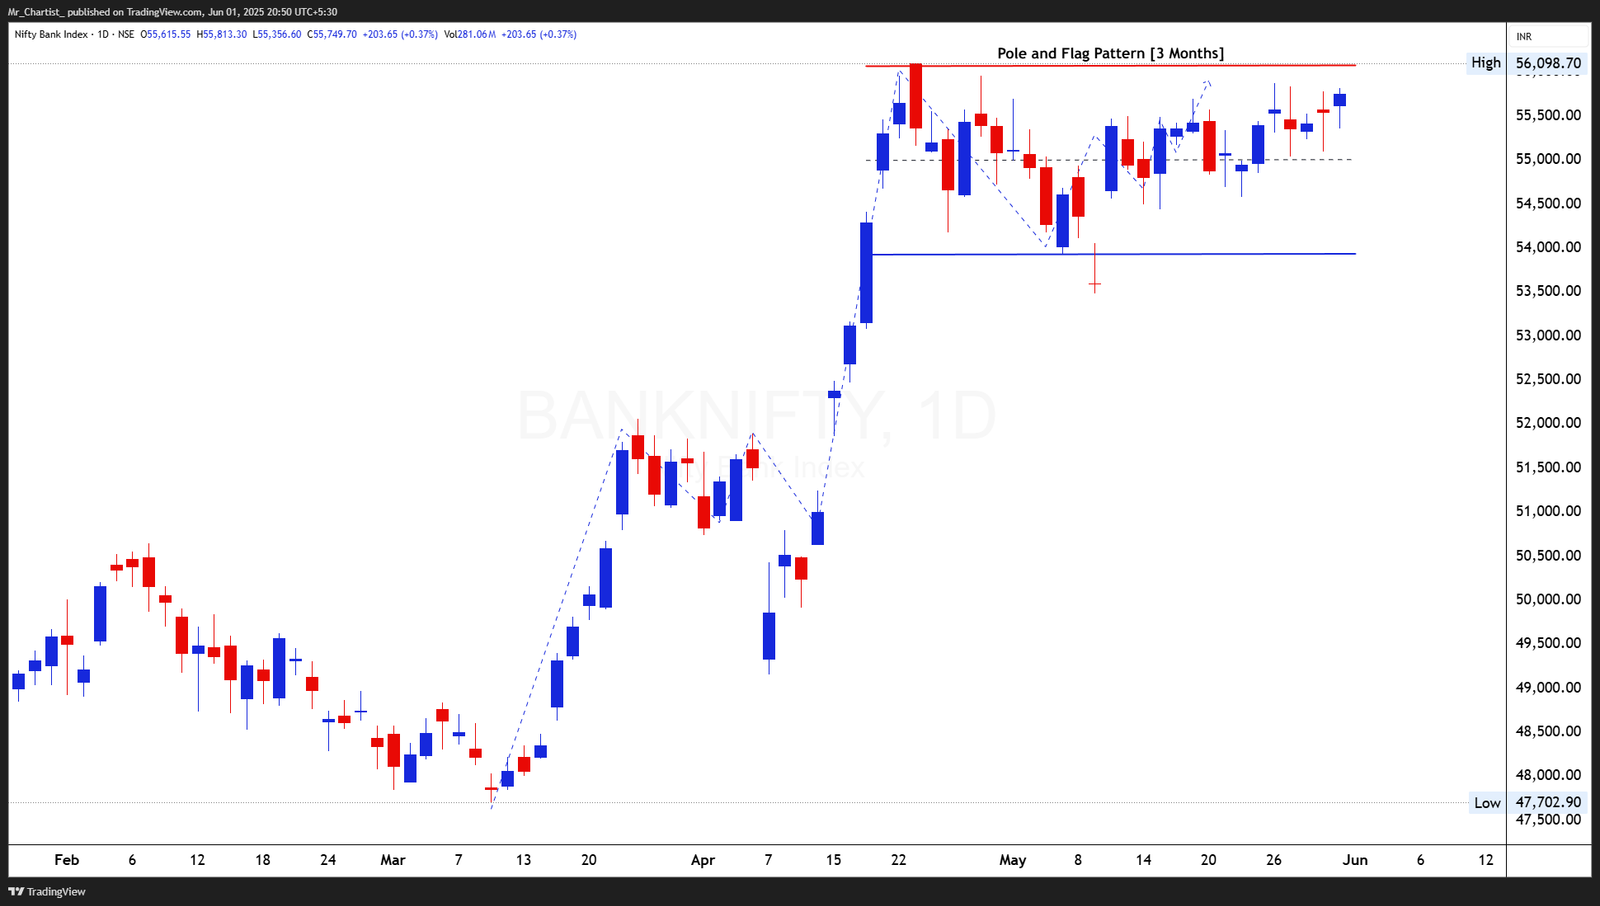
NIFTY FINANCIAL SERVICES INDEX
charts to-watchRecent candles within the flag are mixed but with a slight bullish lean. No aggressive
Symmetrical Triangle (3 Months) → Pole and Flag
Thesis & Analysis
Continuation (Current: 3 Weeks) Price Action Overview: The Financial Services index earlier broke out from a well-defined symmetrical triangle pattern that lasted from January to March 2025. This breakout triggered a strong vertical rally—forming the “pole” of the current flag structure. Since mid-May, prices have entered a consolidation phase just below the 26,700 mark, forming a horizontal flag range, indicating a typical bullish continuation setup. The index is trading in a narrow band between 25,750 and 26,700. Price action within this zone has been choppy but shows signs of higher accumulation rather than distribution, especially considering the structure formed after a vertical rally. This tight consolidation at higher levels supports a bullish bias if the upper boundary is taken out convincingly. Candlestick Pattern: Recent candles within the flag are mixed but with a slight bullish lean. No aggressive selling tails are present, and despite multiple rejections near the top of the flag, bears have not forced any breakdown. This keeps the setup intact for a breakout opportunity. 2. Crucial Support and Resistance Levels Support Levels: 25,750: Base of the current flag; essential for structure validity. 25,200: Intermediate support in case of deeper pullback. 24,000: Former breakout zone from the triangle, major swing support. Resistance Levels: 26,700: Upper limit of the flag and immediate breakout trigger. 26,819: Previous high and likely short-term hurdle post-breakout. 27,400–27,600: Potential measured move target zone based on the flagpole. 3. Strategic Trade Scenarios Bullish Scenario: A breakout above 26,700 with rising volume and a strong candle close would confirm flag continuation. The measured target of the breakout could project towards 27,400 or higher. The flag pattern remains valid as long as the index holds above 25,750. Bearish Scenario: A breakdown below 25,750 would invalidate the flag and could trigger a corrective decline toward 25,200 initially. Such a move would weaken the short-term trend but wouldn't yet negate the broader bullish structure unless the price falls below 24,000.
Price Action
- ■Price action is structurally positive.
- ■Forming higher highs and higher lows.
Volume Profile
- ■Volume is supportive of the price action.
- ■Wait for volume expansion on breakout.
Key Levels
No zones specified
No zones specified
Invalidation Scenario
A weekly close below the support level invalidates this structure.
Nifty Bank Index
charts to-watchDouble Bottom Breakout
Daily Chart
Thesis & Analysis
No detailed thesis provided for this setup.
Price Action
- ■Price action is structurally positive.
- ■Forming higher highs and higher lows.
Volume Profile
- ■Volume is supportive of the price action.
- ■Wait for volume expansion on breakout.
Key Levels
No zones specified
No zones specified
Invalidation Scenario
A weekly close below the support level invalidates this structure.
Chart Image Not Extracted
NIFTY BANK INDEX
charts to-watchRecent candles are bullish in structure, with multiple higher lows and long-bodied bullish
Pole and Flag Continuation Pattern [3 Months]
Thesis & Analysis
Price Action Overview: The Nifty Bank Index has been consolidating within a bullish flag structure for the past three months following a sharp vertical rally that originated from the 47,700 level in March. The strong impulsive move formed the “pole,” and the index has since traded sideways in a well- defined horizontal range between 54,000 and 56,100, forming the “flag.” This consolidation is healthy and comes after a strong trend, indicating a likely continuation. The price is currently near the upper band of the flag and showing renewed strength with a series of higher closes, suggesting buying pressure is resurfacing. A breakout appears imminent if the upper boundary is crossed with conviction. Candlestick Pattern: Recent candles are bullish in structure, with multiple higher lows and long-bodied bullish closes. While some minor upper wicks exist, they do not signal rejection—rather, they reflect periodic profit-taking. The structure remains constructive. Volume Analysis: Volume has reduced during the flag’s formation, consistent with classical continuation setups. The prior surge in volume during the pole confirms institutional interest during the earlier move. A breakout above 56,100 with increased volume would strongly validate the pattern. 2. Crucial Support and Resistance Levels Support Levels: 54,000: Lower bound of the flag and immediate trend support. 52,800: Previous swing low within the pattern. 50,500: Breakout base from early April, important for broader trend structure. Resistance Levels: 56,100: Flag resistance and breakout trigger zone. 56,500–56,800: Short-term resistance extension above the breakout. 58,200: Projected flag target based on measured move. 3. Strategic Trade Scenarios Bullish Scenario: A daily close above 56,100 with above-average volume would signal breakout confirmation from the flag. In that event, the index could extend higher toward 56,800 initially and potentially reach the measured target of 58,200 in the short term. Momentum continuation will depend on follow-through price action. Bearish Scenario: If the index fails to hold above 54,000, it would invalidate the flag structure and could lead to a pullback toward 52,800 or even 50,500. A breakdown with increased volume would be a sign of distribution emerging at the top.
Price Action
- ■Price action is structurally positive.
- ■Forming higher highs and higher lows.
Volume Profile
- ■Volume is supportive of the price action.
- ■Wait for volume expansion on breakout.
Key Levels
No zones specified
No zones specified
Invalidation Scenario
A weekly close below the support level invalidates this structure.
SEBI Registered Research Analyst — INH000015297 (INVESTOLOGY). Investment in securities market are subject to market risks. Read all related documents carefully before investing. The content provided is for educational purposes only and should not be considered as financial advice. Past performance is not indicative of future results.