Coming Soon
The Weekend Visual ChartBook is currently undergoing a massive upgrade. Stay tuned for a world-class reading experience.
Return HomeWeekend Visual ChartBook
Edition #270
Extracted Edition
Market Pulse
LiveReal-time index prices above. Detailed index chart analysis below in the Indices section.
Bullish Charts [F&O]
Breakout and momentum setups from the F&O universe
Max Healthcare Institute Ltd
bullish fnoDouble Bottom Breakout
Daily Chart
Thesis & Analysis
No detailed thesis provided for this setup.
Price Action
- ■Price action is structurally positive.
- ■Forming higher highs and higher lows.
Volume Profile
- ■Volume is supportive of the price action.
- ■Wait for volume expansion on breakout.
Key Levels
No zones specified
No zones specified
Invalidation Scenario
A weekly close below the support level invalidates this structure.
MAX HEALTHCARE INSTITUTE LTD
bullish fnoDouble Bottom Breakout
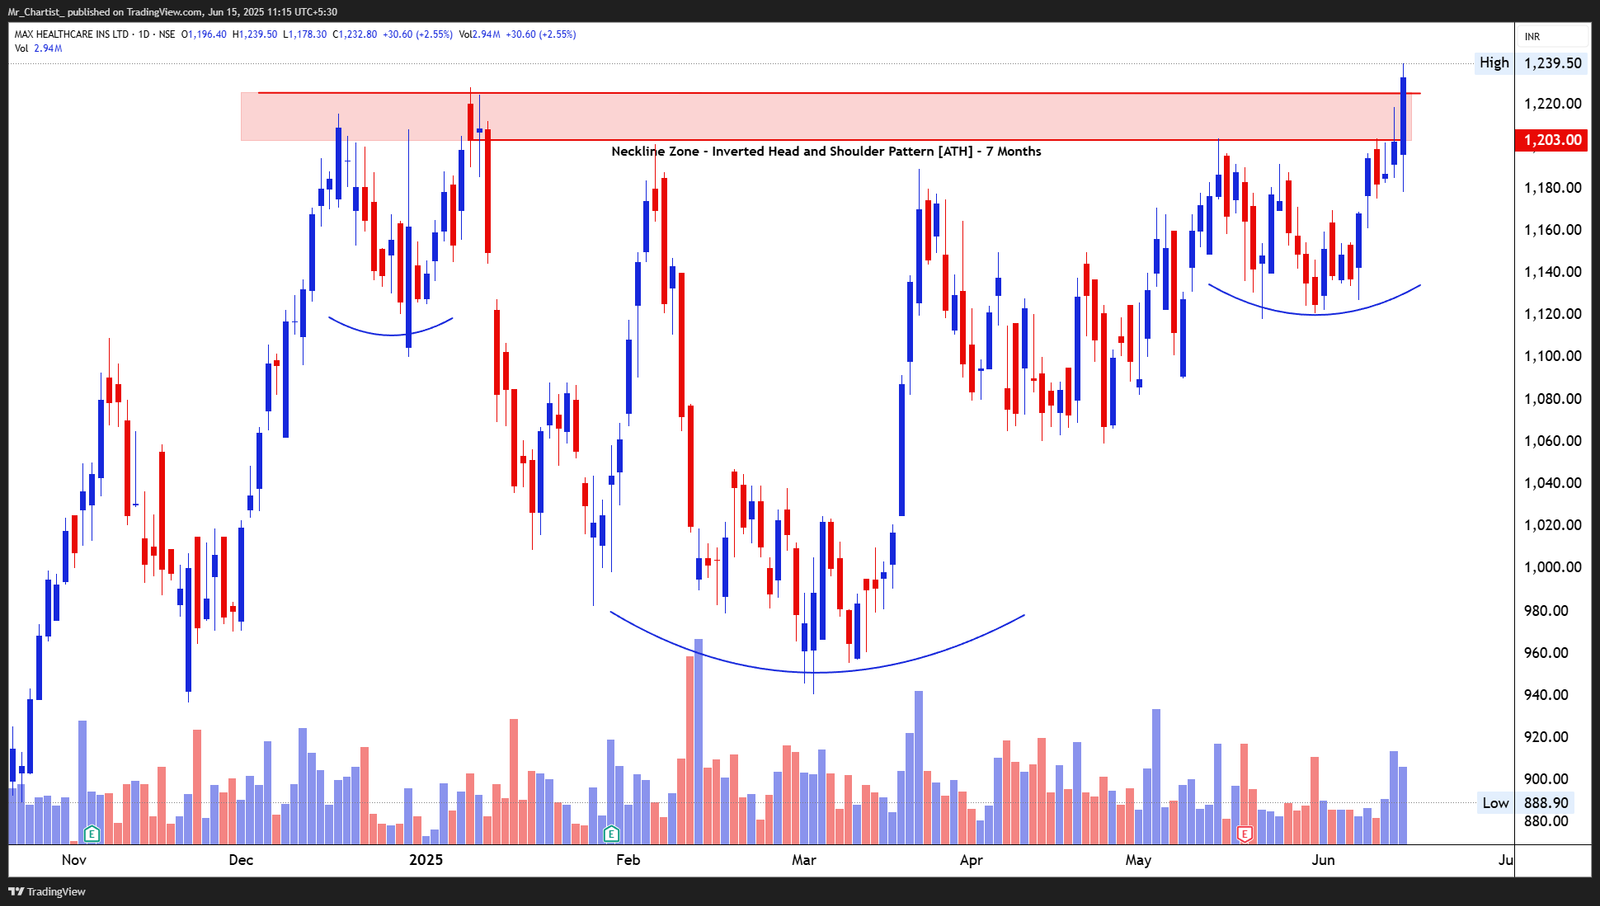
Inverted Head and Shoulders [7 Months, All-Time
Thesis & Analysis
High Zone] Price Action Overview: Max Healthcare has broken above a well-defined neckline zone of a 7-month-long Inverted Head and Shoulders formation. The neckline around ₹1,203–₹1,210 had been a crucial congestion zone with repeated rejection attempts over the past several weeks. Today’s price action produced a decisive breakout above this neckline zone, pushing into uncharted territory and registering a fresh all-time high at ₹1,239.50. This move confirms the bullish reversal setup that had been developing for months. Candlestick Behavior: The breakout candle is a strong bullish bar with a solid body and minimal wick, signaling strong momentum. It followed a series of higher lows that converged just below the neckline, a textbook pre-breakout setup. Volume Insight: Volume surged notably on the breakout session, exceeding the short-term average. This signals genuine accumulation interest, validating the pattern breakout. 2. Crucial Support and Resistance Levels Support Zones: ₹1,203–₹1,210: Neckline zone turned breakout support; must hold for trend continuation. ₹1,160: Minor swing support from pre-breakout structure. ₹1,120: Right shoulder base and structural pivot. Resistance Zones: ₹1,250–₹1,275: Short-term extension based on measured move projections. ₹1,320+: Pattern-based extension from neckline-to-head range. 3. Strategic Trade Scenarios 🔹 Bullish Continuation Scenario: A close above ₹1,210 with strength and volume follow-through supports a bullish bias. Sustaining above this level opens the path to ₹1,250 and potentially ₹1,275 in the near term, aligning with the height of the inverted H&S pattern. 🔸 Failed Breakout Scenario: If the price closes back below ₹1,200 on increasing volume, the move could be a false breakout. In that case, a retest of ₹1,160–₹1,120 may follow before any recovery attempt.
Price Action
- ■Price action is structurally positive.
- ■Forming higher highs and higher lows.
Volume Profile
- ■Volume is supportive of the price action.
- ■Wait for volume expansion on breakout.
Key Levels
No zones specified
No zones specified
Invalidation Scenario
A weekly close below the support level invalidates this structure.
Tech Mahindra Ltd
bullish fnoDouble Bottom Breakout
Daily Chart
Thesis & Analysis
No detailed thesis provided for this setup.
Price Action
- ■Price action is structurally positive.
- ■Forming higher highs and higher lows.
Volume Profile
- ■Volume is supportive of the price action.
- ■Wait for volume expansion on breakout.
Key Levels
No zones specified
No zones specified
Invalidation Scenario
A weekly close below the support level invalidates this structure.
TECH MAHINDRA LTD
bullish fnoDouble Bottom Breakout
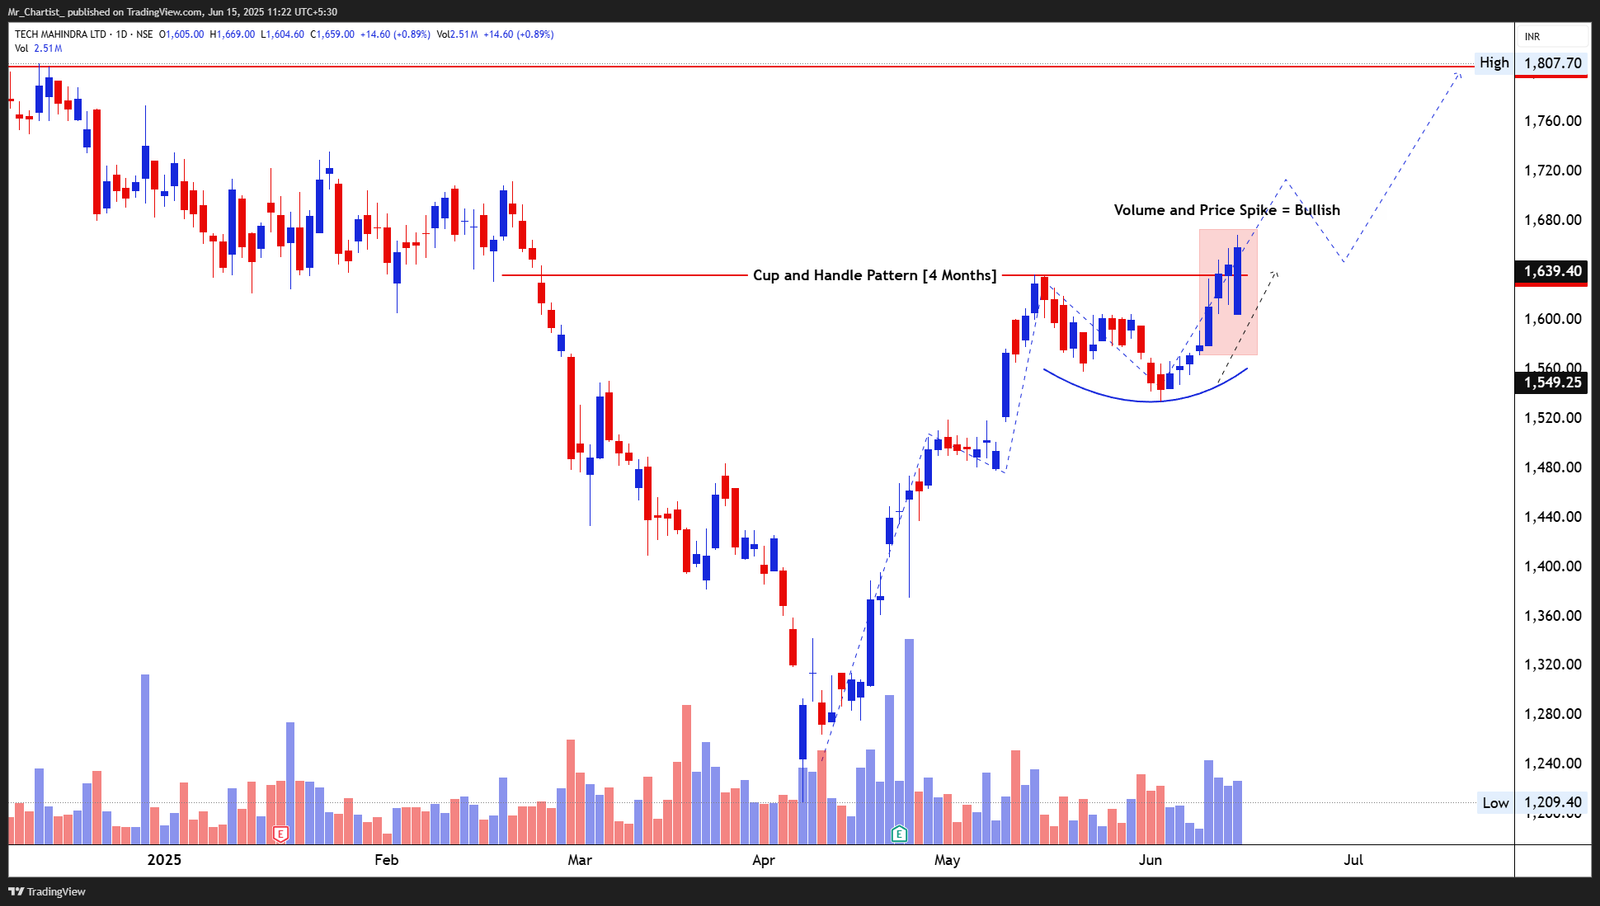
Cup and Handle Pattern [4 Months]
Thesis & Analysis
Price Action Overview: Tech Mahindra has confirmed a breakout from a 4-month Cup and Handle formation, overcoming the neckline resistance near ₹1,639. The base of the cup was formed between March and April 2025, followed by a well-shaped handle with declining volatility and a bullish breakout on increased volume. Today’s breakout is characterized by a strong momentum candle, breaking above the handle zone and reinforcing bullish conviction. Candlestick Behavior: The breakout occurred through a wide-range bullish candle, part of a series of higher lows in the handle structure. The candle emerged after a bullish consolidation band, showing trend continuation strength. Volume Analysis: Volume spiked significantly during the breakout phase, reinforcing the bullish narrative. This follows a steady accumulation pattern where up days showed relatively higher volume—a positive demand signal. 2. Crucial Support and Resistance Levels Support Zones: ₹1,639: Breakout level from the cup & handle neckline; now key support. ₹1,585: Handle base and prior resistance flip zone. ₹1,549: Lower boundary of handle formation. Resistance Zones: ₹1,720–₹1,740: First measured target from pattern height. ₹1,805–₹1,820: Extended target based on vertical rally projection. 3. Strategic Trade Scenarios 🔹 Bullish Continuation Setup: A sustained close above ₹1,639 with follow-through action and consistent volume could trigger a move toward ₹1,720–₹1,740. Pattern structure favors strength continuation as long as price holds above breakout levels. 🔸 Reversal or Pullback Risk: Failure to hold ₹1,639 may lead to a retest of the ₹1,585–₹1,549 zone. Breakdown below the handle low would invalidate the breakout and shift focus to deeper retracement or pattern failure.
Price Action
- ■Price action is structurally positive.
- ■Forming higher highs and higher lows.
Volume Profile
- ■Volume is supportive of the price action.
- ■Wait for volume expansion on breakout.
Key Levels
No zones specified
No zones specified
Invalidation Scenario
A weekly close below the support level invalidates this structure.
Chambal Fertilizers Ltd
bullish fnoDouble Bottom Breakout
Daily Chart
Thesis & Analysis
No detailed thesis provided for this setup.
Price Action
- ■Price action is structurally positive.
- ■Forming higher highs and higher lows.
Volume Profile
- ■Volume is supportive of the price action.
- ■Wait for volume expansion on breakout.
Key Levels
No zones specified
No zones specified
Invalidation Scenario
A weekly close below the support level invalidates this structure.
CHAMBAL FERTILIZERS LTD
bullish fnoDouble Bottom Breakout
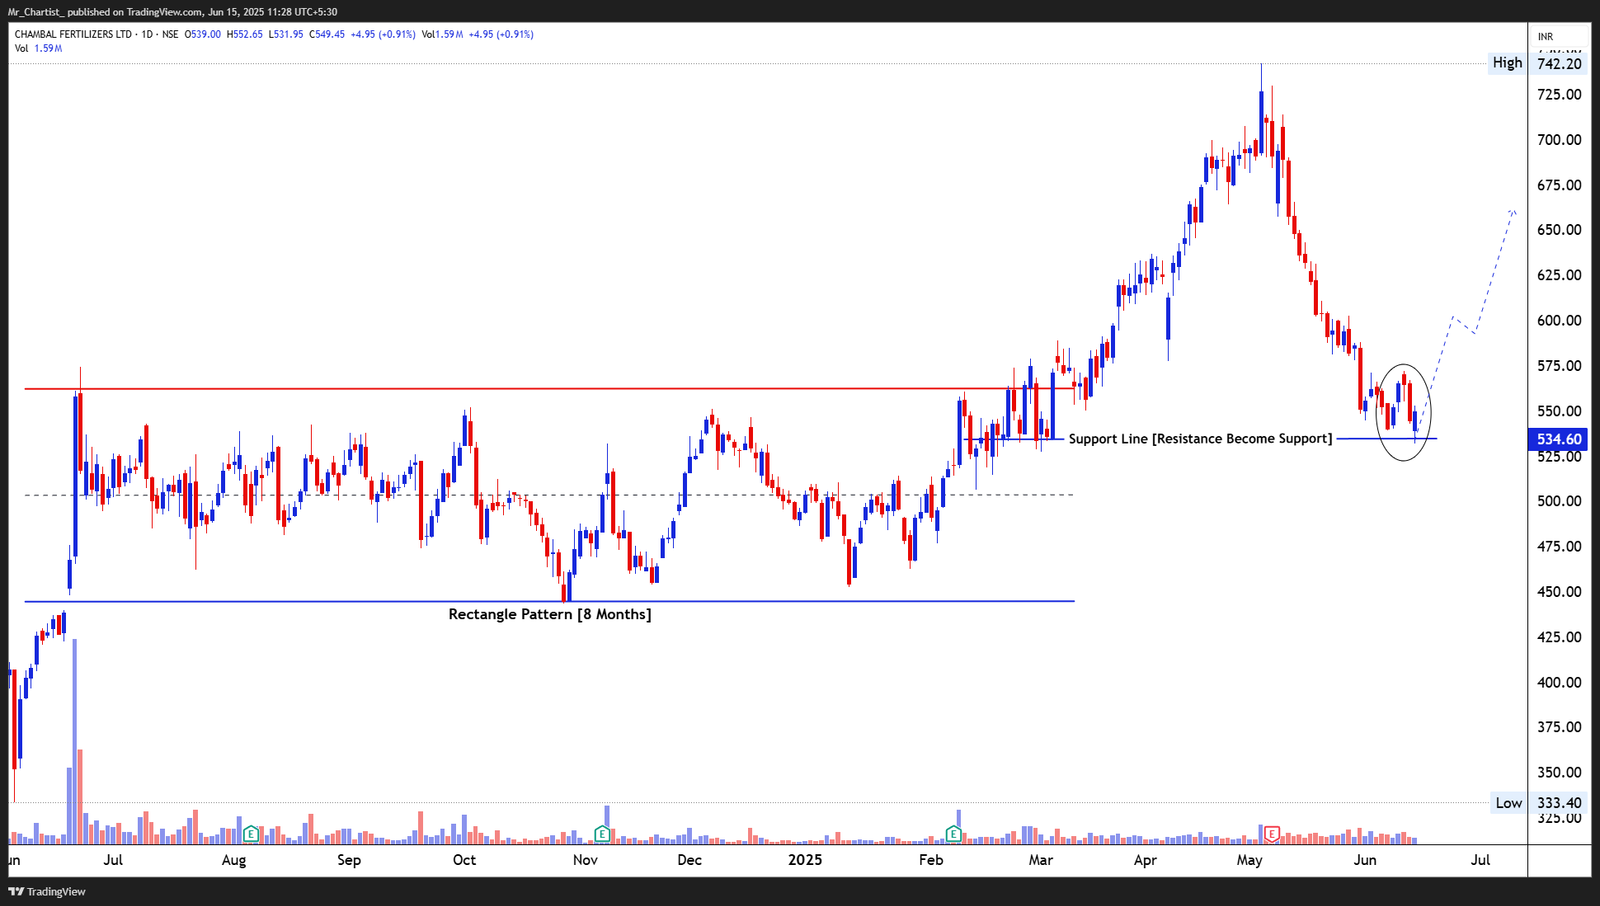
Rectangle Pattern [8 Months]
Thesis & Analysis
Price Action Overview: Chambal Fertilizers broke out of an 8-month rectangle pattern in March 2025, rallying sharply toward ₹740 before entering a corrective phase. The stock has now retraced to the breakout zone near ₹530–₹540, which previously acted as stiff resistance and has now flipped into a critical support zone. The recent price action suggests a potential bullish reversal as the stock printed a lower shadow candle (long wick), suggesting demand absorption at support. Candlestick Behavior: A hammer-like reversal candle has formed near the breakout support, hinting at renewed buying interest after a steady decline from recent highs. This behavior at a technically significant level often indicates a potential inflection. Volume Analysis: Volume has started to pick up around the support, reflecting potential accumulation. While not a strong spike, the stability in volume during the pullback phase supports the idea of a controlled correction. 2. Crucial Support and Resistance Levels Support Zones: ₹530–₹540: Prior rectangle resistance turned support; key demand zone. ₹500: Minor historical pivot and potential psychological round number. ₹470: Bottom of prior rectangle consolidation zone. Resistance Zones: ₹585: Minor resistance from May swing high. ₹625–₹650: Midway retracement zone of the prior fall. ₹700+: Psychological resistance near peak post breakout. 3. Strategic Trade Scenarios 🔹 Bullish Scenario (Support Reversal Setup): A sustained move above ₹550, especially on increasing volume, would confirm the support reversal. If price holds above the ₹530–₹540 band, it opens up the potential for a gradual climb back toward ₹600 and ₹650. 🔸 Failure Breakdown Setup: If the stock fails to defend the ₹530 mark and closes below ₹520 with rising volume, it would invalidate the support flip. In that case, price may slide toward ₹470–₹500, re-entering the old rectangle range.
Price Action
- ■Price action is structurally positive.
- ■Forming higher highs and higher lows.
Volume Profile
- ■Volume is supportive of the price action.
- ■Wait for volume expansion on breakout.
Key Levels
No zones specified
No zones specified
Invalidation Scenario
A weekly close below the support level invalidates this structure.
Astral Ltd
bullish fnoDouble Bottom Breakout
Daily Chart
Thesis & Analysis
No detailed thesis provided for this setup.
Price Action
- ■Price action is structurally positive.
- ■Forming higher highs and higher lows.
Volume Profile
- ■Volume is supportive of the price action.
- ■Wait for volume expansion on breakout.
Key Levels
No zones specified
No zones specified
Invalidation Scenario
A weekly close below the support level invalidates this structure.
ASTRAL LTD
bullish fnoDouble Bottom Breakout
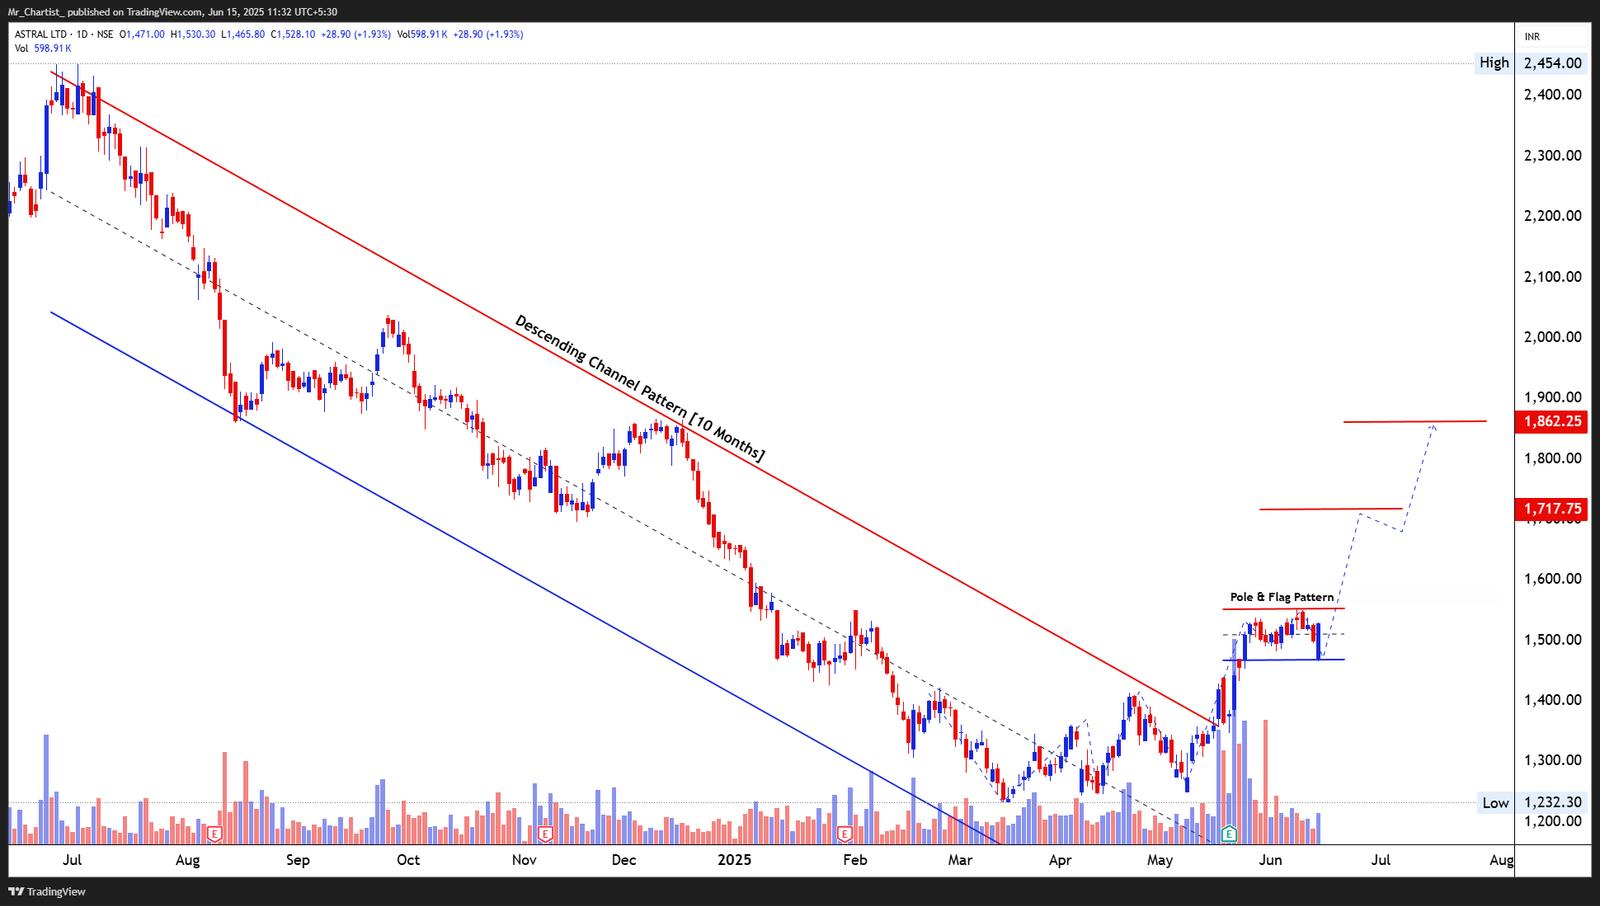
Descending Channel [10 Months] – Broken
Thesis & Analysis
Pole & Flag Continuation Pattern – Recent short-term consolidation Price Action Overview: Astral completed a 10-month downtrend within a descending channel, which it decisively broke out from in early May. Post breakout, price formed a flag-shaped consolidation, resting above ₹1,470–₹1,480, which aligns with typical post-breakout behavior in a bullish continuation setup. The price has shown resilience near the lower end of the flag (₹1,470) and is now attempting to resume upward trajectory from this structure. Candlestick Behavior: Price action over the last two sessions shows a rebound with a strong-bodied candle following a bullish wick near support. This supports the possibility of a flag breakout continuation in the sessions ahead. Volume Analysis: Volume surged on the initial breakout from the descending channel and eased during the flag formation—textbook behavior for this pattern. The most recent up-move was accompanied by rising volume again, suggesting buying interest is reigniting. 2. Crucial Support and Resistance Levels Support Zones: ₹1,470–₹1,480: Flag base support and key retest zone. ₹1,400: Swing low prior to flag formation. ₹1,300: Former resistance zone at channel breakout. Resistance Zones: ₹1,600: Immediate barrier for flag breakout confirmation. ₹1,717: Measured flag target. ₹1,860–₹1,880: Broader target based on pole height projection. 3. Strategic Trade Scenarios 🔹 Bullish Continuation Setup (Primary View): If price sustains above ₹1,470 and breaks above ₹1,600 with strong volume, the pole & flag breakout gets confirmed. This would set up potential price targets around ₹1,717 initially and ₹1,860 subsequently, aligned with classical pattern projection. 🔸 Alternate Pullback Scenario: Failure to hold ₹1,470 would mean a breakdown from the flag support, opening a retest of the ₹1,400–₹1,420 zone. A close below this level would weaken the bullish bias and invalidate the short-term flag structure.
Price Action
- ■Price action is structurally positive.
- ■Forming higher highs and higher lows.
Volume Profile
- ■Volume is supportive of the price action.
- ■Wait for volume expansion on breakout.
Key Levels
No zones specified
No zones specified
Invalidation Scenario
A weekly close below the support level invalidates this structure.
PI Industries Ltd
bullish fnoDouble Bottom Breakout
Daily Chart
Thesis & Analysis
No detailed thesis provided for this setup.
Price Action
- ■Price action is structurally positive.
- ■Forming higher highs and higher lows.
Volume Profile
- ■Volume is supportive of the price action.
- ■Wait for volume expansion on breakout.
Key Levels
No zones specified
No zones specified
Invalidation Scenario
A weekly close below the support level invalidates this structure.
PI INDUSTRIES LTD
bullish fnoDouble Bottom Breakout
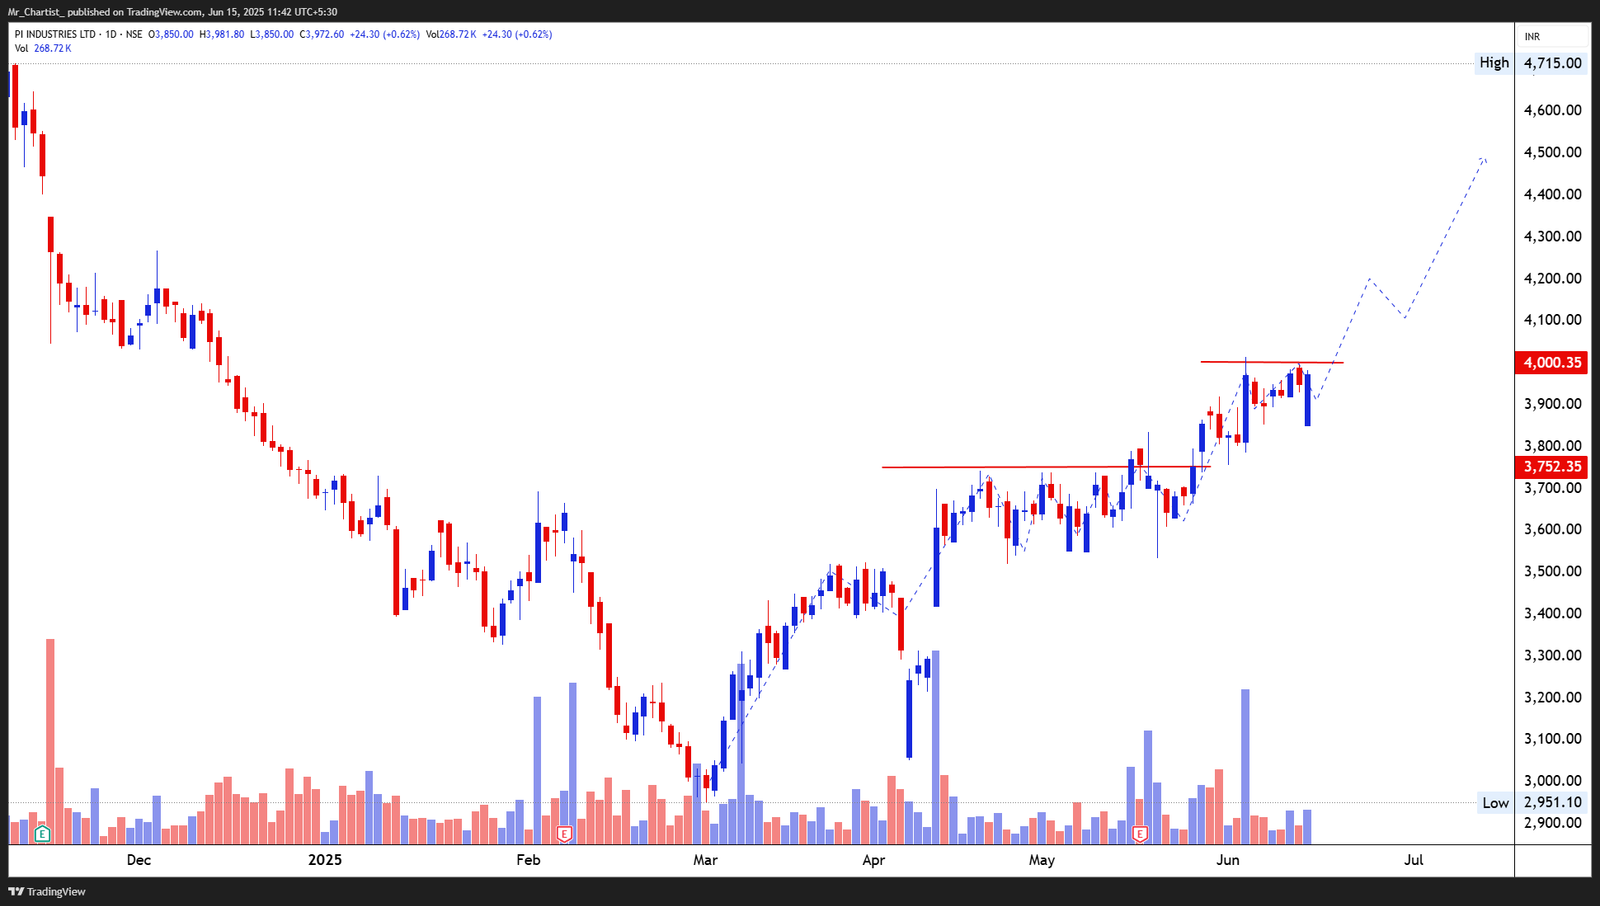
Ascending Consolidation with Breakout Zones – Evolving from late March 2025
Thesis & Analysis
Breakouts staged near ₹3,752 and now building pressure just under ₹4,000. Price Action Overview: After a protracted downtrend into early 2025, PI Industries staged a strong recovery from March onward. The stock has since formed two key horizontal breakout levels—first around ₹3,752 and the second now at ₹4,000. Price is currently consolidating in a tight band below ₹4,000, showing signs of bullish buildup. A short-term flag structure is visible, with higher lows consistently pushing into resistance. Candlestick Behavior: Recent price candles show buying absorption near support and upper wicks reducing, indicating a potential pressure build-up. While today's close is slightly negative, the structural bias remains constructive unless breakdown support is violated. Volume Analysis: Volume surged on the breakout from ₹3,752, confirming institutional participation. Current consolidation is occurring on relatively lower volume, typical of healthy pause zones before expansion. Watch for renewed volume above ₹4,000 for breakout confirmation. 2. Crucial Support and Resistance Levels Support Zones: ₹3,900: Intraday pivot low and minor reaction zone. ₹3,752: Confirmed breakout retest level. ₹3,600: Higher base formed in April; strong demand support. Resistance Zones: ₹4,000: Horizontal resistance and psychological round number; breakout trigger. ₹4,250–₹4,300: Price projection zone based on earlier rally leg extension. ₹4,450–₹4,600: Historical supply zone if bullish momentum sustains. 3. Strategic Trade Scenarios 🔹 Bullish Continuation Setup (Primary Bias): A strong daily close above ₹4,000 with volume expansion would mark a fresh breakout. Projection targets lie near ₹4,250 and potentially ₹4,450 if follow-through buying emerges. Sustained trade above ₹3,900 will support the bullish structure. 🔸 Pullback Scenario: Failure to sustain above ₹3,900 may drag price back toward ₹3,752 for a retest. A breakdown below ₹3,750 could delay upside resolution and prompt broader consolidation toward ₹3,600.
Price Action
- ■Price action is structurally positive.
- ■Forming higher highs and higher lows.
Volume Profile
- ■Volume is supportive of the price action.
- ■Wait for volume expansion on breakout.
Key Levels
No zones specified
No zones specified
Invalidation Scenario
A weekly close below the support level invalidates this structure.
Supreme Industries Ltd
bullish fnoDouble Bottom Breakout
Daily Chart
Thesis & Analysis
No detailed thesis provided for this setup.
Price Action
- ■Price action is structurally positive.
- ■Forming higher highs and higher lows.
Volume Profile
- ■Volume is supportive of the price action.
- ■Wait for volume expansion on breakout.
Key Levels
No zones specified
No zones specified
Invalidation Scenario
A weekly close below the support level invalidates this structure.
Chart Image Not Extracted
SUPREME INDUSTRIES LTD
bullish fnoDouble Bottom Breakout
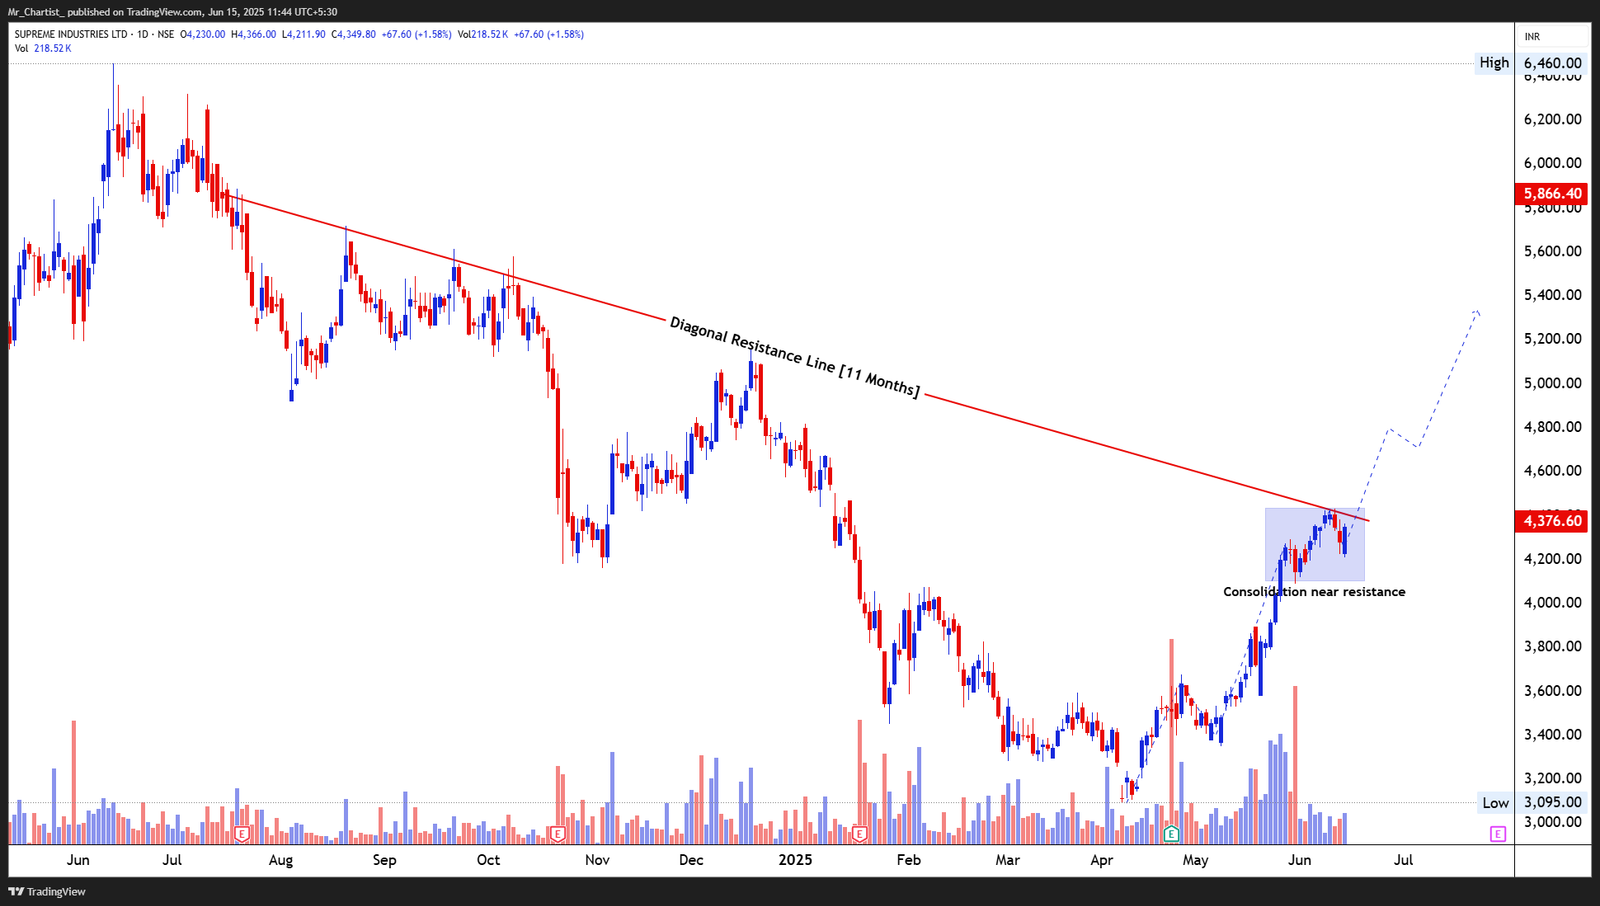
Diagonal Resistance Line (11 Months)
Thesis & Analysis
Price currently consolidating just below this long-standing trendline resistance. Price Action Overview: Supreme Industries has rebounded strongly from its March lows and is now testing a critical diagonal resistance descending from mid-2024. The current price action has formed a tight consolidation band near ₹4,350–₹4,375, suggesting controlled accumulation just under resistance. The stock remains in a constructive setup, especially after a high-momentum uptrend over the past two months. A breakout above the sloping trendline could trigger a trend reversal on the larger timeframe. Candlestick Behavior: Price has formed several narrow-bodied candles and inside bars near resistance, suggesting reduced volatility and decision-making underway. Today’s gain, while moderate, indicates strength returning near the upper edge of the consolidation. Volume Analysis: Volume remained supportive throughout the recent uptrend and has not declined sharply during the current consolidation—hinting at healthy digestion of gains. Watch for volume expansion on breakout, which would validate institutional interest. 2. Crucial Support and Resistance Levels Support Zones: ₹4,200: Lower bound of current consolidation. ₹4,000: Round number and psychological reference. ₹3,750: Prior breakout zone from late May; structural level. Resistance Zones: ₹4,375–₹4,400: Diagonal trendline resistance; key breakout trigger. ₹4,800: Measured target on breakout confirmation. ₹5,200: Fibonacci extension and historical congestion zone. 3. Strategic Trade Scenarios 🔹 Bullish Breakout Scenario (Primary Bias): If the stock posts a daily close above ₹4,400 on above-average volume, it will mark a breakout from the 11-month diagonal downtrend. Immediate targets open toward ₹4,800 and then ₹5,200, especially if price consolidates above the trendline post- breakout. 🔸 Pullback/Failure Scenario: Failure to breach ₹4,375 may result in another retest of ₹4,200. A close below ₹4,000 would weaken near-term structure and delay the breakout setup, potentially dragging price toward ₹3,750 for a deeper base.
Price Action
- ■Price action is structurally positive.
- ■Forming higher highs and higher lows.
Volume Profile
- ■Volume is supportive of the price action.
- ■Wait for volume expansion on breakout.
Key Levels
No zones specified
No zones specified
Invalidation Scenario
A weekly close below the support level invalidates this structure.
Bearish Charts [F&O]
Short setups indicating weakness
GRANULES INDIA LTD
bearish fnoDouble Bottom Breakout
Daily Chart
Thesis & Analysis
No detailed thesis provided for this setup.
Price Action
- ■Price action is structurally positive.
- ■Forming higher highs and higher lows.
Volume Profile
- ■Volume is supportive of the price action.
- ■Wait for volume expansion on breakout.
Key Levels
No zones specified
No zones specified
Invalidation Scenario
A weekly close below the support level invalidates this structure.
ANGEL ONE LTD
bearish fnoDouble Bottom Breakout
Daily Chart
Thesis & Analysis
No detailed thesis provided for this setup.
Price Action
- ■Price action is structurally positive.
- ■Forming higher highs and higher lows.
Volume Profile
- ■Volume is supportive of the price action.
- ■Wait for volume expansion on breakout.
Key Levels
No zones specified
No zones specified
Invalidation Scenario
A weekly close below the support level invalidates this structure.
Chart Image Not Extracted
ANGEL ONE LTD
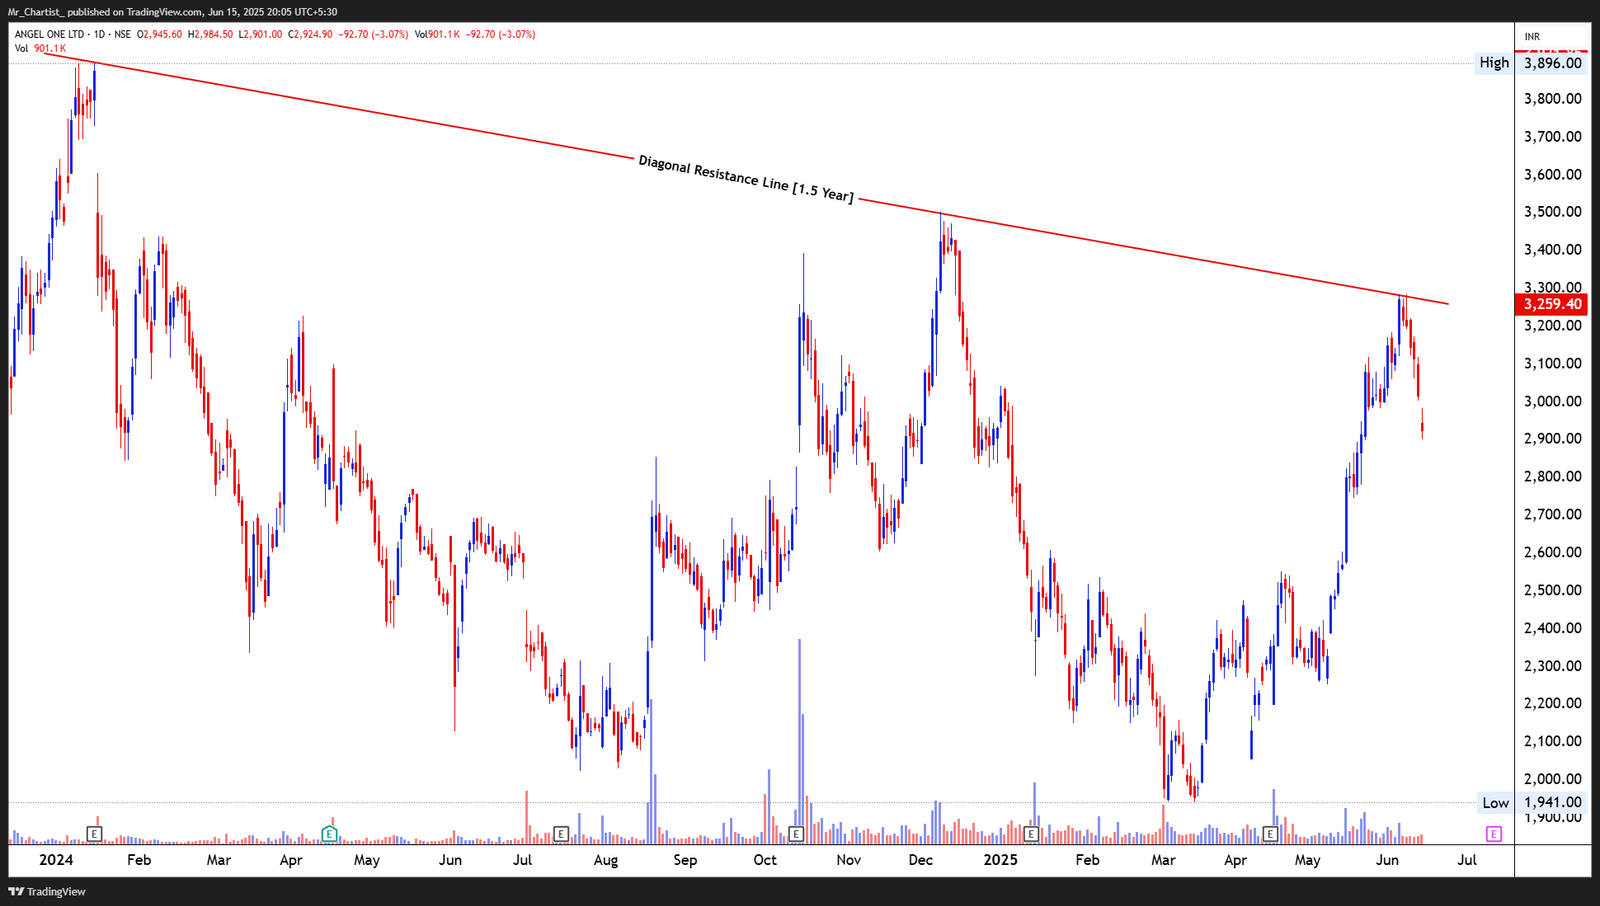
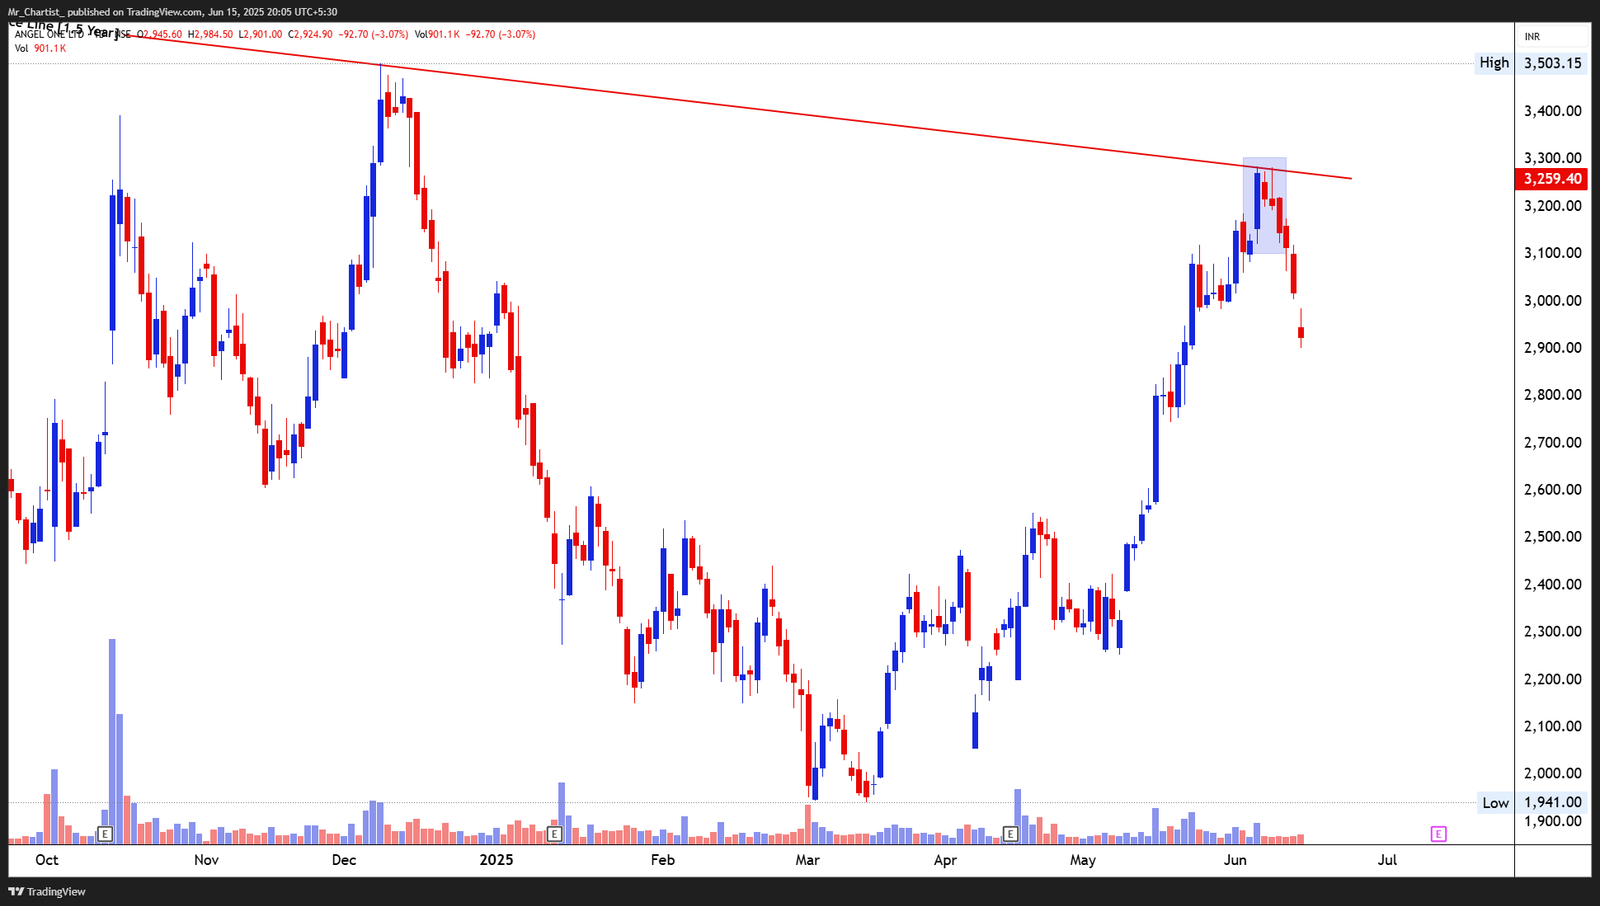
bearish fnoA strong bearish candle with upper wick rejection formed just after a brief breakout
Diagonal Resistance Line [1.5 Years]
Thesis & Analysis
Price Action Overview: Angel One has once again reacted sharply to its long-standing descending trendline resistance, rejecting a breakout attempt after approaching the ₹3,300–₹3,350 zone. This line has consistently capped rallies since early 2023, marking it as a dominant structural barrier. The most recent attempt saw a short-term breakout with a sharp rally, but a bearish reversal emerged almost immediately, trapping late buyers. Candlestick Pattern: A strong bearish candle with upper wick rejection formed just after a brief breakout attempt, indicating supply pressure and possible bull trap behavior. The reversal follows an extended uptrend from ₹2,200 levels, increasing the risk of a correction. Volume Analysis: Volume spiked during the false breakout phase, followed by a decline during the pullback—suggesting fading momentum. High-volume distribution in the reversal zone reflects institutional selling near resistance. 2. Crucial Support and Resistance Levels Resistance Levels: ₹3,300–₹3,350: Long-term diagonal resistance; rejection evident. ₹3,500: Psychological level and previous swing high (failed breakout). Support Levels: ₹3,100: Minor swing support; failure here could trigger deeper retracement. ₹2,950: Previous pivot area; confluence with recent accumulation zone. ₹2,700: Key trend support from the base of the recent rally. 3. Strategic Trade Scenarios Bearish Scenario (Bias View): The rejection from the diagonal resistance along with a sharp bearish engulfing structure signals a likely pullback. Sustained trading below ₹3,100 may trigger a slide towards ₹2,950–₹2,900. Failure to reclaim ₹3,300 quickly would validate the false breakout. Bullish Reversal Scenario: If price consolidates around ₹3,100 and absorbs supply, a renewed breakout above ₹3,350 on volume could open upside potential back toward ₹3,500–₹3,650. Any reclaim of the breakout level with bullish conviction would invalidate the near-term bearish view.
Price Action
- ■Price action is structurally positive.
- ■Forming higher highs and higher lows.
Volume Profile
- ■Volume is supportive of the price action.
- ■Wait for volume expansion on breakout.
Key Levels
No zones specified
No zones specified
Invalidation Scenario
A weekly close below the support level invalidates this structure.
PRAMARA PROMOTIONS LTD
bearish fnoDouble Bottom Breakout
Daily Chart
Thesis & Analysis
No detailed thesis provided for this setup.
Price Action
- ■Price action is structurally positive.
- ■Forming higher highs and higher lows.
Volume Profile
- ■Volume is supportive of the price action.
- ■Wait for volume expansion on breakout.
Key Levels
No zones specified
No zones specified
Invalidation Scenario
A weekly close below the support level invalidates this structure.
PRAMARA PROMOTIONS LTD
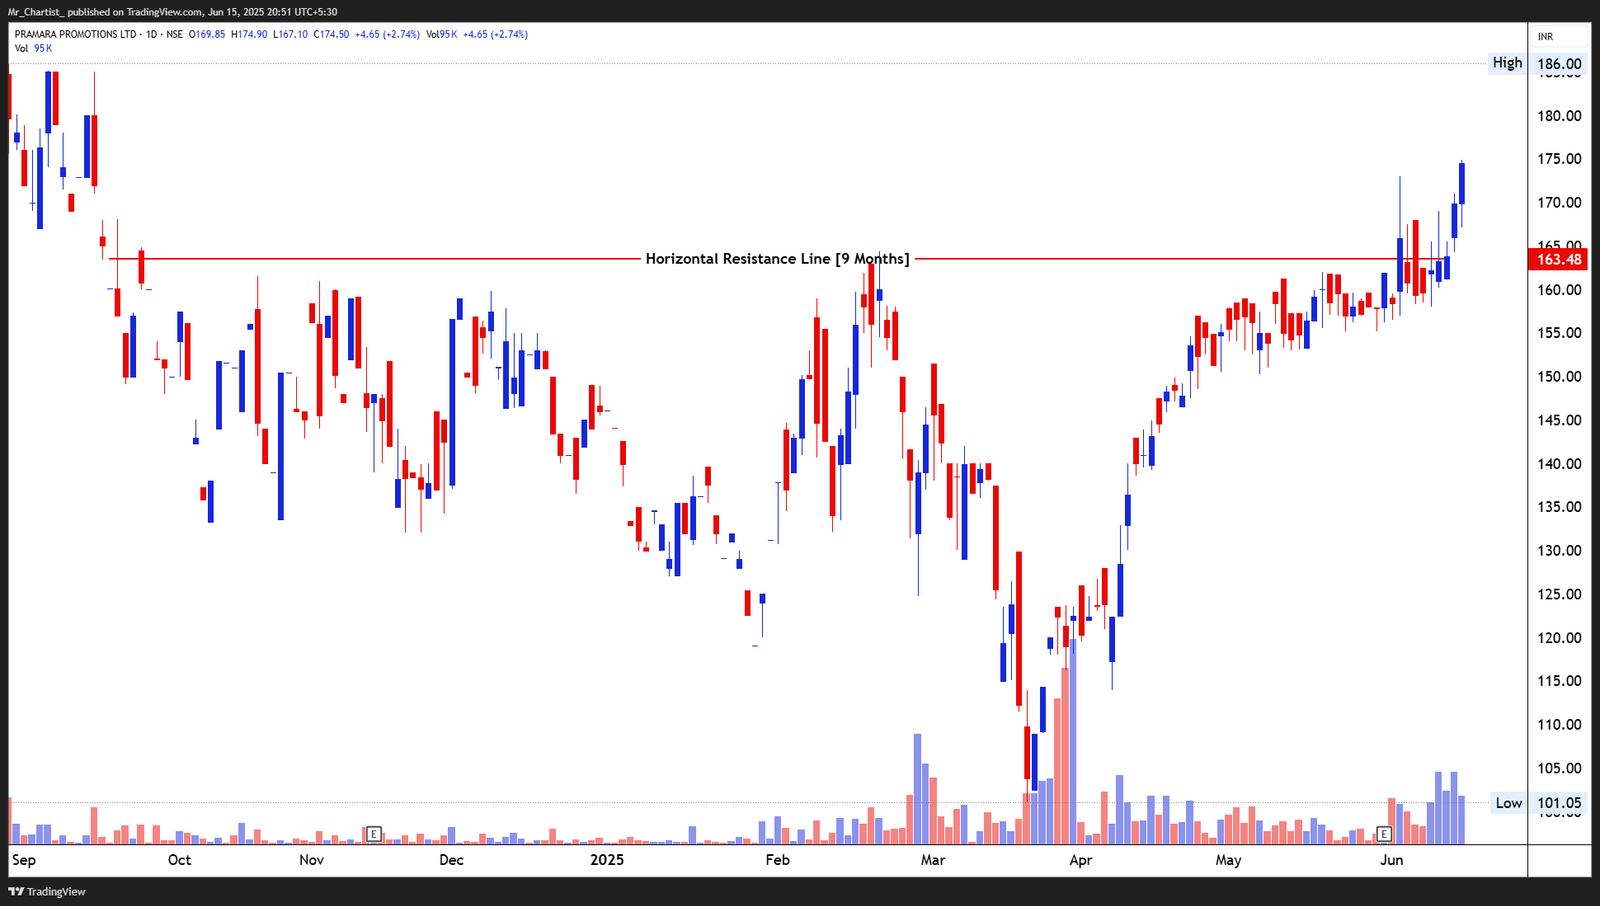
bearish fnoThe breakout was accompanied by strong bullish candles with little to no upper wicks,
Horizontal Resistance Breakout [9 Months]
Thesis & Analysis
Price Action Overview: Pramara Promotions has confirmed a breakout from a well-defined horizontal resistance level at ₹163.50, which had capped price advances since September 2024. This breakout follows a sustained uptrend from ₹105 levels, establishing a clear structural shift. The price action leading into the breakout was marked by a series of higher lows— indicating growing accumulation. The recent candles display controlled bullish momentum, culminating in today’s follow-through bar. Candlestick Pattern: The breakout was accompanied by strong bullish candles with little to no upper wicks, suggesting commitment from buyers. Recent price structure resembles a breakout- pullback-continuation formation. Volume Analysis: Volume has seen a marked increase in the last few sessions, validating the breakout. The spike in volume alongside breakout price movement suggests institutional entry and reduces the risk of a false breakout. 2. Crucial Support and Resistance Levels Support Levels: ₹163.50: Previous breakout resistance now acting as support. ₹150: Recent swing low and minor base zone. ₹135: Structural support from April consolidation. Resistance Levels: ₹185–₹190: Near-term extension zone. ₹200+: Psychological round level and potential measured move from the base range. 3. Strategic Trade Scenarios Bullish Scenario (Bias View): Sustained closes above ₹163.50 with volume support confirm the breakout. If the price continues to hold above this level, an upside projection toward ₹185–₹190 is likely, with ₹200+ as an extended target. Continued momentum from this base breakout favors bullish continuation. Pullback Scenario: If price revisits ₹163.50 and holds, it may offer a retest-buy opportunity. Breakdown below ₹150 would weaken the structure and suggest a reversion to the previous consolidation phase, potentially targeting ₹135.
Price Action
- ■Price action is structurally positive.
- ■Forming higher highs and higher lows.
Volume Profile
- ■Volume is supportive of the price action.
- ■Wait for volume expansion on breakout.
Key Levels
No zones specified
No zones specified
Invalidation Scenario
A weekly close below the support level invalidates this structure.
INNOVATIVE IDEALS AND SERVICES LTD
bearish fnoDouble Bottom Breakout
Daily Chart
Thesis & Analysis
No detailed thesis provided for this setup.
Price Action
- ■Price action is structurally positive.
- ■Forming higher highs and higher lows.
Volume Profile
- ■Volume is supportive of the price action.
- ■Wait for volume expansion on breakout.
Key Levels
No zones specified
No zones specified
Invalidation Scenario
A weekly close below the support level invalidates this structure.
INNOVATIVE IDEALS AND SERVICES LTD
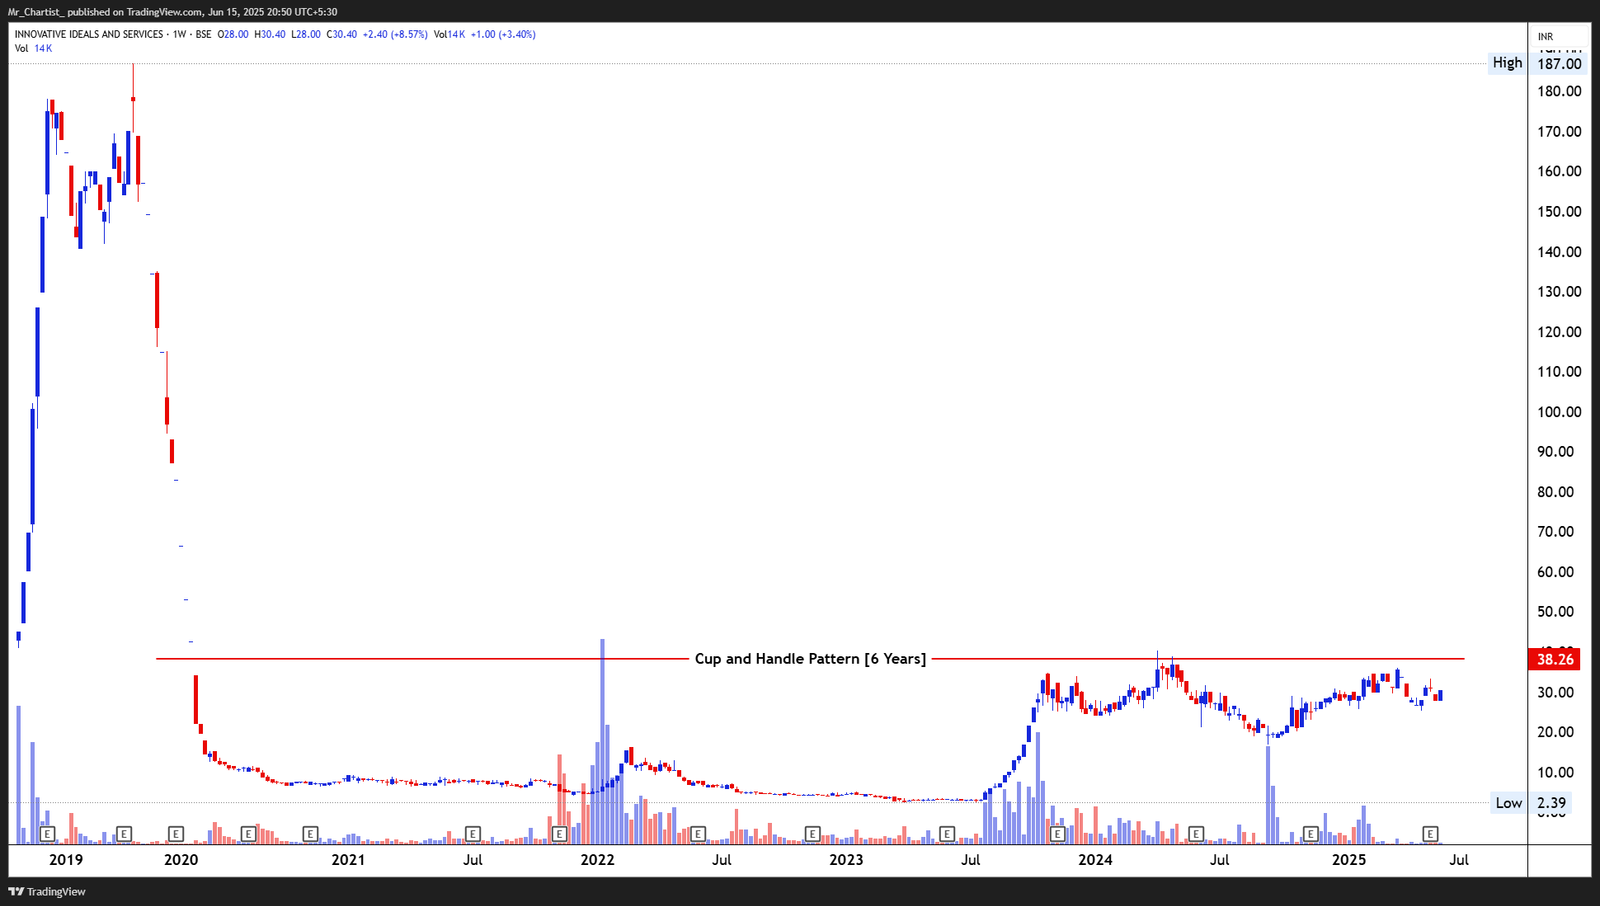
bearish fnoRecent candles indicate minor profit booking with a pullback toward the lower end
Cup and Handle Pattern [6 Years]
Thesis & Analysis
Price Action Overview: The stock has spent over half a decade forming a broad base structure culminating in a classic cup and handle formation. The neckline resistance at ₹38.25 has acted as a ceiling since 2019, repeatedly rejecting advances. After forming the cup base over 2020–2023, the handle phase has developed over the past year. Price is now fluctuating just below the neckline zone, forming tight ranges —a typical behavior before potential breakouts. Candlestick Pattern: Recent candles indicate minor profit booking with a pullback toward the lower end of the handle range. No major breakdown candle has emerged, and the handle pattern remains intact. Volume Analysis: Volume spikes were noted during the 2022–2023 rally, confirming institutional presence. Recent volume is subdued but stable, which is common during the handle consolidation phase. A renewed volume surge near the ₹38 breakout zone would be key for confirmation. 2. Crucial Support and Resistance Levels Support Levels: ₹26: Lower boundary of the handle formation. ₹20: Historical support from mid-2023 base. ₹14–₹15: Long-term support from the accumulation zone post-2020. Resistance Levels: ₹38.25: Cup and handle neckline and critical breakout level. ₹45–₹50: Near-term target zone post breakout. ₹60+: Extended zone from volume-weighted prior supply. 3. Strategic Trade Scenarios Bullish Scenario (Bias View): If the price manages a decisive weekly close above ₹38.25 on expanded volume, it would validate the multi-year cup and handle breakout. This setup may attract positional interest with a projection toward ₹45–₹50 initially. Pullback Scenario: If the price continues to drift lower but holds above ₹26, the handle pattern remains structurally intact. Breakdown below ₹26 on volume would negate the bullish setup and shift focus back to the long-term base at ₹20.
Price Action
- ■Price action is structurally positive.
- ■Forming higher highs and higher lows.
Volume Profile
- ■Volume is supportive of the price action.
- ■Wait for volume expansion on breakout.
Key Levels
No zones specified
No zones specified
Invalidation Scenario
A weekly close below the support level invalidates this structure.
SHIVA GRANITO EXPORT LTD
bearish fnoDouble Bottom Breakout
Daily Chart
Thesis & Analysis
No detailed thesis provided for this setup.
Price Action
- ■Price action is structurally positive.
- ■Forming higher highs and higher lows.
Volume Profile
- ■Volume is supportive of the price action.
- ■Wait for volume expansion on breakout.
Key Levels
No zones specified
No zones specified
Invalidation Scenario
A weekly close below the support level invalidates this structure.
SHIVA GRANITO EXPORT LTD
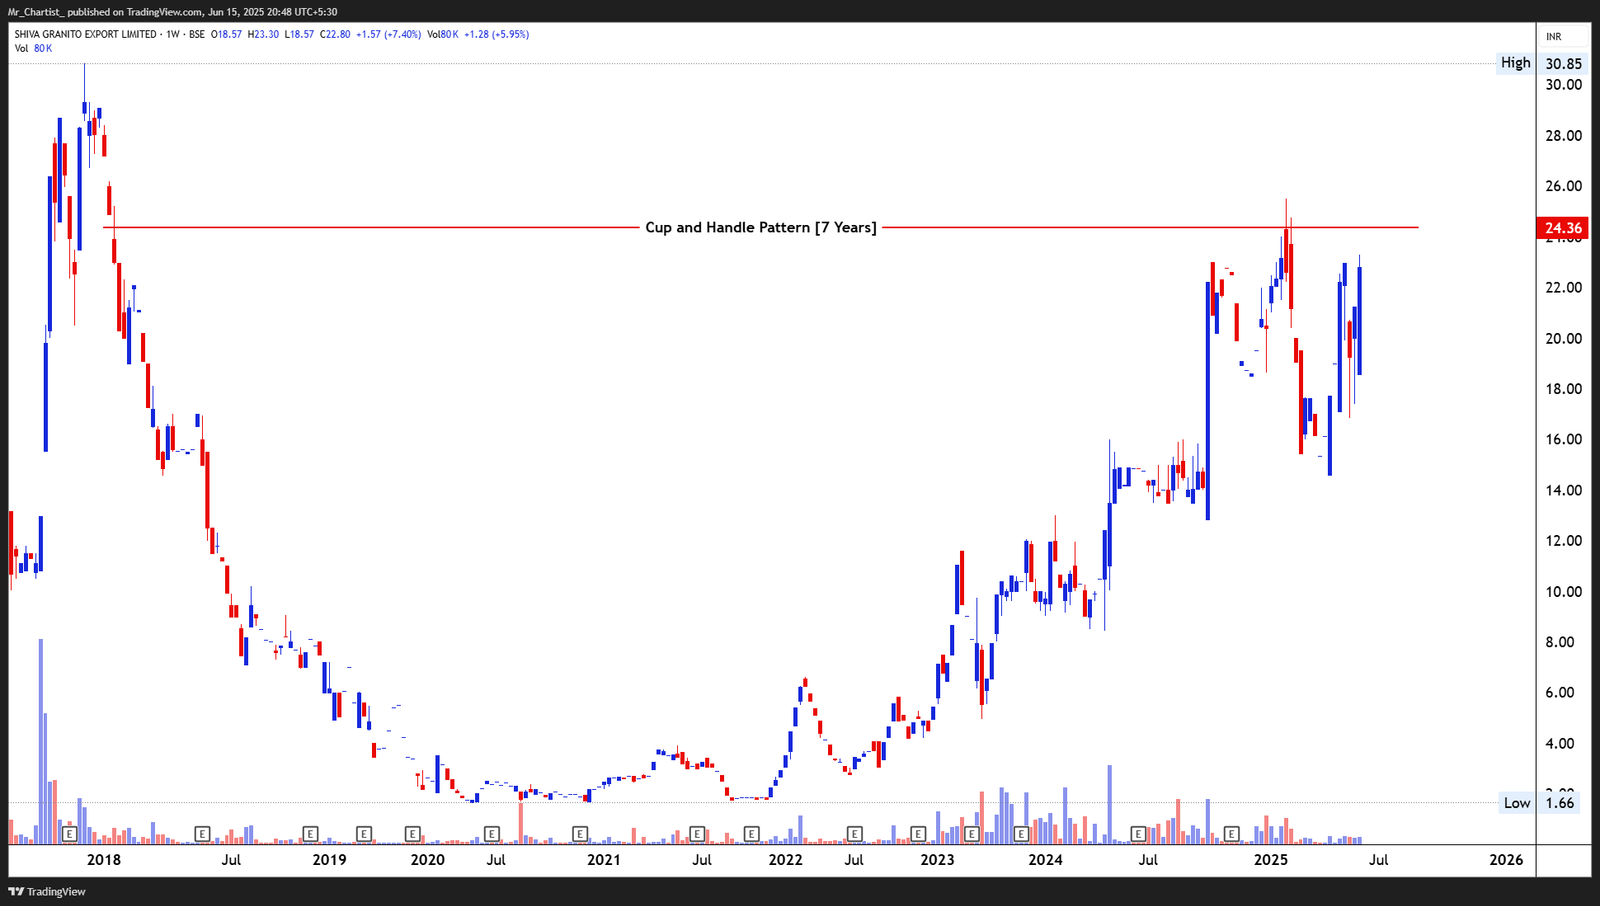
bearish fnoRecent weekly candles are bullish and show strong lower wicks, signaling aggressive
Cup and Handle Pattern [7 Years]
Thesis & Analysis
Price Action Overview: Shiva Granito is nearing the climax of a 7-year cup and handle base. The neckline resistance around ₹24.35 has held firm since 2018, rejecting price advances multiple times across the years. The structure shows a classic deep cup formed during 2018–2022, followed by a multi- month handle formation developing since mid-2023. Price is currently positioned just below the neckline, showing increased volatility and higher lows—indicative of building pressure. Candlestick Pattern: Recent weekly candles are bullish and show strong lower wicks, signaling aggressive buying on dips. The current week's breakout attempt hints at bullish intent, though a conclusive close above ₹24.35 remains pending. Volume Analysis: Volume has been on the rise through the handle phase, confirming accumulation. The spike in this week’s volume supports the ongoing bullish activity and may foreshadow an imminent breakout attempt. 2. Crucial Support and Resistance Levels Support Levels: ₹18.50: Minor support formed within the handle. ₹15.00: Structural mid-base level from 2023. ₹12.00: Historical low pivot in base formation. Resistance Levels: ₹24.35: Multi-year neckline and primary breakout level. ₹28.00–₹30.00: Intermediate price targets post breakout. ₹36.00+: Potential zone from measured pattern extension. 3. Strategic Trade Scenarios Bullish Scenario (Bias View): A decisive weekly close above ₹24.35, accompanied by above-average volume, will confirm the 7-year cup and handle breakout. This could open a swift move toward ₹28– ₹30, with the potential to retest prior swing highs around ₹36. Pullback Scenario: Failure to sustain above ₹24.35 could result in continued consolidation within the handle. A dip toward ₹18.50–₹15.00 would still be constructive unless broader breakdown occurs below ₹12, which would invalidate the bullish base structure.
Price Action
- ■Price action is structurally positive.
- ■Forming higher highs and higher lows.
Volume Profile
- ■Volume is supportive of the price action.
- ■Wait for volume expansion on breakout.
Key Levels
No zones specified
No zones specified
Invalidation Scenario
A weekly close below the support level invalidates this structure.
MODIS NAVNIRMAN LTD
bearish fnoDouble Bottom Breakout
Daily Chart
Thesis & Analysis
No detailed thesis provided for this setup.
Price Action
- ■Price action is structurally positive.
- ■Forming higher highs and higher lows.
Volume Profile
- ■Volume is supportive of the price action.
- ■Wait for volume expansion on breakout.
Key Levels
No zones specified
No zones specified
Invalidation Scenario
A weekly close below the support level invalidates this structure.
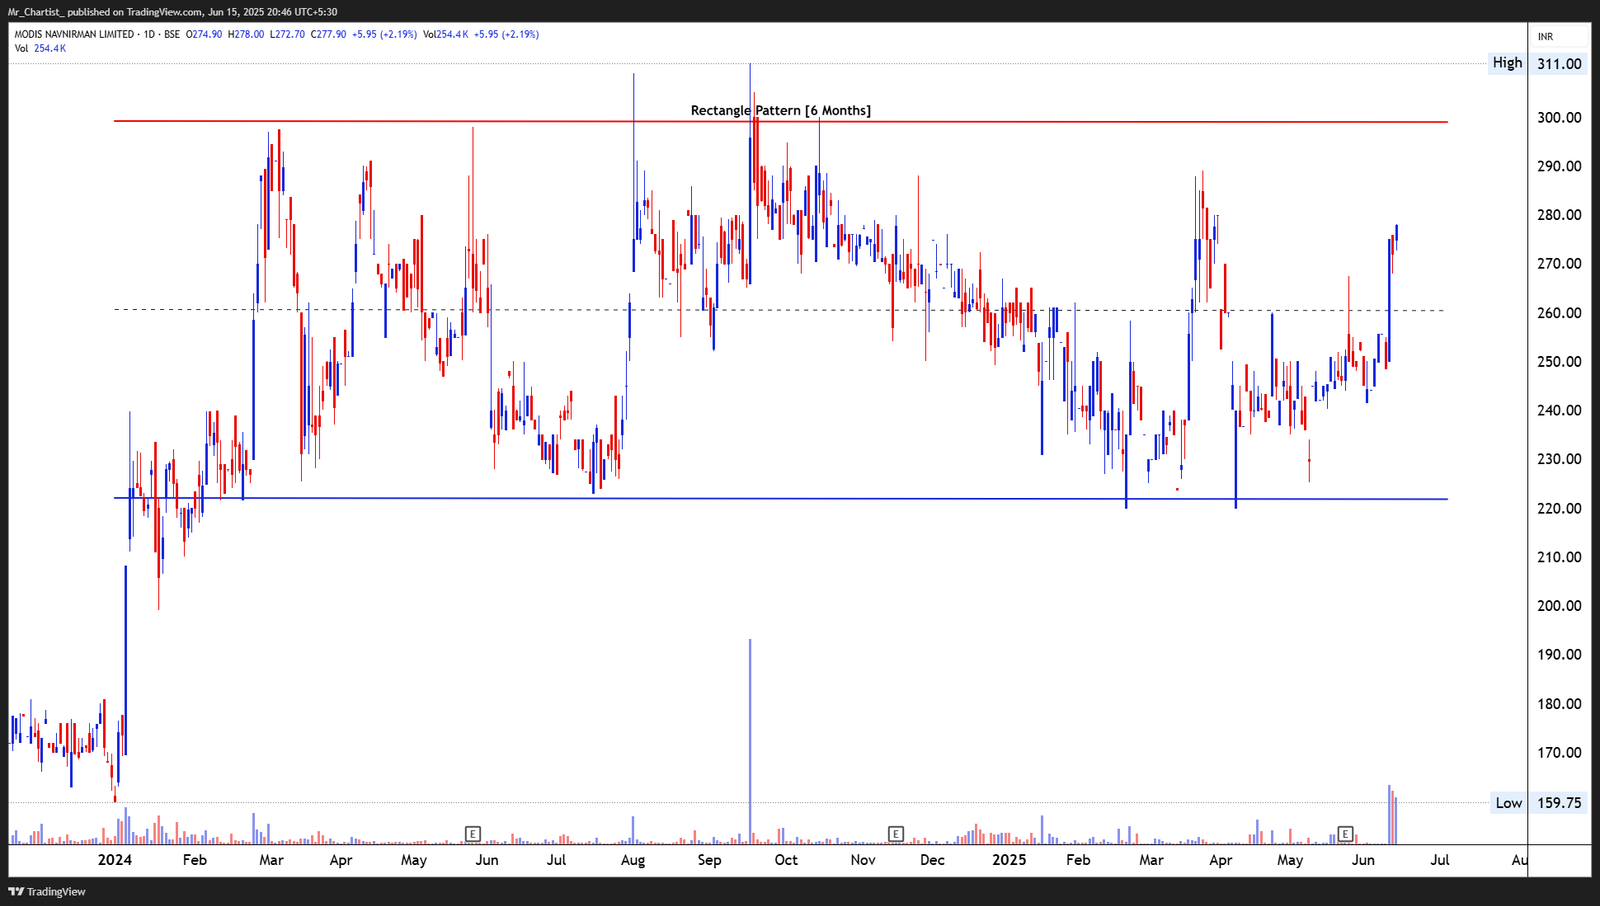
MODIS NAVNIRMAN LTD
bearish fnoRectangle Pattern [6 Months]
Daily Chart
Thesis & Analysis
No detailed thesis provided for this setup.
Price Action
- ■Price action is structurally positive.
- ■Forming higher highs and higher lows.
Volume Profile
- ■Volume is supportive of the price action.
- ■Wait for volume expansion on breakout.
Key Levels
No zones specified
No zones specified
Invalidation Scenario
A weekly close below the support level invalidates this structure.
MARKOLINES PAVEMENT TECHNOLOGIES
bearish fnoDouble Bottom Breakout
Daily Chart
Thesis & Analysis
No detailed thesis provided for this setup.
Price Action
- ■Price action is structurally positive.
- ■Forming higher highs and higher lows.
Volume Profile
- ■Volume is supportive of the price action.
- ■Wait for volume expansion on breakout.
Key Levels
No zones specified
No zones specified
Invalidation Scenario
A weekly close below the support level invalidates this structure.
Chart Image Not Extracted
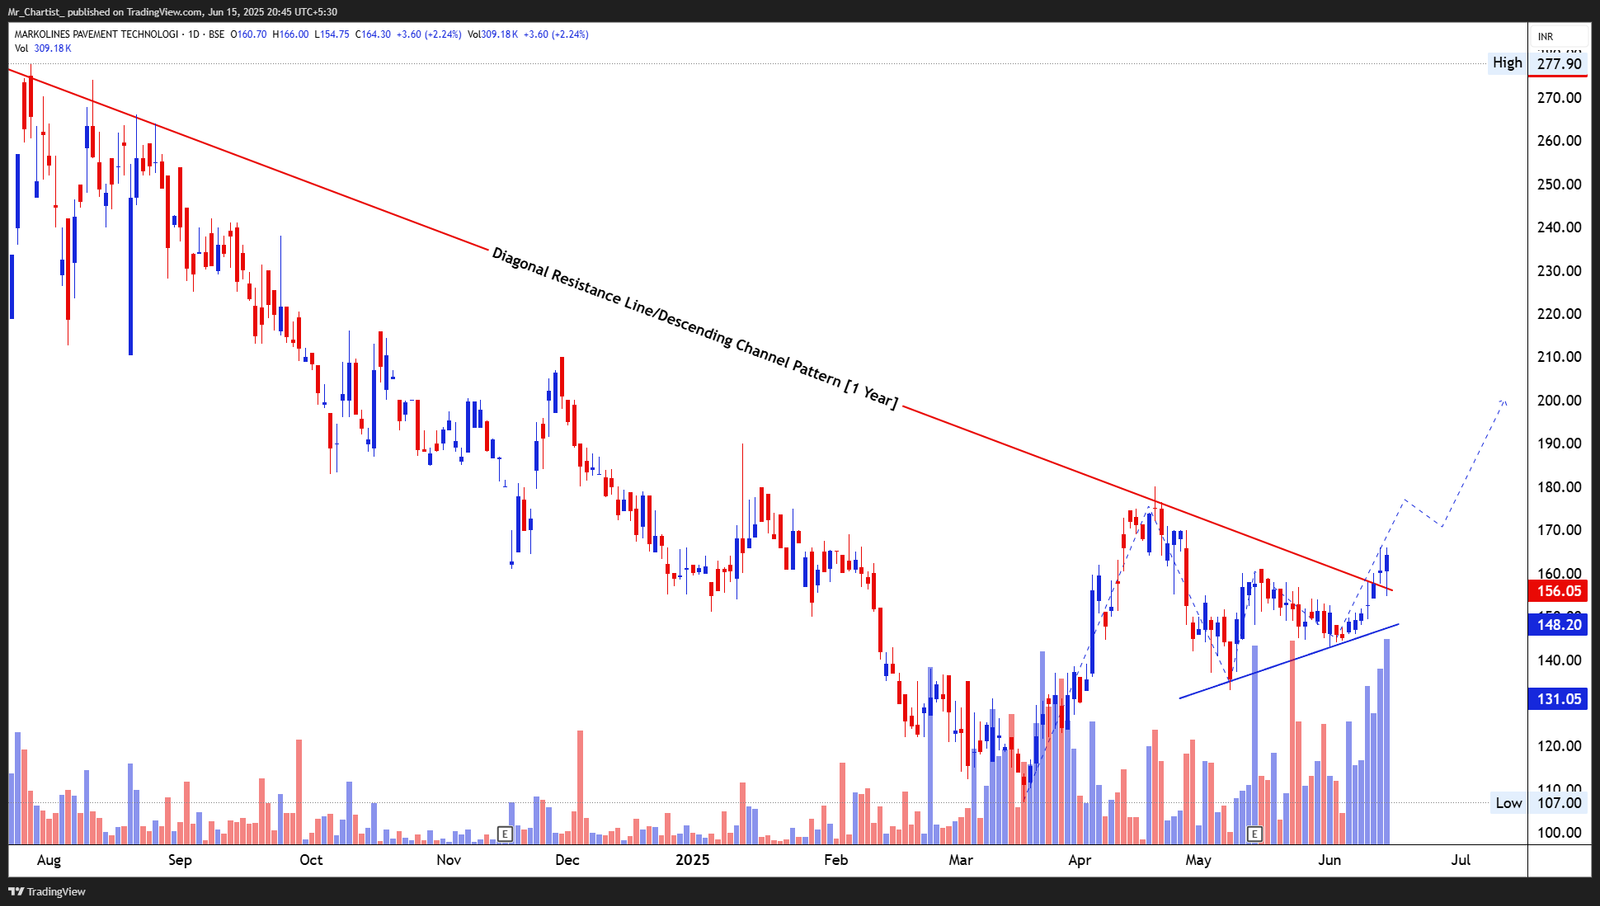
MARKOLINES PAVEMENT TECHNOLOGIES
bearish fnoDescending Channel / Diagonal Resistance Breakout [1 Year]
Daily Chart
Thesis & Analysis
No detailed thesis provided for this setup.
Price Action
- ■Price action is structurally positive.
- ■Forming higher highs and higher lows.
Volume Profile
- ■Volume is supportive of the price action.
- ■Wait for volume expansion on breakout.
Key Levels
No zones specified
No zones specified
Invalidation Scenario
A weekly close below the support level invalidates this structure.
VALIANT ORGANICS LTD
bearish fnoDouble Bottom Breakout
Daily Chart
Thesis & Analysis
No detailed thesis provided for this setup.
Price Action
- ■Price action is structurally positive.
- ■Forming higher highs and higher lows.
Volume Profile
- ■Volume is supportive of the price action.
- ■Wait for volume expansion on breakout.
Key Levels
No zones specified
No zones specified
Invalidation Scenario
A weekly close below the support level invalidates this structure.
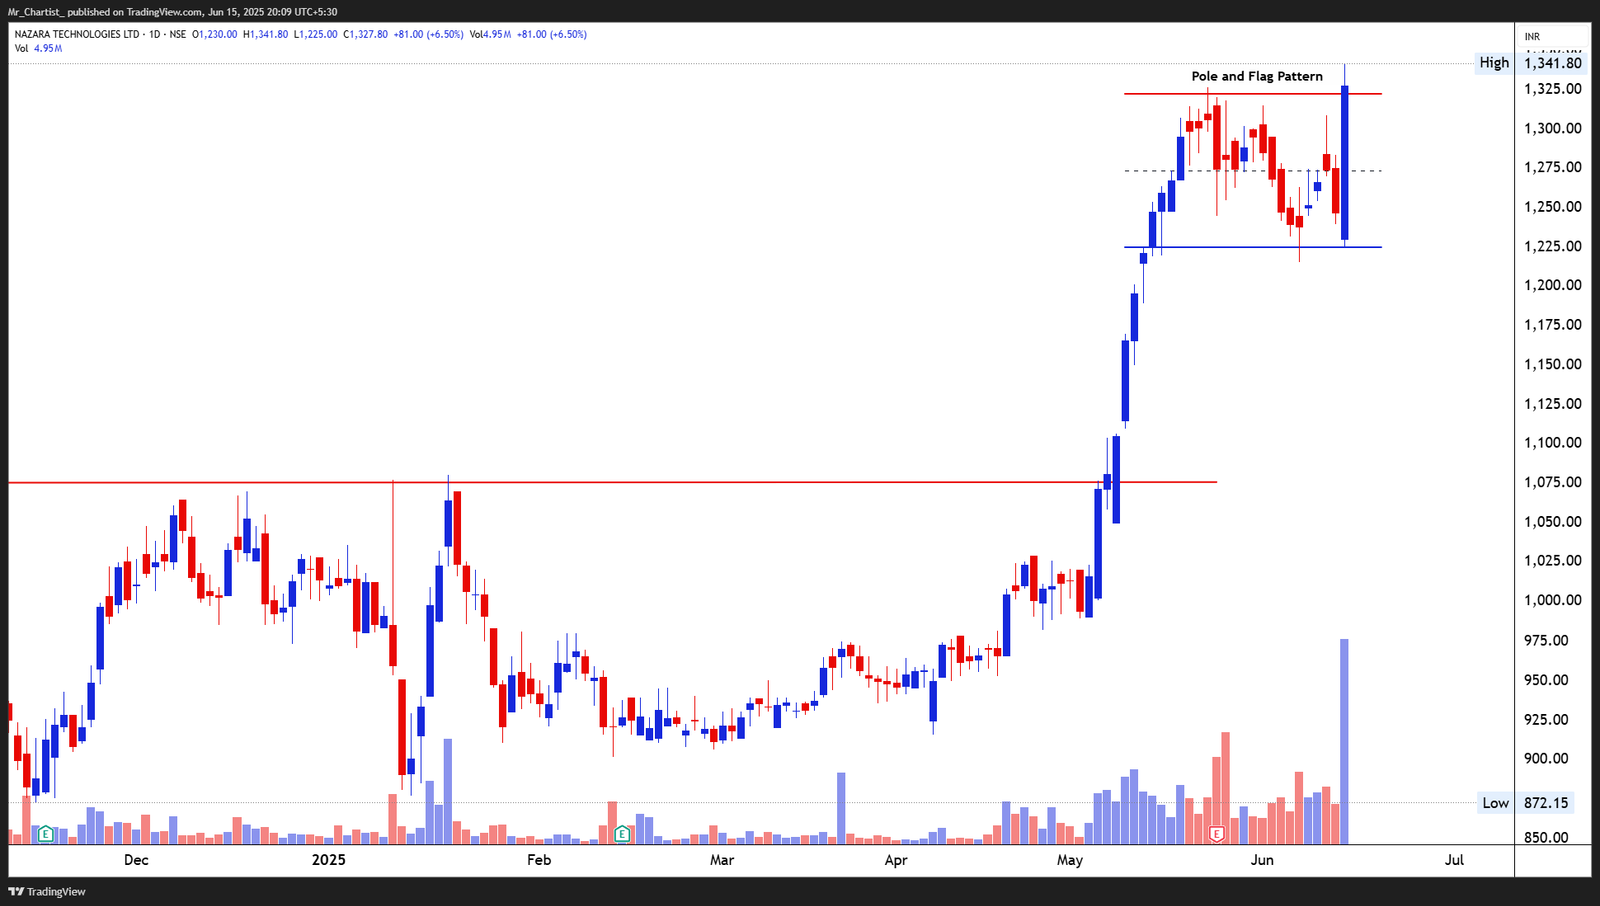
NAZARA TECHNOLOGIES LTD
bearish fnoThe breakout emerged via a dominant bullish Marubozu candle 📈, reflecting strong
Pole & Flag Breakout [1 Month]
Thesis & Analysis
Price Action Overview: Nazara Technologies has triggered a breakout from a classic bullish Pole & Flag continuation pattern, following a strong vertical rise from ₹1,075 to ₹1,325 during May. This explosive rally established the pole, while a tight sideways consolidation between ₹1,225–₹1,325 carved out the flag—displaying ideal trend digestion. Today’s breakout candle decisively cleared the flag’s upper boundary, signaling a resumption of bullish momentum within the prevailing uptrend. Candlestick Pattern: The breakout emerged via a dominant bullish Marubozu candle 📈, reflecting strong buyer conviction. The absence of upper wicks on the candle highlights smooth price acceptance beyond the consolidation zone. Volume Analysis: Volume surged to the highest level in recent weeks, validating the breakout move. Prior volume contraction within the flag adds credibility, exhibiting classic accumulation behavior before breakout. 2. Crucial Support and Resistance Levels Support Levels: ₹1,225: Flag base and immediate retest zone. ₹1,075: Previous breakout zone and major trend anchor. Resistance Levels: ₹1,425: Measured move projection based on pole height. ₹1,525+: Psychological round number and extended breakout target. 3. Strategic Trade Scenarios Bullish Scenario (Bias View) 🟢 Sustained closes above ₹1,325 on strong volume affirm a confirmed breakout. Price action favoring this structure can lead to a rally toward ₹1,425 initially, with potential upside toward ₹1,525+ on extended momentum. Continuation above ₹1,325 confirms dominant buyer control. Pullback Scenario 🔄 If price retraces to ₹1,225 and stabilizes with bullish reversal signals (like a hammer or engulfing), it could offer a low-risk re-entry. A breakdown below ₹1,225, however, may negate immediate bullish momentum and lead to reversion into the flag zone—bringing ₹1,075 back into focus.
Price Action
- ■Price action is structurally positive.
- ■Forming higher highs and higher lows.
Volume Profile
- ■Volume is supportive of the price action.
- ■Wait for volume expansion on breakout.
Key Levels
No zones specified
No zones specified
Invalidation Scenario
A weekly close below the support level invalidates this structure.
SOM DISTILLERIES & BREWERIES LTD
bearish fnoDouble Bottom Breakout
Daily Chart
Thesis & Analysis
No detailed thesis provided for this setup.
Price Action
- ■Price action is structurally positive.
- ■Forming higher highs and higher lows.
Volume Profile
- ■Volume is supportive of the price action.
- ■Wait for volume expansion on breakout.
Key Levels
No zones specified
No zones specified
Invalidation Scenario
A weekly close below the support level invalidates this structure.
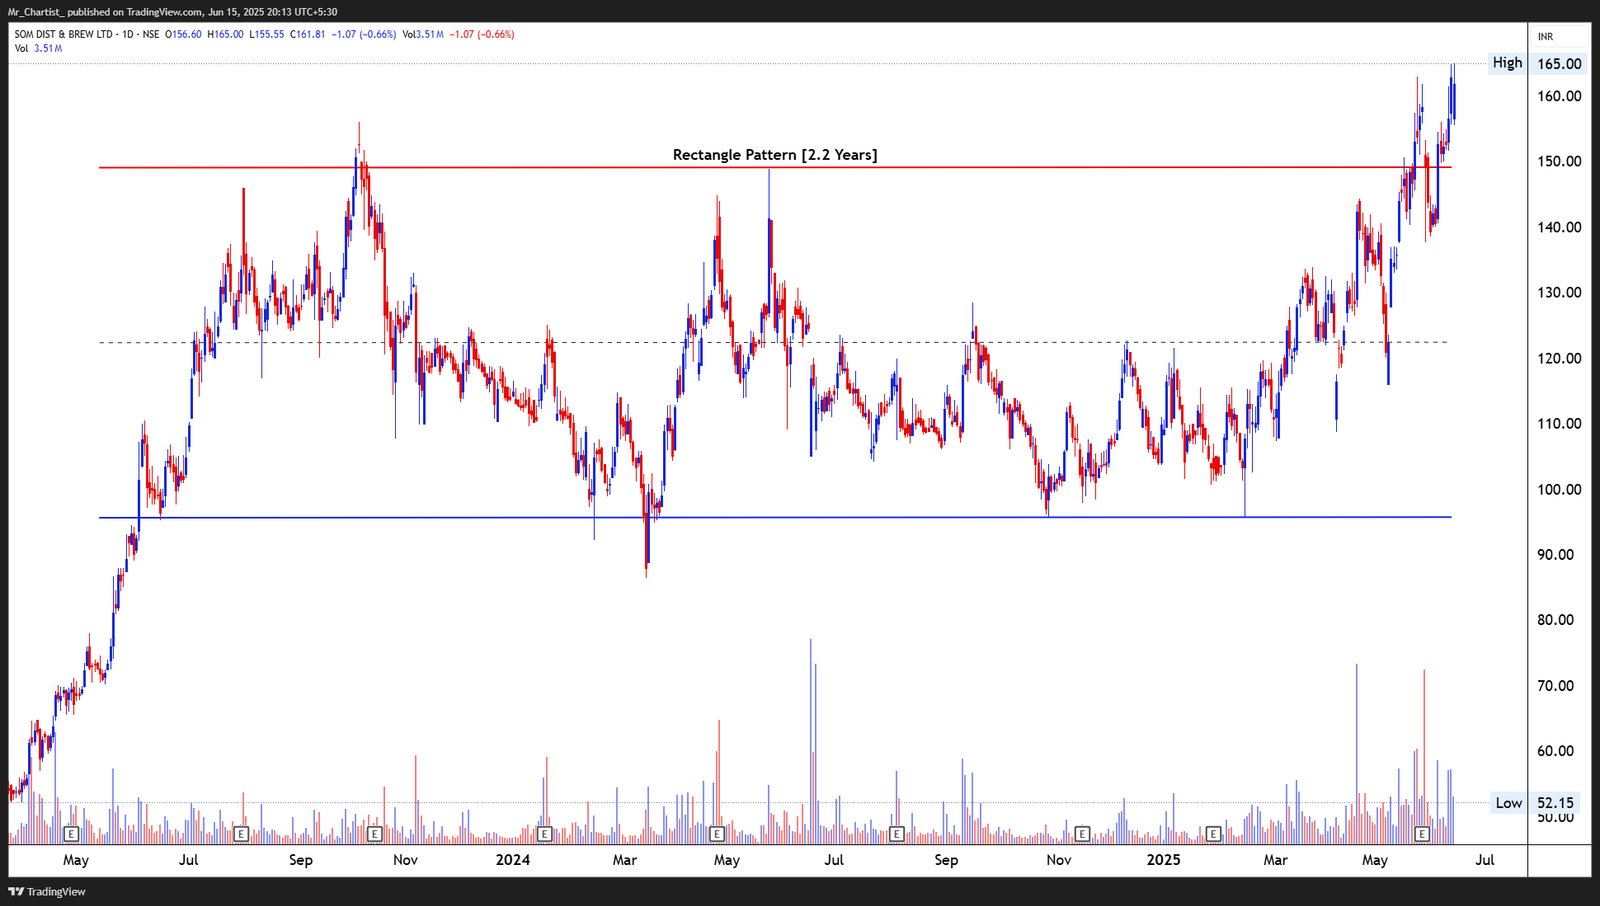
SOM DISTILLERIES & BREWERIES LTD
bearish fnoRecent sessions reflect a bullish marubozu-style breakout 📈 with negligible upper
Rectangle Pattern Breakout [2.2 Years]
Thesis & Analysis
Price Action Overview: SOM Distilleries has successfully broken out of a long-term rectangle consolidation that lasted over two years, with resistance capped around the ₹150 mark. The base formation between ₹90 and ₹150 represented a broad, sideways structure where multiple attempts to breach the upper range were rejected—until now. The stock has shown a clean breakout above ₹150, confirming a structural shift in sentiment after repeated accumulation phases. The rally from ₹120 levels in May has been near vertical, showing breakout strength after price coiled tightly within the upper band. Candlestick Pattern: Recent sessions reflect a bullish marubozu-style breakout 📈 with negligible upper wicks and closing strength. Buyers have maintained dominance with minimal profit- booking dips, reinforcing breakout conviction. Volume Analysis: Volume has picked up significantly during the breakout week—reaching one of the highest levels of the year. The breakout is well-supported by institutional-style accumulation, significantly reducing the probability of a false move. 2. Crucial Support and Resistance Levels Support Levels: ₹150: Former range resistance; now acting as primary breakout support. ₹135: Intermediate consolidation level and minor floor. ₹120: Base zone from which breakout momentum began. Resistance Levels: ₹175–₹180: Near-term projected range extension target. ₹200+: Psychological level and measured move projection from the 60-point rectangle base. 3. Strategic Trade Scenarios Bullish Scenario (Bias View) 🟢 As long as the price holds above ₹150 on a closing basis, the breakout remains valid. Sustained bullish action can extend this leg higher toward ₹175–₹180, with ₹200+ being an achievable upside target based on the rectangle’s height. Price structure suggests a potential multimonth trend reversal if volume sustains. Pullback Scenario 🔄 If price pulls back to ₹150 and forms bullish reversal signals (e.g., hammer, inside bar), it could provide a secondary entry point with favorable risk-reward. A breakdown below ₹135 would weaken bullish bias and return the stock to consolidation territory.
Price Action
- ■Price action is structurally positive.
- ■Forming higher highs and higher lows.
Volume Profile
- ■Volume is supportive of the price action.
- ■Wait for volume expansion on breakout.
Key Levels
No zones specified
No zones specified
Invalidation Scenario
A weekly close below the support level invalidates this structure.
NARAYANA HRUDAYALAYA LTD
bearish fnoDouble Bottom Breakout
Daily Chart
Thesis & Analysis
No detailed thesis provided for this setup.
Price Action
- ■Price action is structurally positive.
- ■Forming higher highs and higher lows.
Volume Profile
- ■Volume is supportive of the price action.
- ■Wait for volume expansion on breakout.
Key Levels
No zones specified
No zones specified
Invalidation Scenario
A weekly close below the support level invalidates this structure.
NARAYANA HRUDAYALAYA LTD
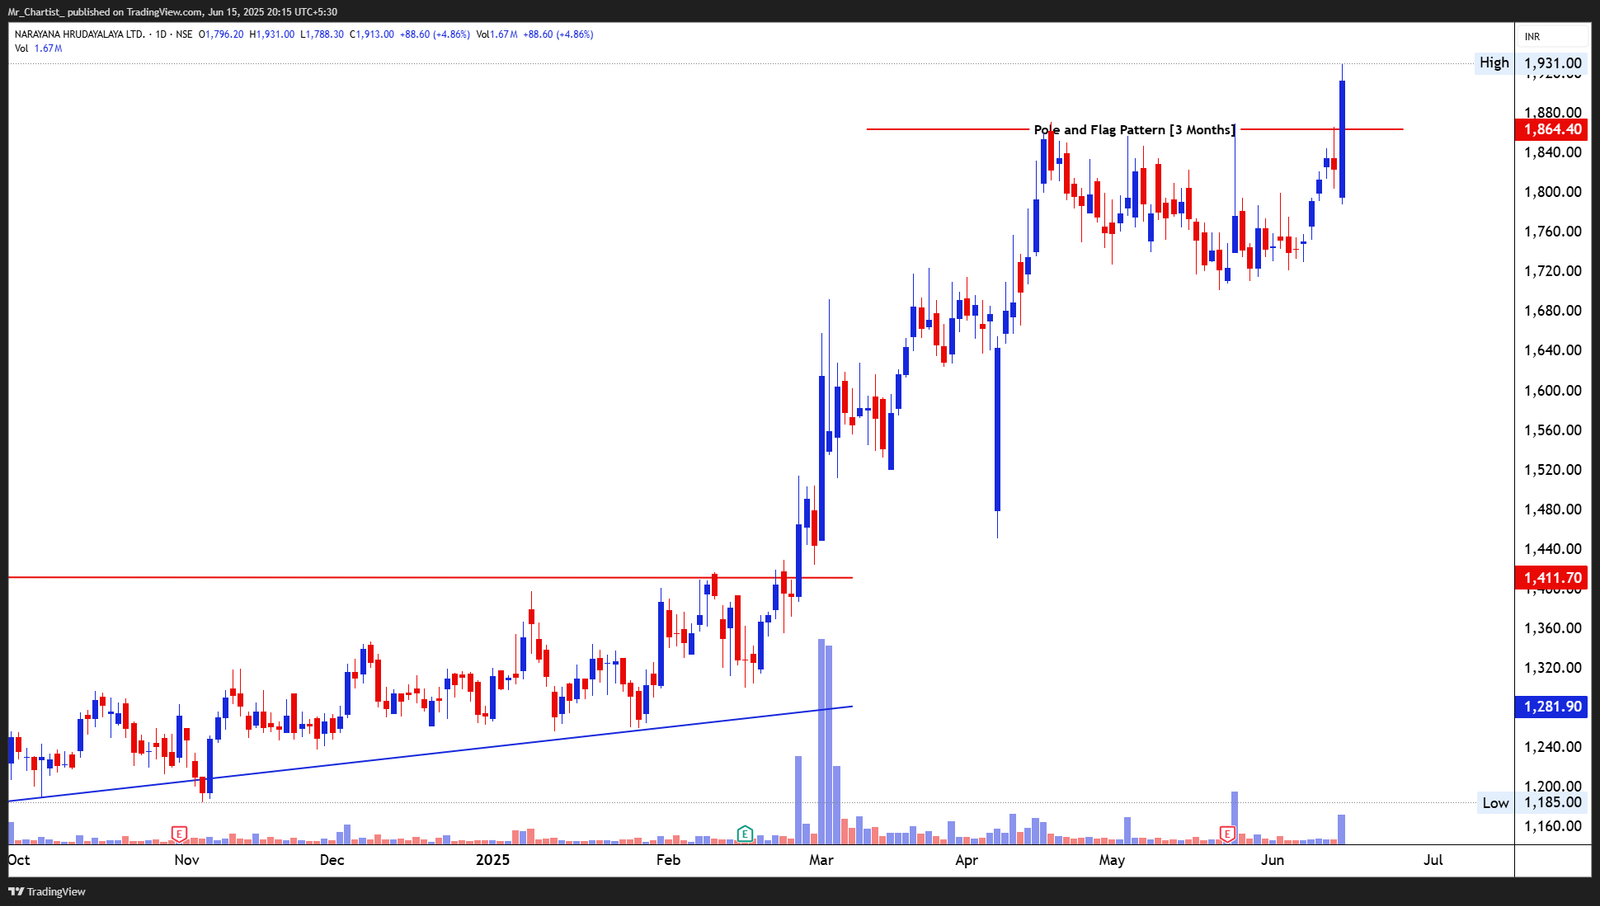
bearish fnoToday's breakout occurred via a strong bullish Marubozu candle—no upper wicks, full-
Pole & Flag Breakout [3 Months]
Thesis & Analysis
Price Action Overview: Narayana Hrudayalaya has confirmed a bullish breakout from a Pole & Flag pattern that consolidated neatly over the last three months between ₹1,760–₹1,865. This flag followed a sharp vertical surge (the pole) from ₹1,420 to ₹1,865, setting a strong directional bias. The current breakout bar decisively pierced through the upper flag resistance, closing at a fresh high with robust momentum—indicating renewed buyer interest and the start of another trending leg. 🚀 Candlestick Pattern: Today's breakout occurred via a strong bullish Marubozu candle—no upper wicks, full- body candle, and highest close in months. This signals clear buyer control and conviction at higher prices. Volume Analysis: Breakout was accompanied by a sharp surge in volume, highest since the initial pole formation in March. This volume-price synchronization is a classic validation of breakout strength, often pointing to institutional activity. 📊 2. Crucial Support and Resistance Levels Support Levels: ₹1,865: Previous resistance of the flag, now serving as key support. ₹1,760: Lower boundary of the flag range. ₹1,411: Prior breakout base and major trend support. Resistance Levels: ₹2,050–₹2,100: Measured move target from the flag’s pole height. ₹2,200+: Potential extended leg, aligned with round psychological levels. 3. Strategic Trade Scenarios Bullish Scenario (Bias View) 🟢 As long as the stock sustains above ₹1,865 on closing basis, the breakout remains valid and strong. Momentum continuation could carry the price toward ₹2,050 initially, with ₹2,200+ as a broader trend target. Pullback Scenario 🔄 If price retests ₹1,865 and forms a bullish reversal (e.g., hammer or bullish engulfing), it could offer a re-entry opportunity. A breakdown below ₹1,760 would reintroduce the flag range and shift bias to neutral.
Price Action
- ■Price action is structurally positive.
- ■Forming higher highs and higher lows.
Volume Profile
- ■Volume is supportive of the price action.
- ■Wait for volume expansion on breakout.
Key Levels
No zones specified
No zones specified
Invalidation Scenario
A weekly close below the support level invalidates this structure.
GRM OVERSEAS LTD
bearish fnoDouble Bottom Breakout
Daily Chart
Thesis & Analysis
No detailed thesis provided for this setup.
Price Action
- ■Price action is structurally positive.
- ■Forming higher highs and higher lows.
Volume Profile
- ■Volume is supportive of the price action.
- ■Wait for volume expansion on breakout.
Key Levels
No zones specified
No zones specified
Invalidation Scenario
A weekly close below the support level invalidates this structure.
GRM OVERSEAS LTD
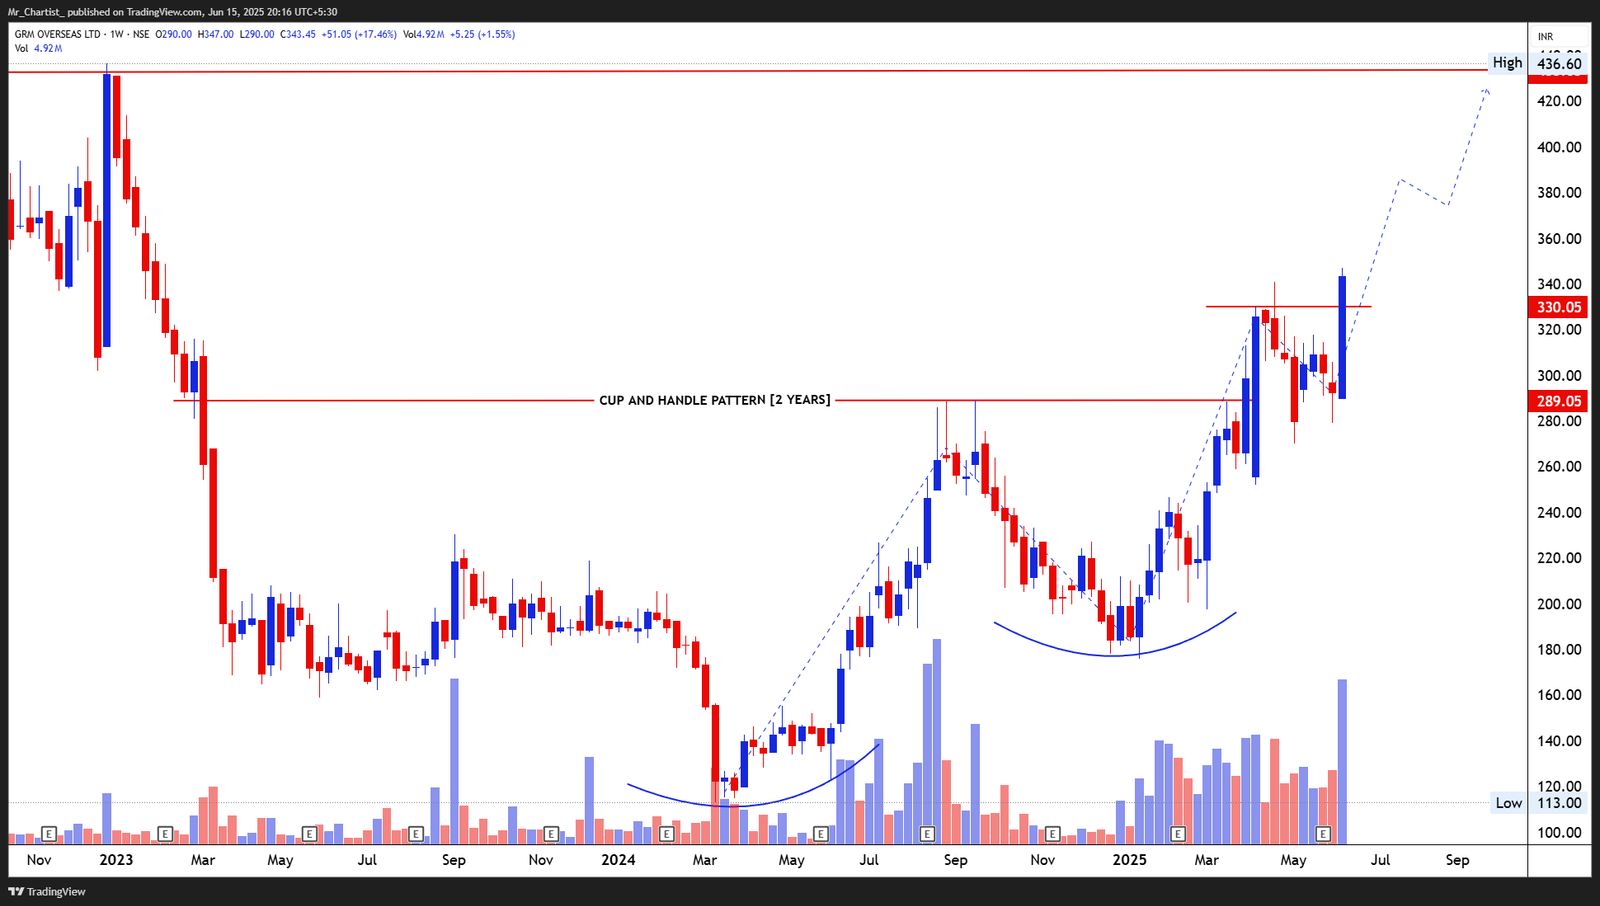
bearish fnoThe breakout bar is a large bullish candle, engulfing prior sessions and closing near
Cup and Handle Breakout [2 Years]
Thesis & Analysis
Price Action Overview: GRM Overseas has confirmed a breakout from a 2-year-long Cup and Handle formation, a powerful basing structure. The neckline near ₹330 was tested multiple times, with the handle forming a controlled consolidation phase between ₹290– ₹330. Today’s candle pierced above the neckline with strong follow-through momentum —indicating a transition from base formation to trend resumption. The structure is suggestive of a long-term reversal, especially after such prolonged accumulation. 📈 Candlestick Pattern: The breakout bar is a large bullish candle, engulfing prior sessions and closing near its high. This indicates decisive buying interest and bullish sentiment. 🔥 Volume Analysis: Volume surged significantly during the breakout session—highest in recent weeks —confirming institutional participation. The handle phase had declining volume, validating the textbook breakout mechanics of this pattern. 2. Crucial Support and Resistance Levels Support Levels: ₹330: Neckline resistance now turned into immediate support. ₹289: Previous handle low and key breakout retest zone. ₹240: Base support formed during consolidation in early 2024. Resistance Levels: ₹385–₹390: Near-term resistance cluster from historical price reaction. ₹435–₹440+: Measured target from the cup height; also previous major top. 3. Strategic Trade Scenarios Bullish Scenario (Bias View) ✅ Sustained closing above ₹330 confirms a structural breakout. If this zone holds, price may target ₹385 in the near term, followed by ₹435 as a medium-term projection. Continuation signals above ₹343 would confirm trend strength. Pullback Scenario 🔁 If price retests ₹330 and finds buying support (e.g., with a bullish reversal candle), it could offer a high-probability continuation setup. A fall below ₹289 would neutralize the bullish view and delay breakout confirmation.
Price Action
- ■Price action is structurally positive.
- ■Forming higher highs and higher lows.
Volume Profile
- ■Volume is supportive of the price action.
- ■Wait for volume expansion on breakout.
Key Levels
No zones specified
No zones specified
Invalidation Scenario
A weekly close below the support level invalidates this structure.
EMBASSY OFFICE PARKS REIT
bearish fnoDouble Bottom Breakout
Daily Chart
Thesis & Analysis
No detailed thesis provided for this setup.
Price Action
- ■Price action is structurally positive.
- ■Forming higher highs and higher lows.
Volume Profile
- ■Volume is supportive of the price action.
- ■Wait for volume expansion on breakout.
Key Levels
No zones specified
No zones specified
Invalidation Scenario
A weekly close below the support level invalidates this structure.
EMBASSY OFFICE PARKS REIT
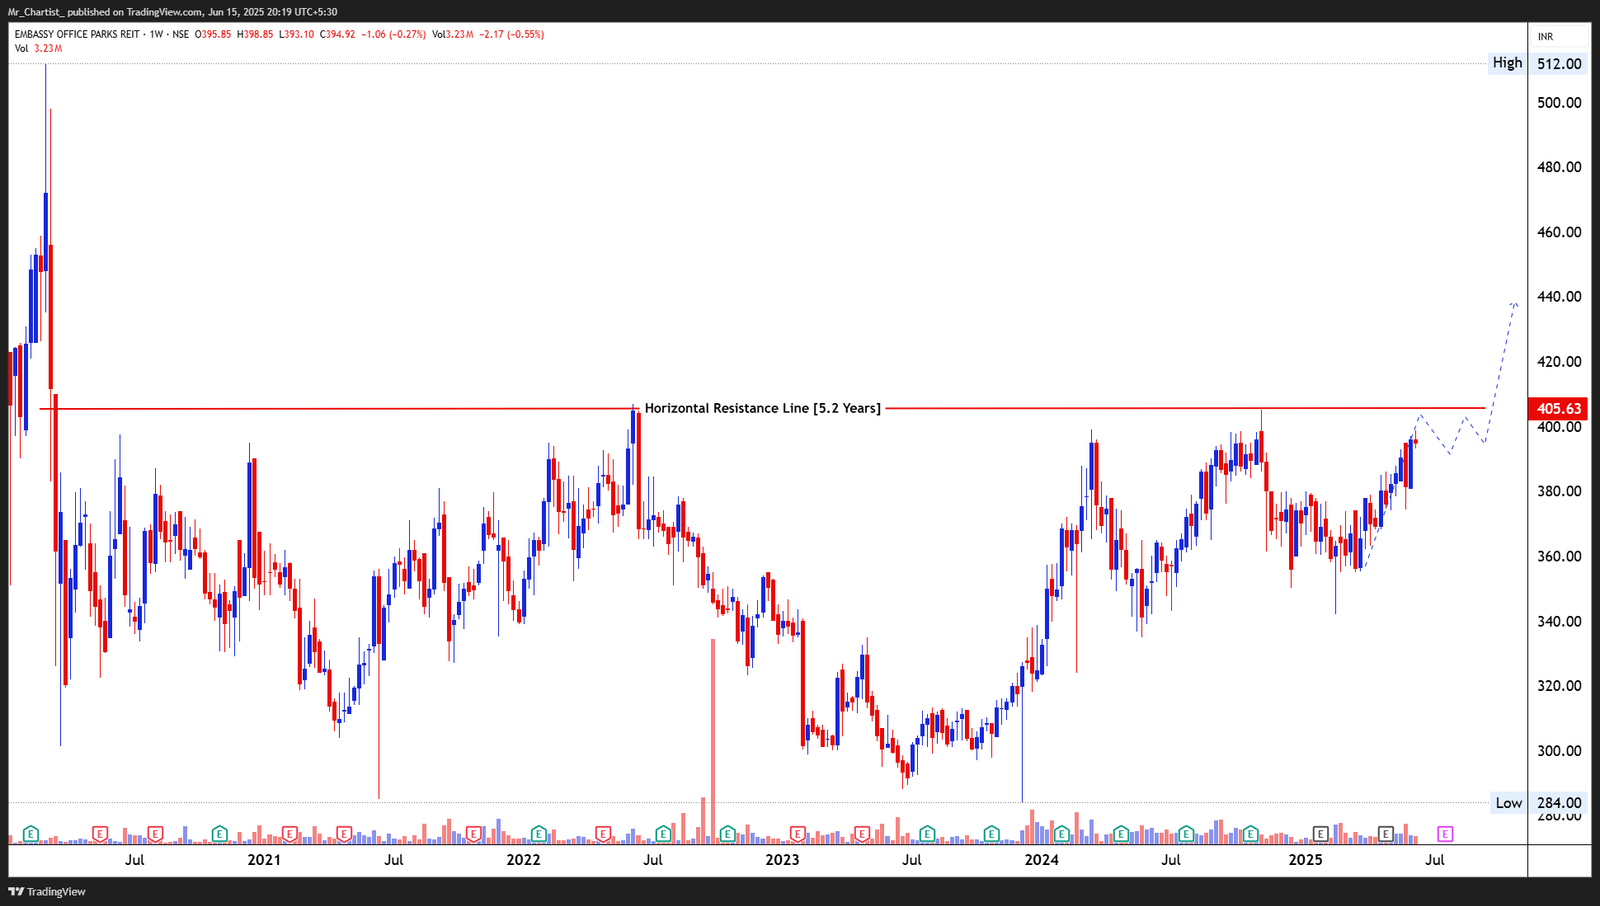
bearish fnoDouble Bottom Breakout
Horizontal Resistance Line [5.2 Years]
Thesis & Analysis
Price Action Overview: Embassy REIT is currently approaching a major multi-year horizontal resistance zone near ₹405.50, which has remained unbroken since early 2020. The price has made a steady climb from the ₹325–₹330 base, constructing a broad rounding bottom structure, indicating long-term accumulation. The current candle suggests an attempt to break the range highs, with buyers steadily testing upper supply zones after several failed prior attempts. Candlestick Structure: While no decisive breakout candle has formed yet, recent weekly bars show consistent higher closes, small-bodied bullish candles, and reduced lower wicks— suggesting seller exhaustion. A breakout attempt could emerge soon with a strong close above ₹406. Volume Analysis: Volume has been gradually increasing over the past few weeks, hinting at growing institutional participation. A surge on a breakout week would confirm genuine accumulation and trigger long-term bullish momentum. 2. Crucial Support and Resistance Levels Support Levels: ₹385: Near-term swing support and retest zone. ₹362: Strong base from previous consolidation phase. ₹330: Long-term structural support from 2023 base. Resistance Levels: ₹405.50: 5-year horizontal resistance—key breakout trigger. ₹430–₹440: Post-breakout expansion zone. ₹512: All-time high and historical resistance from 2019 listing. 3. Strategic Trade Scenarios Bullish Scenario (Bias View) ✅ A weekly close above ₹406 on strong volume would confirm a 5.2-year range breakout, signaling long-term trend initiation. The breakout could unlock upside potential toward ₹430 initially, and eventually toward ₹510+ on extended rally continuation. Pullback Scenario 🔁 If price rejects at ₹406 again, a minor pullback toward ₹385–₹362 could provide a healthy retest opportunity. Only a sustained breakdown below ₹330 would invalidate the bullish thesis and suggest long-term resistance is still intact.
Price Action
- ■Price action is structurally positive.
- ■Forming higher highs and higher lows.
Volume Profile
- ■Volume is supportive of the price action.
- ■Wait for volume expansion on breakout.
Key Levels
No zones specified
No zones specified
Invalidation Scenario
A weekly close below the support level invalidates this structure.
GOODLUCK INDIA LTD
bearish fnoDouble Bottom Breakout
Daily Chart
Thesis & Analysis
No detailed thesis provided for this setup.
Price Action
- ■Price action is structurally positive.
- ■Forming higher highs and higher lows.
Volume Profile
- ■Volume is supportive of the price action.
- ■Wait for volume expansion on breakout.
Key Levels
No zones specified
No zones specified
Invalidation Scenario
A weekly close below the support level invalidates this structure.
GOODLUCK INDIA LTD
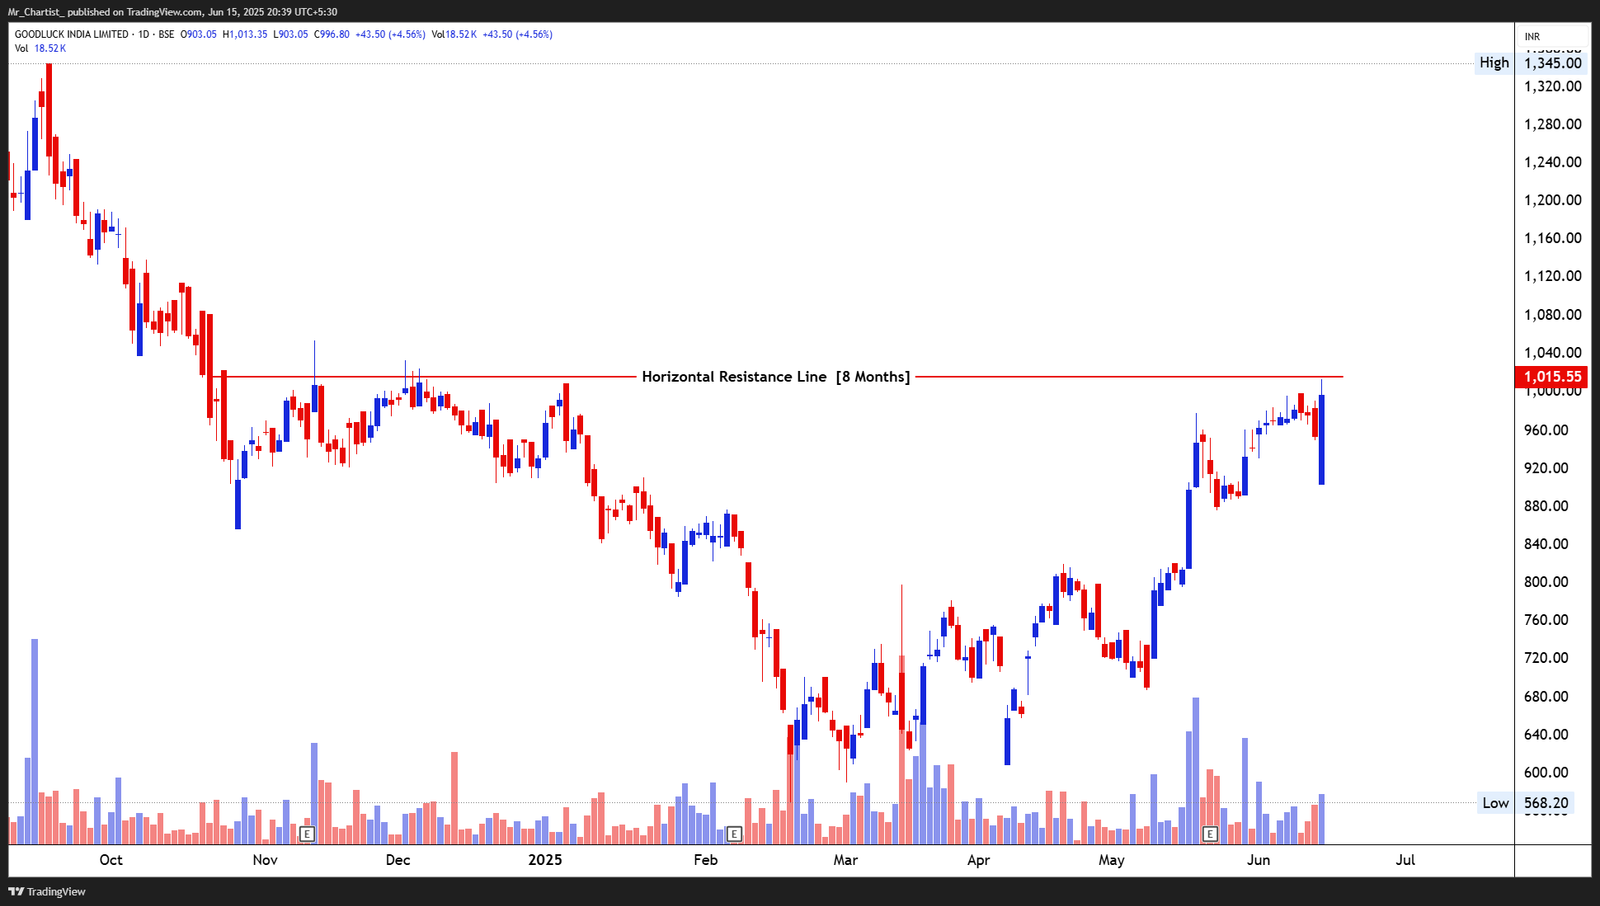
bearish fnoDouble Bottom Breakout
Horizontal Resistance Line [8 Months]
Thesis & Analysis
Price Action Overview: Goodluck India is approaching a critical breakout zone around ₹1,015, a level that has consistently acted as a supply ceiling since late 2024. The current uptrend stems from a strong recovery off the ₹740 zone, with price carving out higher lows over the past two months—suggesting a structurally bullish setup. Recent price behavior is tightening just below the resistance, typically a sign of energy building before a potential breakout. Candlestick Structure: Today’s candle shows a strong bullish push closing near the day’s high with minimal upper shadow—highlighting buyer dominance. A follow-through move above ₹1,015 with a bullish candle could trigger the breakout confirmation. Volume Analysis: Volume has been gradually rising during this ascent. The spike in recent sessions indicates growing interest and accumulation. A volume expansion during breakout would reinforce the strength and reduce false breakout risk. 2. Crucial Support and Resistance Levels Support Levels: ₹960: Recent swing low and micro support. ₹905: Minor consolidation base from early June. ₹850: Psychological and structural support from May. Resistance Levels: ₹1,015: Horizontal breakout level—8-month resistance zone. ₹1,090–₹1,120: Post-breakout target zone. ₹1,200+: Round number resistance and potential trend extension level. 3. Strategic Trade Scenarios Bullish Scenario (Bias View) ✅ If the price sustains above ₹1,015 on strong volume, it would validate the 8-month resistance breakout. A move toward ₹1,090–₹1,120 is then likely, with potential for ₹1,200+ if momentum persists. A breakout with volume confirmation signals continued institutional buying. Pullback Scenario 🔁 If price pulls back from ₹1,015, a retest of ₹960–₹905 may offer a dip-buying opportunity. A breakdown below ₹850 would neutralize the bullish setup and signal a reversion to range-bound action.
Price Action
- ■Price action is structurally positive.
- ■Forming higher highs and higher lows.
Volume Profile
- ■Volume is supportive of the price action.
- ■Wait for volume expansion on breakout.
Key Levels
No zones specified
No zones specified
Invalidation Scenario
A weekly close below the support level invalidates this structure.
DHANI SERVICES LTD
bearish fnoDouble Bottom Breakout
Daily Chart
Thesis & Analysis
No detailed thesis provided for this setup.
Price Action
- ■Price action is structurally positive.
- ■Forming higher highs and higher lows.
Volume Profile
- ■Volume is supportive of the price action.
- ■Wait for volume expansion on breakout.
Key Levels
No zones specified
No zones specified
Invalidation Scenario
A weekly close below the support level invalidates this structure.
Chart Image Not Extracted
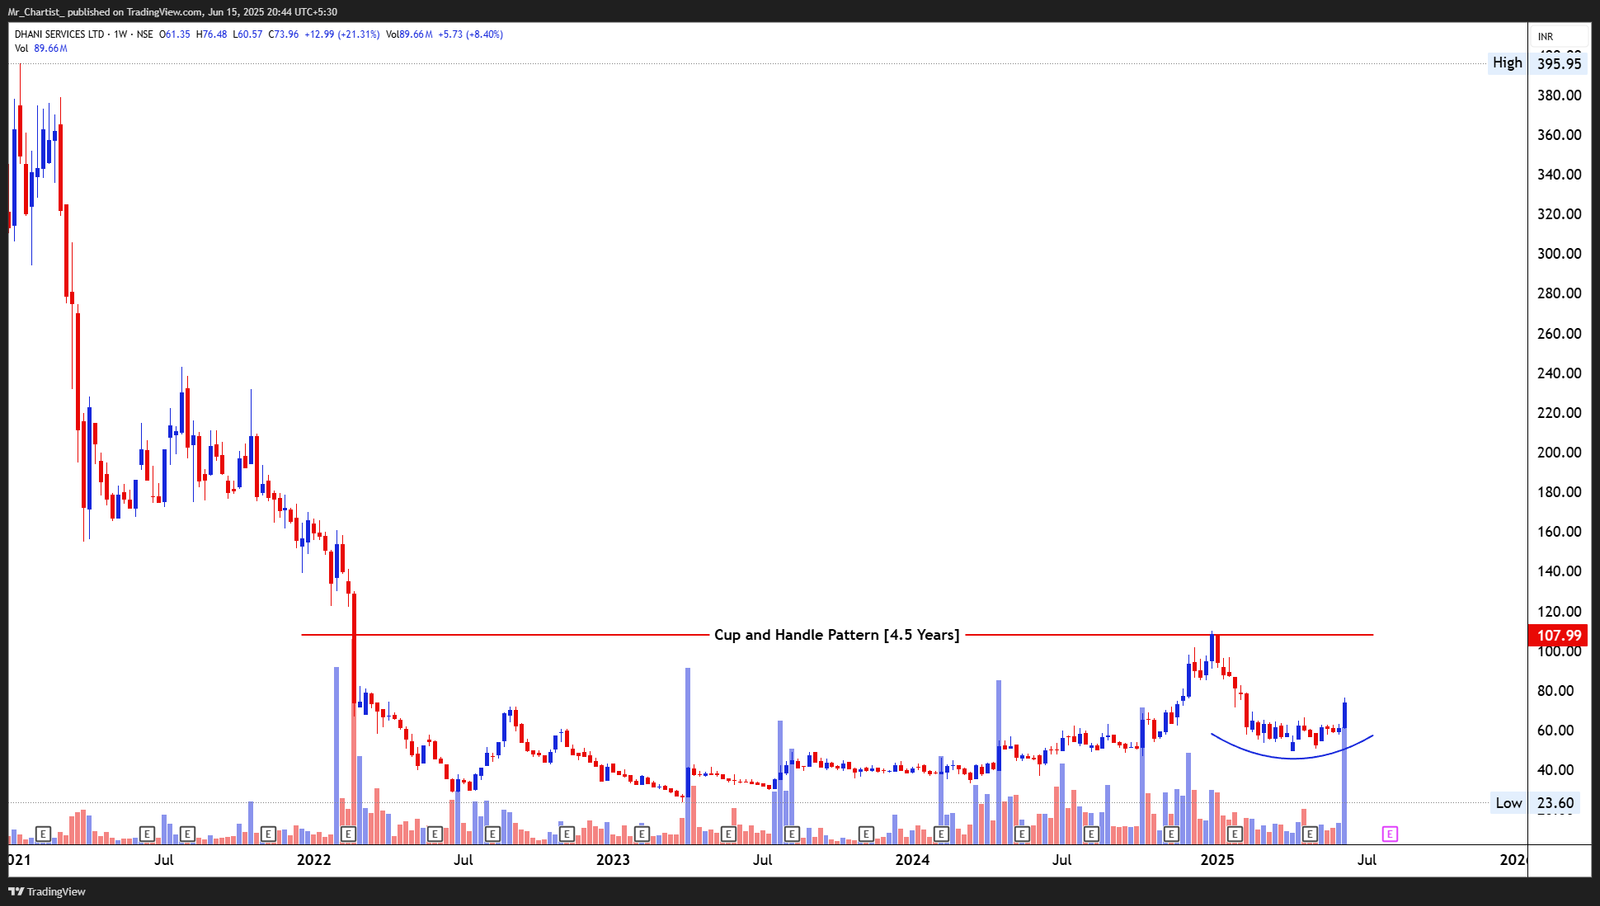
DHANI SERVICES LTD
bearish fnoDouble Bottom Breakout
Cup and Handle Pattern [4.5 Years]
Thesis & Analysis
Price Action Overview: Dhani Services is forming a long-term Cup and Handle pattern, developing over 4.5 years— a rare and powerful base. The stock has built a broad rounding bottom from the 2021 decline, with the handle portion unfolding over the last 5–6 months. Today’s price action—up 21%—marks a strong bullish move approaching the neckline resistance around ₹108. The bullish engulfing nature of the weekly candle confirms strong buying pressure after weeks of sideways accumulation. Candlestick Behavior: The current breakout attempt is backed by a wide-range bullish candle with almost no upper wick, indicating strong momentum and aggressive buyer intent. The candle emerges from the handle base, enhancing its technical credibility. Volume Analysis: Volume surged dramatically this week, clocking the highest in over 2 years, reinforcing the strength of accumulation. This surge confirms institutional participation and increases the breakout reliability should price close above ₹108. 2. Crucial Support and Resistance Levels Support Levels: ₹65: Recent base and handle low. ₹52: Previous demand cluster and key psychological level. ₹40: Long-term support and structural pivot from 2023 lows. Resistance Levels: ₹108: Long-standing neckline; a breakout here would confirm the 4.5-year pattern. ₹130: Measured move resistance zone. ₹160–₹180: Long-term recovery targets if sustained momentum follows. 3. Strategic Trade Scenarios Bullish Scenario (Bias View) 🚀 A weekly close above ₹108 would officially confirm the cup and handle breakout. With volume backing the move, the price could potentially head toward ₹130 in the short term and ₹160+ in the medium term. Continued higher closes will likely attract momentum investors. Pullback Scenario 🔄 If the price fails to breach ₹108 immediately, a retest of ₹65–₹70 handle support may occur. As long as the handle structure holds, the broader pattern remains valid. A close below ₹52 would invalidate the bullish setup and suggest a return to prolonged base- building.
Price Action
- ■Price action is structurally positive.
- ■Forming higher highs and higher lows.
Volume Profile
- ■Volume is supportive of the price action.
- ■Wait for volume expansion on breakout.
Key Levels
No zones specified
No zones specified
Invalidation Scenario
A weekly close below the support level invalidates this structure.
FREDUN PHARMACEUTICALS LTD
bearish fnoDouble Bottom Breakout
Daily Chart
Thesis & Analysis
No detailed thesis provided for this setup.
Price Action
- ■Price action is structurally positive.
- ■Forming higher highs and higher lows.
Volume Profile
- ■Volume is supportive of the price action.
- ■Wait for volume expansion on breakout.
Key Levels
No zones specified
No zones specified
Invalidation Scenario
A weekly close below the support level invalidates this structure.
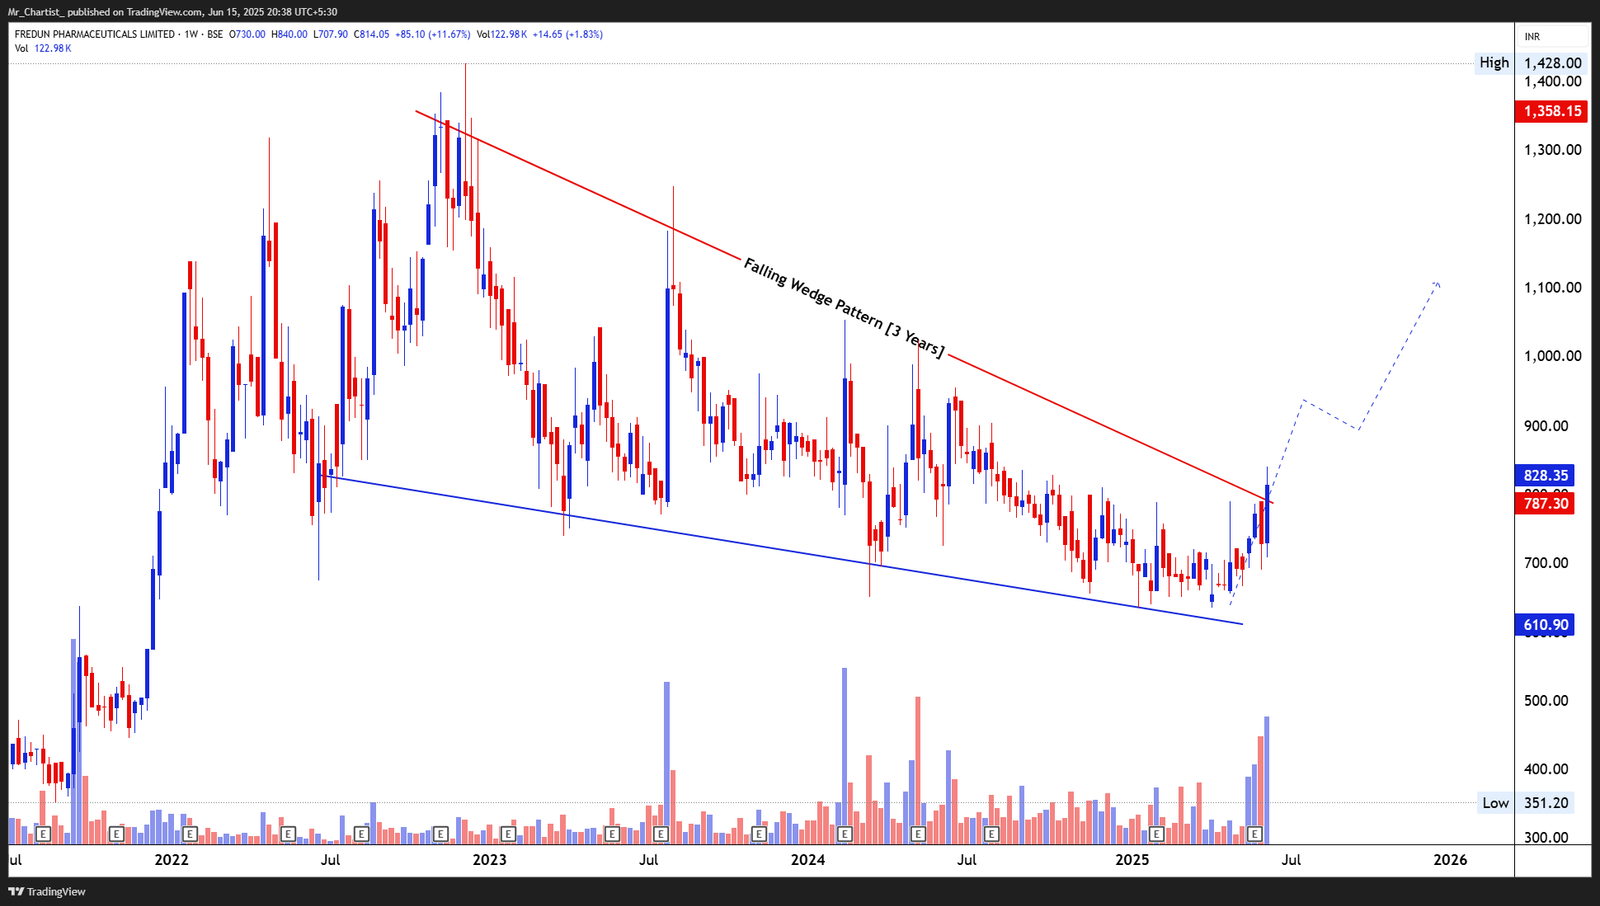
FREDUN PHARMACEUTICALS LTD
bearish fnoDouble Bottom Breakout
Falling Wedge Pattern [3 Years]
Thesis & Analysis
Price Action Overview: Fredun Pharmaceuticals has successfully broken out of a 3-year falling wedge formation —a classic bullish reversal setup. The price was tightly coiling between two converging trendlines from mid-2021 until early June 2025, creating structural compression. Last week’s candle showed a sharp upside thrust through the wedge’s upper resistance line, marking the first breakout in over 36 months. This price surge reflects a shift from long-term seller control to bullish dominance. Candlestick Behavior: The breakout was accompanied by a large-bodied bullish candle with a solid close near the highs—demonstrating conviction. The breakout came after a series of small-bodied candles, indicating a volatility contraction and perfect setup pressure. Volume Analysis: Volume surged to its highest level in over 2 years, strongly validating the breakout. This spike suggests institutional interest and confirms that the breakout is unlikely to be a false move. 2. Crucial Support and Resistance Levels Support Levels: ₹787: Wedge breakout level; must hold for confirmation. ₹700: Minor base area from the wedge's last low. ₹610: Historical horizontal support and wedge floor. Resistance Levels: ₹900: Minor round-number resistance and intermediate target. ₹1,100: Potential breakout projection from the wedge height. ₹1,350+: Multi-year swing high from 2022; extended upside zone. 3. Strategic Trade Scenarios Bullish Scenario (Bias View) 📈 Sustained closes above ₹787 will validate the breakout, with the structure favoring a rally toward ₹900 initially. A measured breakout target lies near ₹1,100, aligning with historical supply. Strength above this could open doors for a retest of the ₹1,350–₹1,400 highs seen during the 2022 bull phase. Pullback Scenario 🔄 In case of a dip, a pullback toward ₹700–₹720 may serve as a healthy retest zone. Any signs of bullish reversal in this zone would reinforce the pattern's integrity. A breakdown below ₹610 would invalidate the long-term wedge and shift the outlook to neutral-to- bearish.
Price Action
- ■Price action is structurally positive.
- ■Forming higher highs and higher lows.
Volume Profile
- ■Volume is supportive of the price action.
- ■Wait for volume expansion on breakout.
Key Levels
No zones specified
No zones specified
Invalidation Scenario
A weekly close below the support level invalidates this structure.
RELIABLE VENTURES INDIA LTD
bearish fnoDouble Bottom Breakout
Daily Chart
Thesis & Analysis
No detailed thesis provided for this setup.
Price Action
- ■Price action is structurally positive.
- ■Forming higher highs and higher lows.
Volume Profile
- ■Volume is supportive of the price action.
- ■Wait for volume expansion on breakout.
Key Levels
No zones specified
No zones specified
Invalidation Scenario
A weekly close below the support level invalidates this structure.
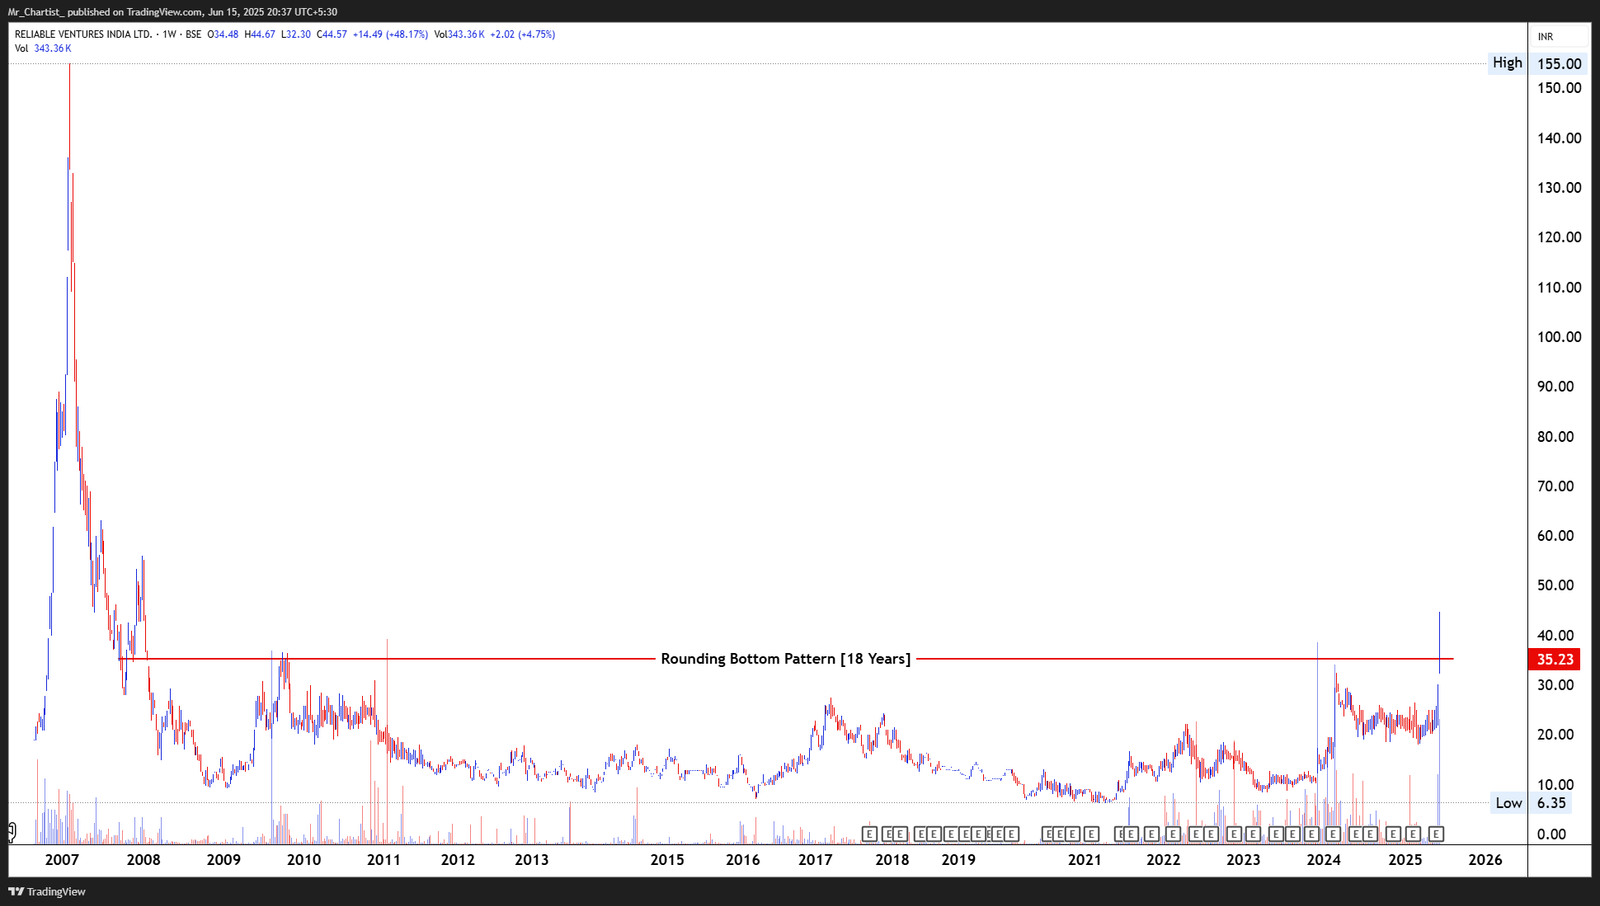
RELIABLE VENTURES INDIA LTD
bearish fnoDouble Bottom Breakout
Rounding Bottom Pattern [18 Years]
Thesis & Analysis
Price Action Overview: Reliable Ventures has completed a multi-decade Rounding Bottom formation, breaking out above the historical resistance level of ₹35.23 for the first time since 2007. This rare, long-term base breakout suggests a major trend reversal after nearly two decades of underperformance and accumulation. The breakout follows a steady base-building process from 2021 to 2025, where the stock traded in a narrow range with gradually rising lows—indicating stealth accumulation. Candlestick Behavior: This week’s breakout was accompanied by a tall bullish candle, closing near its weekly high, suggesting strong buyer intent. The absence of upper wicks highlights price acceptance and aggressive demand post-breakout. Volume Analysis: Volume exploded to multi-year highs—well above the long-term average—confirming the validity of the breakout. This surge indicates institutional or high-conviction participation, which often precedes a structural shift in stock behavior. 2. Crucial Support and Resistance Levels Support Levels: ₹35.23: Long-term breakout level and now a key base support. ₹25: Minor accumulation range from early 2024. ₹17: Historical range support from the 2021–2023 base. Resistance Levels: ₹60–₹65: Nearest logical resistance from mid-2007 swing levels. ₹100+: Long-term psychological and structural zone from the 2006–07 peak. ₹155: All-time high and upper range boundary from IPO era. 3. Strategic Trade Scenarios Bullish Scenario (Bias View) 🚀 With price holding firmly above ₹35.23 and supported by strong volume, Reliable Ventures appears to be entering a multi-phase rally structure. A move toward ₹60–₹65 is likely as the first target, with scope to revisit ₹100+ if momentum sustains. This setup marks a potential long-term reversal from obscurity to visibility. Pullback Scenario 🔁 Any dip back to ₹35.23 could offer a high-probability retest opportunity. As long as price sustains above ₹25, the breakout structure remains intact. A close below ₹25 would negate immediate bullish bias and suggest reversion to the prior base.
Price Action
- ■Price action is structurally positive.
- ■Forming higher highs and higher lows.
Volume Profile
- ■Volume is supportive of the price action.
- ■Wait for volume expansion on breakout.
Key Levels
No zones specified
No zones specified
Invalidation Scenario
A weekly close below the support level invalidates this structure.
NATIONAL FITTINGS LTD
bearish fnoDouble Bottom Breakout
Daily Chart
Thesis & Analysis
No detailed thesis provided for this setup.
Price Action
- ■Price action is structurally positive.
- ■Forming higher highs and higher lows.
Volume Profile
- ■Volume is supportive of the price action.
- ■Wait for volume expansion on breakout.
Key Levels
No zones specified
No zones specified
Invalidation Scenario
A weekly close below the support level invalidates this structure.
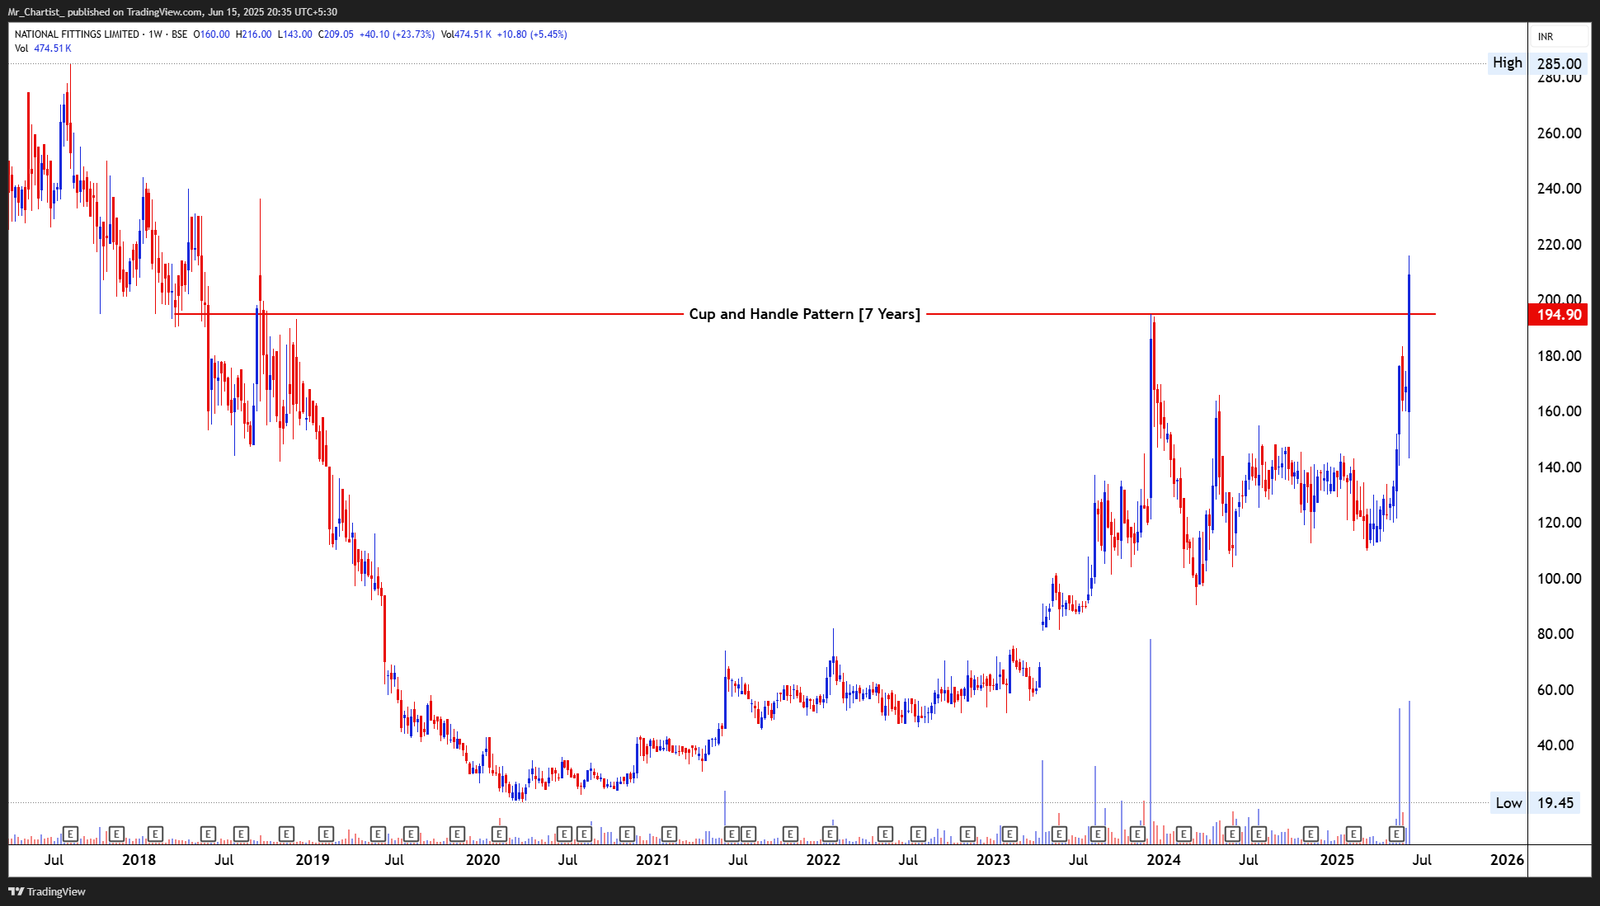
NATIONAL FITTINGS LTD
bearish fnoDouble Bottom Breakout
Cup and Handle Pattern [7 Years]
Thesis & Analysis
Price Action Overview: National Fittings has completed a massive 7-year Cup and Handle formation, breaking out above the long-standing resistance at ₹194.90. This pattern emerged after a prolonged downtrend bottomed in 2020, followed by a sustained accumulation phase through 2022–2024. The current breakout has occurred with a steep, impulsive move through the neckline, reflecting powerful buyer conviction. The handle portion of the pattern—formed over the past 6–8 months—was relatively shallow, suggesting minimal distribution pressure. Candlestick Behavior: The breakout bar was a long bullish candle with a strong close near the high, indicating robust participation. While minor wicks exist, the price held firmly above the breakout level, validating bullish strength. Volume Analysis: Volume surged significantly during the breakout, reaching the highest levels since 2017. The spike marks institutional or large-lot interest and confirms breakout authenticity. Previous volume buildup during the handle also hinted at accumulation. 2. Crucial Support and Resistance Levels Support Levels: ₹194.90: Multi-year neckline; critical level for continuation. ₹160: Handle support zone and consolidation base. ₹125: Mid-range support from the 2023 accumulation. Resistance Levels: ₹240–₹250: Nearest swing supply zone from 2017. ₹285: Historical price pivot from 2016. ₹300+: Round-number zone and potential measured target from the pattern. 3. Strategic Trade Scenarios Bullish Scenario (Bias View) 🚀 A successful breakout above ₹194.90 on strong volume supports a sustained uptrend. If price holds above this level, we may see continued upside toward ₹240 and ₹285 in the near to medium term. The pattern suggests long-term reversal potential. Pullback Scenario 🔁 Any retracement toward ₹194.90 followed by a bullish reversal setup may offer a secondary entry. A breakdown below ₹160 would neutralize the bullish breakout structure and shift bias back to a broader rangebound outlook.
Price Action
- ■Price action is structurally positive.
- ■Forming higher highs and higher lows.
Volume Profile
- ■Volume is supportive of the price action.
- ■Wait for volume expansion on breakout.
Key Levels
No zones specified
No zones specified
Invalidation Scenario
A weekly close below the support level invalidates this structure.
INFOMEDIA PRESS LTD
bearish fnoDouble Bottom Breakout
Daily Chart
Thesis & Analysis
No detailed thesis provided for this setup.
Price Action
- ■Price action is structurally positive.
- ■Forming higher highs and higher lows.
Volume Profile
- ■Volume is supportive of the price action.
- ■Wait for volume expansion on breakout.
Key Levels
No zones specified
No zones specified
Invalidation Scenario
A weekly close below the support level invalidates this structure.
INFOMEDIA PRESS LTD
bearish fnoDouble Bottom Breakout
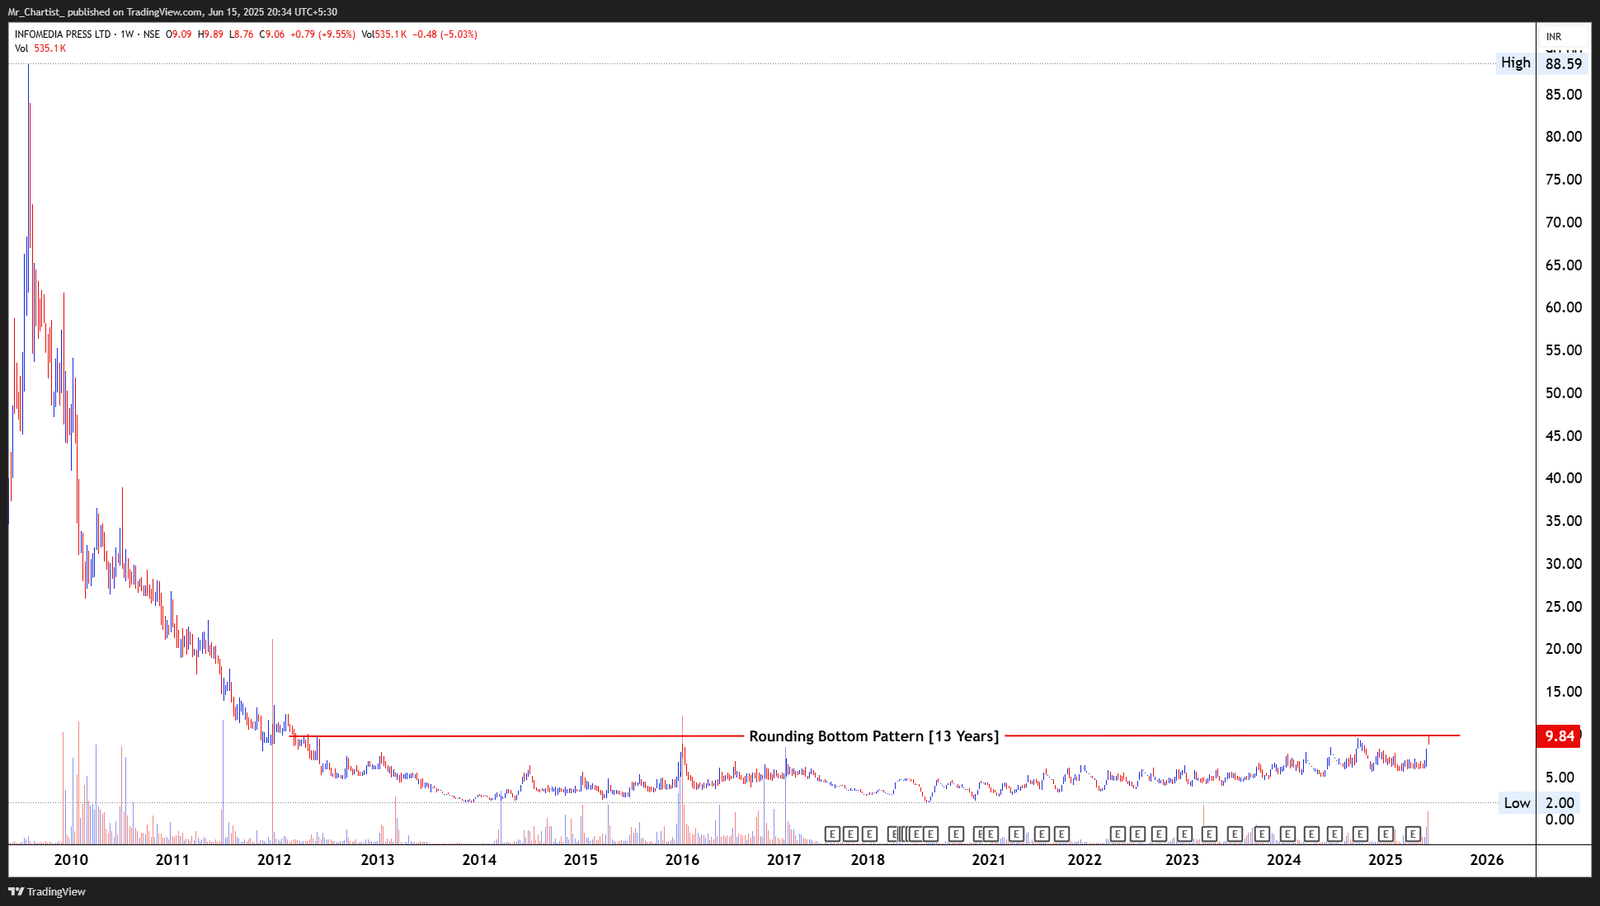
Rounding Bottom Pattern [13 Years]
Thesis & Analysis
Price Action Overview: Infomedia Press is approaching the final resistance zone of a massive 13-year rounding bottom pattern, with the neckline drawn near ₹9.85. Since forming a bottom around ₹2 in 2020, the stock has been inching higher in a well-structured base buildup. The current chart shows increasing tightness in consolidation, indicating reduced volatility and gradual demand absorption near the neckline. Price is now testing the breakout zone, showing subtle signs of a potential long-term reversal. Candlestick Behavior: Recent candles have shown increased body size with diminished upper wicks—implying controlled upside attempts. Today’s move extended above previous local highs, albeit with some rejection—suggesting indecision just below breakout. Volume Analysis: Volume has started expanding meaningfully in recent sessions, hitting multi-year highs. This accumulation zone, accompanied by volume rise, strengthens the probability of a valid breakout attempt in coming weeks. 2. Crucial Support and Resistance Levels Support Levels: ₹7.50: Recent accumulation shelf; minor swing base. ₹5.50: Mid-base support within the long consolidation. ₹2.00: Structural base and historical bottom. Resistance Levels: ₹9.85: Major neckline and breakout point from the 13-year rounding base. ₹12.50: Psychological barrier and possible post-breakout retest zone. ₹18.00–₹20.00: Historical supply zone (2010–2011 range). 3. Strategic Trade Scenarios Bullish Scenario (Bias View) 🚀 A weekly close above ₹9.85 with volume expansion would trigger the breakout from a generational base. Such a breakout could unlock a significant trend shift, potentially propelling price toward ₹12.50 and ₹18+ over time. Pullback Scenario 🔁 If price fails to break above ₹9.85 and retreats, watch for support at ₹7.50. A bounce from that zone with renewed volume could offer a re-entry opportunity. Breakdown below ₹5.50 would delay breakout structure and shift bias to prolonged consolidation.
Price Action
- ■Price action is structurally positive.
- ■Forming higher highs and higher lows.
Volume Profile
- ■Volume is supportive of the price action.
- ■Wait for volume expansion on breakout.
Key Levels
No zones specified
No zones specified
Invalidation Scenario
A weekly close below the support level invalidates this structure.
ZODIAC-JRD-MKJ LTD
bearish fnoDouble Bottom Breakout
Daily Chart
Thesis & Analysis
No detailed thesis provided for this setup.
Price Action
- ■Price action is structurally positive.
- ■Forming higher highs and higher lows.
Volume Profile
- ■Volume is supportive of the price action.
- ■Wait for volume expansion on breakout.
Key Levels
No zones specified
No zones specified
Invalidation Scenario
A weekly close below the support level invalidates this structure.
ZODIAC-JRD-MKJ LTD
bearish fnoDouble Bottom Breakout
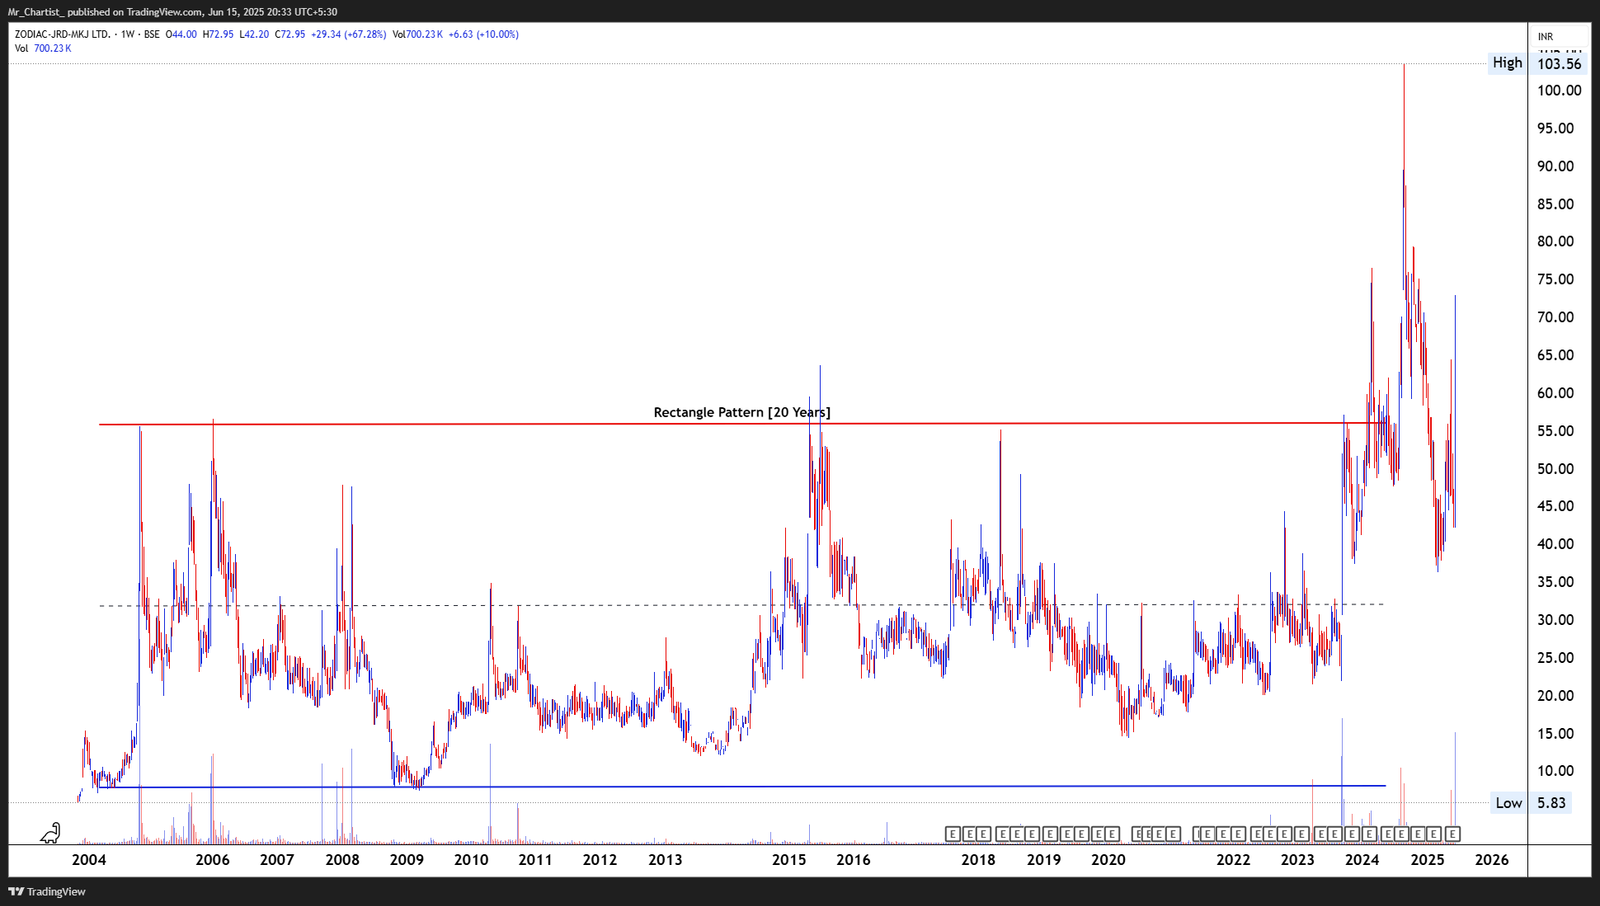
Rectangle Pattern [20 Years]
Thesis & Analysis
Price Action Overview: Zodiac-JRD-MKJ has been locked within a classic rectangle range for nearly two decades, with the upper boundary near ₹61–₹63 and strong base support around ₹12– ₹14. The stock recently registered a decisive breakout above the 20-year horizontal resistance, marking a generational structural shift. The price action has seen volatility compression and base tightening over the past few years. The latest surge saw a breakout move, followed by some volatility, but the structure remains firm above the key neckline. Candlestick Behavior: The breakout was accompanied by wide-range bullish candles with strong closes, despite minor upper shadows. This suggests buying strength amid volatility. Recent candles are showing stabilizing behavior near ₹60+, reinforcing support confirmation. Volume Analysis: Volume surged dramatically at the time of breakout—among the highest in years— clearly reflecting long-term accumulation. Sustained volume activity after the breakout keeps the bullish bias intact and reduces the odds of a false move. 2. Crucial Support and Resistance Levels Support Levels: ₹61: Long-term breakout zone; immediate structural support. ₹45: Recent swing low, now an interim demand zone. ₹30–₹35: Mid-rectangle equilibrium zone with historical accumulation. Resistance Levels: ₹85: Recent swing high from post-breakout spike. ₹103–₹105: 2024 high and multi-decade peak. ₹120+: Blue-sky territory with no visible supply; historical price vacuum. 3. Strategic Trade Scenarios Bullish Scenario (Bias View) 🚀 As long as the price holds above ₹61, the breakout from the 20-year rectangle remains valid. If momentum sustains, a revisit toward ₹85 and ₹100+ is likely. Follow-through buying above ₹85 could initiate a powerful price discovery phase targeting ₹120+ over time. Pullback Scenario 🔁 A pullback to ₹61 that holds on lower volume may offer an ideal retest zone. A close below ₹45 would increase caution and shift the structure toward neutral, possibly retesting the ₹30–₹35 zone.
Price Action
- ■Price action is structurally positive.
- ■Forming higher highs and higher lows.
Volume Profile
- ■Volume is supportive of the price action.
- ■Wait for volume expansion on breakout.
Key Levels
No zones specified
No zones specified
Invalidation Scenario
A weekly close below the support level invalidates this structure.
SIGACHI INDUSTRIES LTD
bearish fnoDouble Bottom Breakout
Daily Chart
Thesis & Analysis
No detailed thesis provided for this setup.
Price Action
- ■Price action is structurally positive.
- ■Forming higher highs and higher lows.
Volume Profile
- ■Volume is supportive of the price action.
- ■Wait for volume expansion on breakout.
Key Levels
No zones specified
No zones specified
Invalidation Scenario
A weekly close below the support level invalidates this structure.
SIGACHI INDUSTRIES LTD
bearish fnoDouble Bottom Breakout
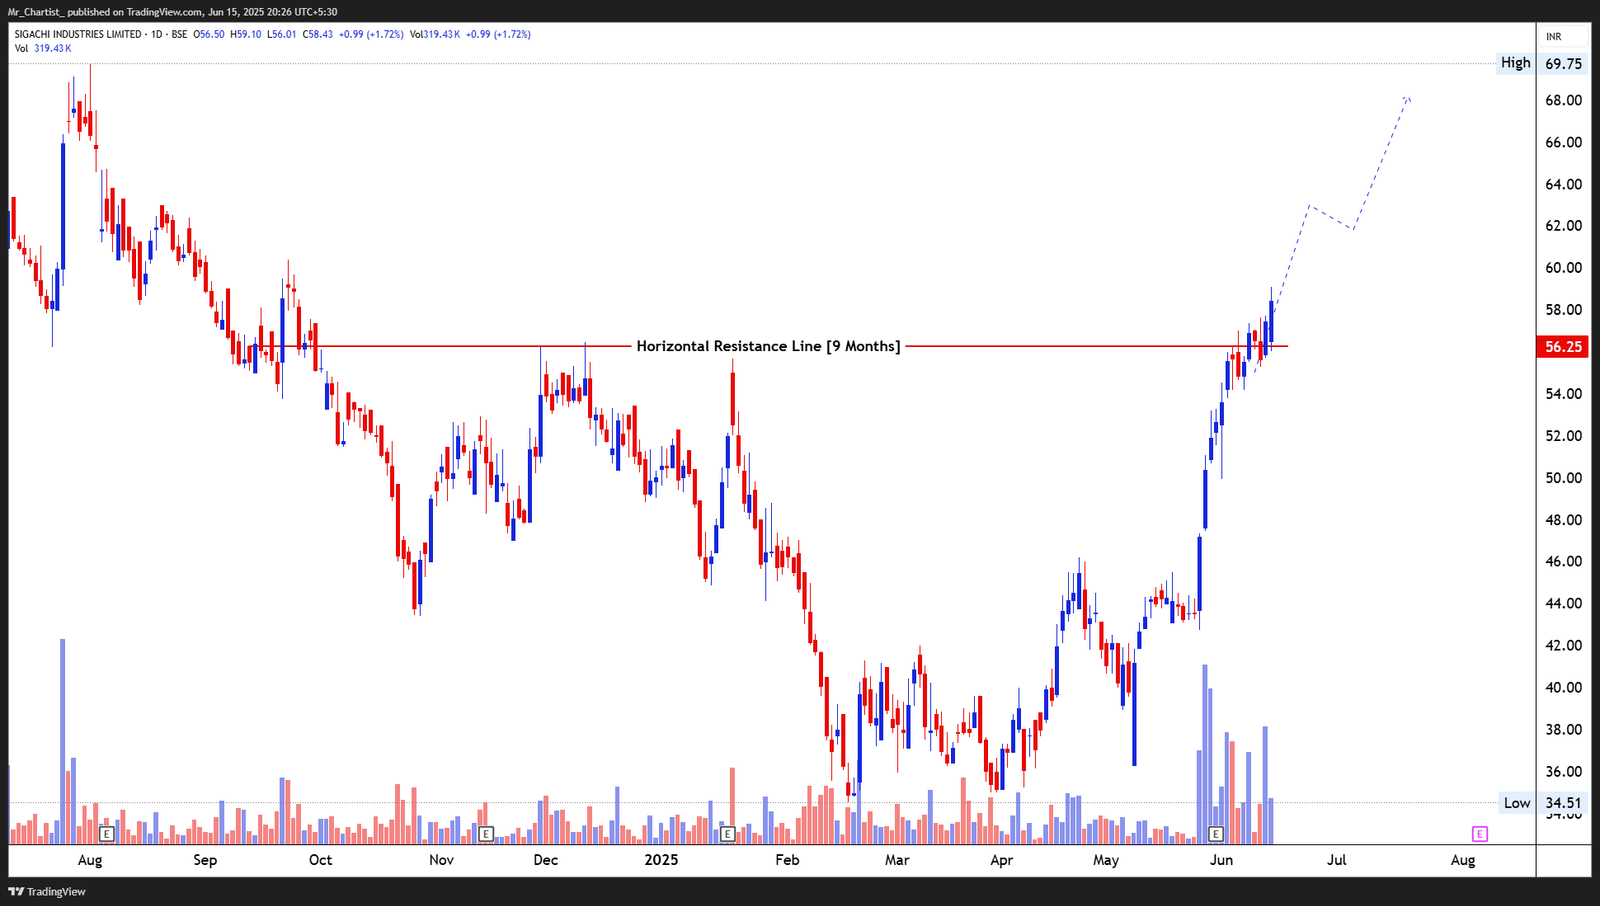
Horizontal Resistance Breakout [9 Months]
Thesis & Analysis
📈 Price Action Overview: Sigachi Industries has completed a strong breakout above a horizontal resistance at ₹56.25, a level that had repeatedly capped price advances since Q3 2024. The breakout follows a sharp rally from ₹36 levels in May, indicating powerful trend reversal momentum. This structural shift is supported by a clean sequence of higher highs and higher lows, building pressure below resistance before the final breakout. The price action is now holding firm above the breakout zone, suggesting trend continuation. 🕯 Candlestick Behavior: The breakout was led by multiple long-bodied bullish candles, some with mild wicks but mostly signaling strong close-to-high finishes. The breakout zone is showing candle- based acceptance, highlighting buyer interest at retest zones.
Price Action
- ■Price action is structurally positive.
- ■Forming higher highs and higher lows.
Volume Profile
- ■Volume rose sharply in the days leading to the breakout, with multiple high-volume
- ■sessions confirming demand strength. Notably, the volume dried slightly post-breakout
- ■—typical of a cooling phase before continuation.
- ■2. Crucial Support and Resistance Levels
- ■Support Levels:
- ■₹56.25: Key breakout level now turned into primary support.
- ■₹50: Psychological and technical mid-rally cushion.
- ■₹45: Swing base of the recent impulse leg.
- ■Resistance Levels:
- ■₹65.00: Immediate zone derived from the short-term price projection.
- ■₹69.75: Post-breakout high and momentum extension mark.
- ■₹75+: Potential measured move target based on the prior range height.
- ■3. Strategic Trade Scenarios
- ■📈 Bullish Scenario (Bias View)
- ■As long as the price holds above ₹56.25 with supportive volume, the breakout setup
- ■remains intact. A strong follow-through above ₹60 could reignite momentum toward
- ■₹65 and then ₹69.75. Sustained closing strength in the upper band of the current range
- ■would confirm bullish trend continuation.
- ■🔄 Pullback Scenario
- ■A retest of ₹56.25 on declining volume could offer a low-risk entry zone for
- ■continuation traders. A breakdown below ₹50 would weaken the momentum structure
- ■and shift the price back into the former consolidation zone.
Key Levels
No zones specified
No zones specified
Invalidation Scenario
A weekly close below the support level invalidates this structure.
RAJ OIL MILLS LTD
bearish fnoDouble Bottom Breakout
Daily Chart
Thesis & Analysis
No detailed thesis provided for this setup.
Price Action
- ■Price action is structurally positive.
- ■Forming higher highs and higher lows.
Volume Profile
- ■Volume is supportive of the price action.
- ■Wait for volume expansion on breakout.
Key Levels
No zones specified
No zones specified
Invalidation Scenario
A weekly close below the support level invalidates this structure.
RAJ OIL MILLS LTD
bearish fnoDouble Bottom Breakout
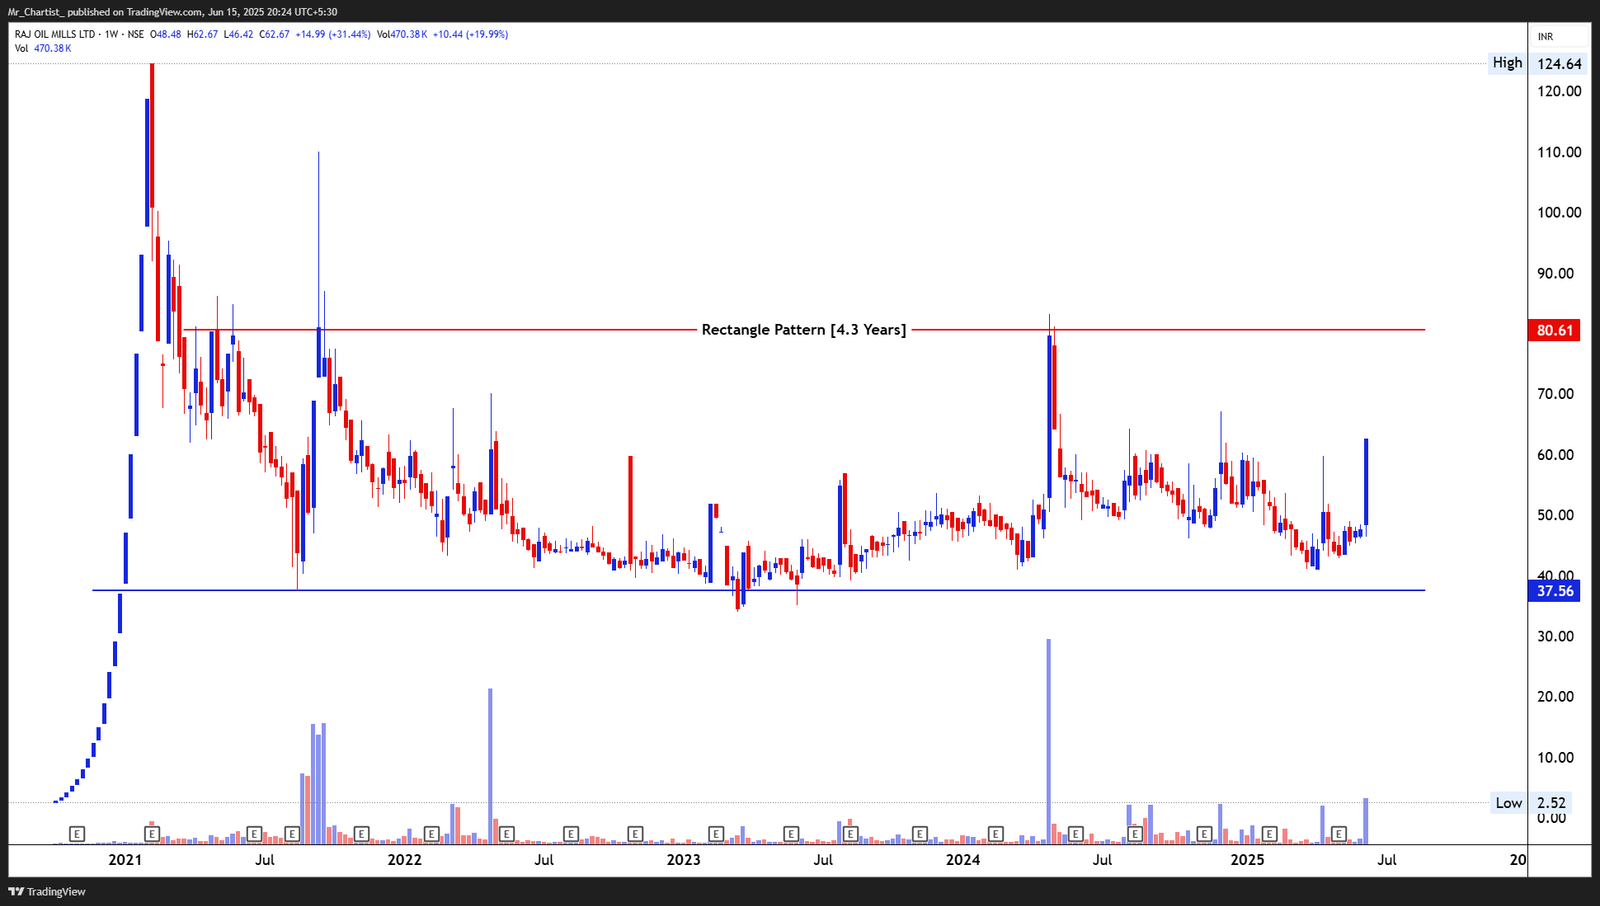
Rectangle Pattern [4.3 Years]
Thesis & Analysis
📈 Price Action Overview: Raj Oil Mills has been oscillating within a broad rectangle pattern between ₹37.50 (support) and ₹80.60 (resistance) for over four years. The latest weekly candle shows a sharp bullish surge from the lower band toward the midpoint of the range —indicating revived demand and possibly the start of a breakout attempt. The sudden price thrust follows a prolonged base, with volatility contraction now giving way to range expansion. This is often a precursor to larger moves, especially after such long-term coil setups. 🕯 Candlestick Behavior: This week’s candle is a powerful bullish marubozu—strong body, minimal wicks— indicating conviction and urgency from buyers. It’s one of the most dominant candles seen since 2021.
Price Action
- ■Price action is structurally positive.
- ■Forming higher highs and higher lows.
Volume Profile
- ■Volume has spiked significantly, clocking the highest levels in many months. This
- ■confirms institutional interest and adds strength to the ongoing breakout attempt.
- ■Prior rallies lacked such volume depth, making this one technically noteworthy.
- ■2. Crucial Support and Resistance Levels
- ■Support Levels:
- ■₹50.00: Minor intermediate pivot that may act as a re-entry zone on
- ■retracement.
- ■₹37.50: Long-term rectangle support; extremely crucial for structural validity.
- ■Resistance Levels:
- ■₹80.60: Long-standing rectangle resistance; breakout level.
- ■₹100+: Post-breakout psychological and historic congestion zone.
- ■3. Strategic Trade Scenarios
- ■📈 Bullish Scenario (Bias View)
- ■If momentum sustains and price approaches ₹80.60 with another volume burst, a
- ■breakout from this 4.3-year range could be triggered. Closing above ₹81 would
- ■project a move toward ₹100–₹105, with longer-term potential for retesting the
- ■2021 highs.
- ■🔄 Pullback Scenario
- ■A dip back to ₹50–₹55 with low volume could provide a healthy reversion zone
- ■before another leg higher. A fall below ₹37.50 would invalidate the rectangle and
- ■imply structural weakness.
Key Levels
No zones specified
No zones specified
Invalidation Scenario
A weekly close below the support level invalidates this structure.
YAARI DIGI INT SER LTD
bearish fnoDouble Bottom Breakout
Daily Chart
Thesis & Analysis
No detailed thesis provided for this setup.
Price Action
- ■Price action is structurally positive.
- ■Forming higher highs and higher lows.
Volume Profile
- ■Volume is supportive of the price action.
- ■Wait for volume expansion on breakout.
Key Levels
No zones specified
No zones specified
Invalidation Scenario
A weekly close below the support level invalidates this structure.
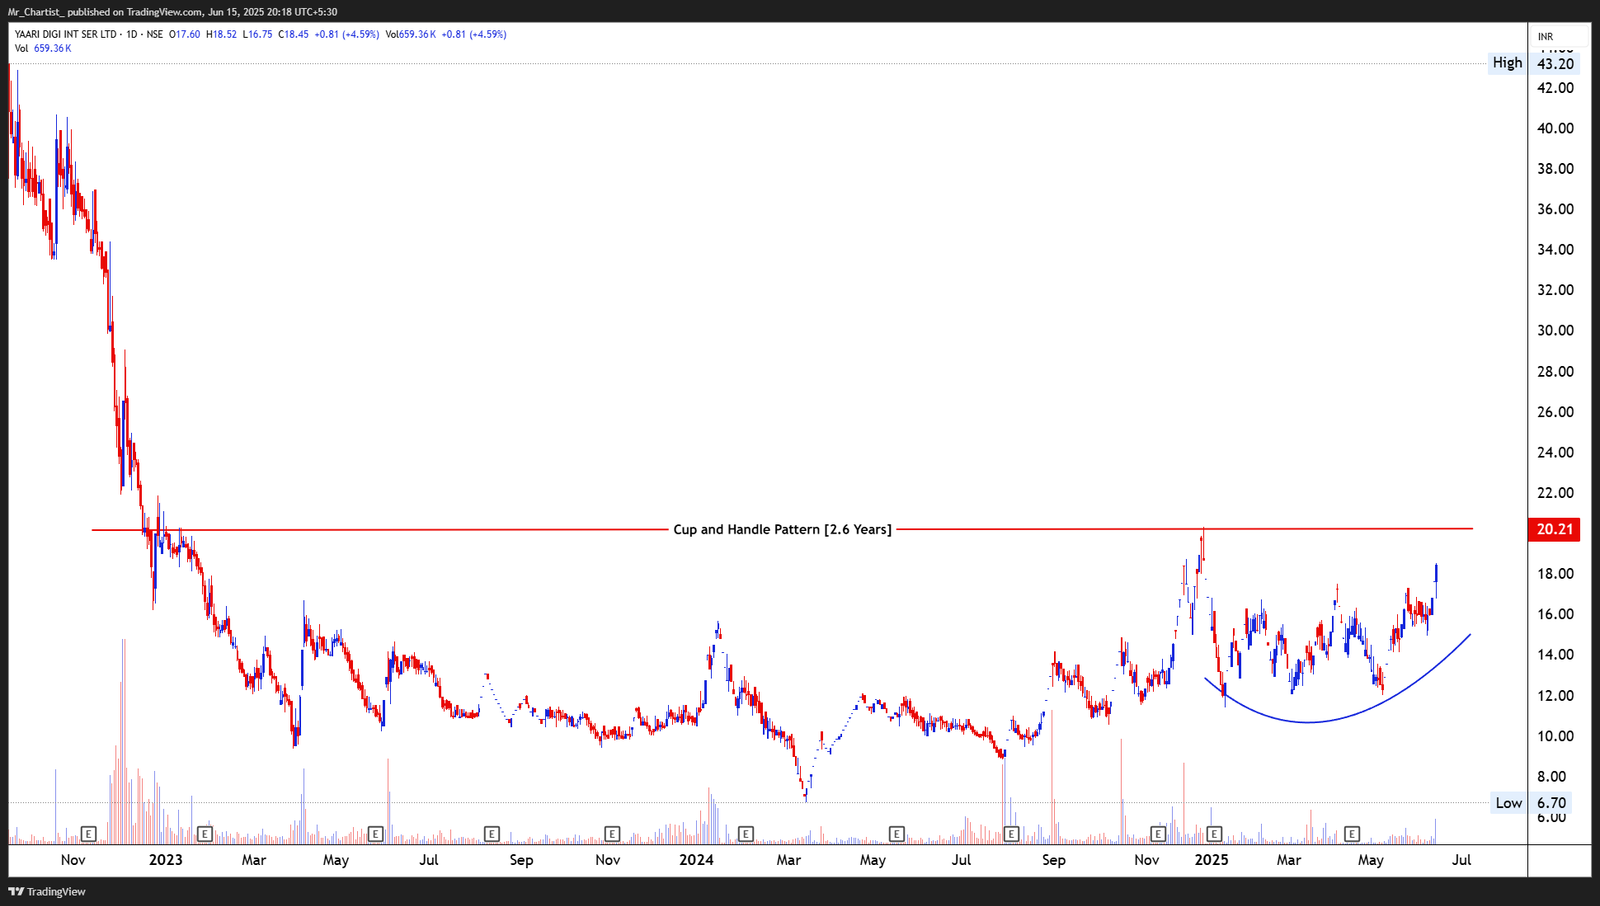
YAARI DIGI INT SER LTD
bearish fnoDouble Bottom Breakout
Cup and Handle Pattern [2.6 Years]
Thesis & Analysis
📈 Price Action Overview: Yaari has been building a long-term bottoming base through a classic Cup and Handle formation, taking shape over nearly 2.6 years. The rounded base began after a prolonged downtrend and has shown consistent higher lows since early 2024. The neckline at ₹20.20 has repeatedly acted as resistance, making it a critical breakout zone. The recent price action is forming the right side of the handle with increasing tightness —hinting at compression before a potential breakout. The overall setup reflects a matured accumulation structure nearing completion. 🕯 Candlestick Behavior: Recent candles show orderly upward movement, with clean bullish bodies and shorter upper wicks—suggesting steady buyer interest. The current approach toward the neckline is happening with strong-bodied candles.
Price Action
- ■Price action is structurally positive.
- ■Forming higher highs and higher lows.
Volume Profile
- ■Volume has gradually risen over the last few weeks, especially during bullish swings.
- ■This volume pickup during the handle portion supports the bullish bias and indicates
- ■possible institutional preparation ahead of breakout.
- ■2. Crucial Support and Resistance Levels
- ■Support Levels:
- ■₹16.00: Short-term handle base; important for immediate trend strength.
- ■₹13.50: Key higher low; foundation of handle support.
- ■₹10.50: Base of the broader cup; long-term must-hold level.
- ■Resistance Levels:
- ■₹20.20: Horizontal neckline of the Cup & Handle; breakout confirmation needed.
- ■₹25.00+: First extension zone post-breakout.
- ■₹30.00: Round-number psychological level from historical price memory.
- ■3. Strategic Trade Scenarios
- ■📈 Bullish Scenario (Bias View)
- ■If the price closes above ₹20.20 on rising volume, it would validate the breakout from
- ■the 2.6-year Cup & Handle. The measured move could project toward ₹25.00 in the near
- ■term, with potential extension to ₹30.00+. Strength above ₹20.20 would confirm
- ■breakout momentum and broader trend reversal.
- ■🔄 Pullback Scenario
- ■In case of minor rejection near ₹20.20, a pullback to ₹16.00–₹17.00 could offer a better
- ■risk-reward entry on confirmation of support. Breakdown below ₹13.50 would damage
- ■the handle’s integrity and postpone breakout prospects.
Key Levels
No zones specified
No zones specified
Invalidation Scenario
A weekly close below the support level invalidates this structure.
VARIMAN GLOBAL ENTERPRISES LTD
bearish fnoDouble Bottom Breakout
Daily Chart
Thesis & Analysis
No detailed thesis provided for this setup.
Price Action
- ■Price action is structurally positive.
- ■Forming higher highs and higher lows.
Volume Profile
- ■Volume is supportive of the price action.
- ■Wait for volume expansion on breakout.
Key Levels
No zones specified
No zones specified
Invalidation Scenario
A weekly close below the support level invalidates this structure.
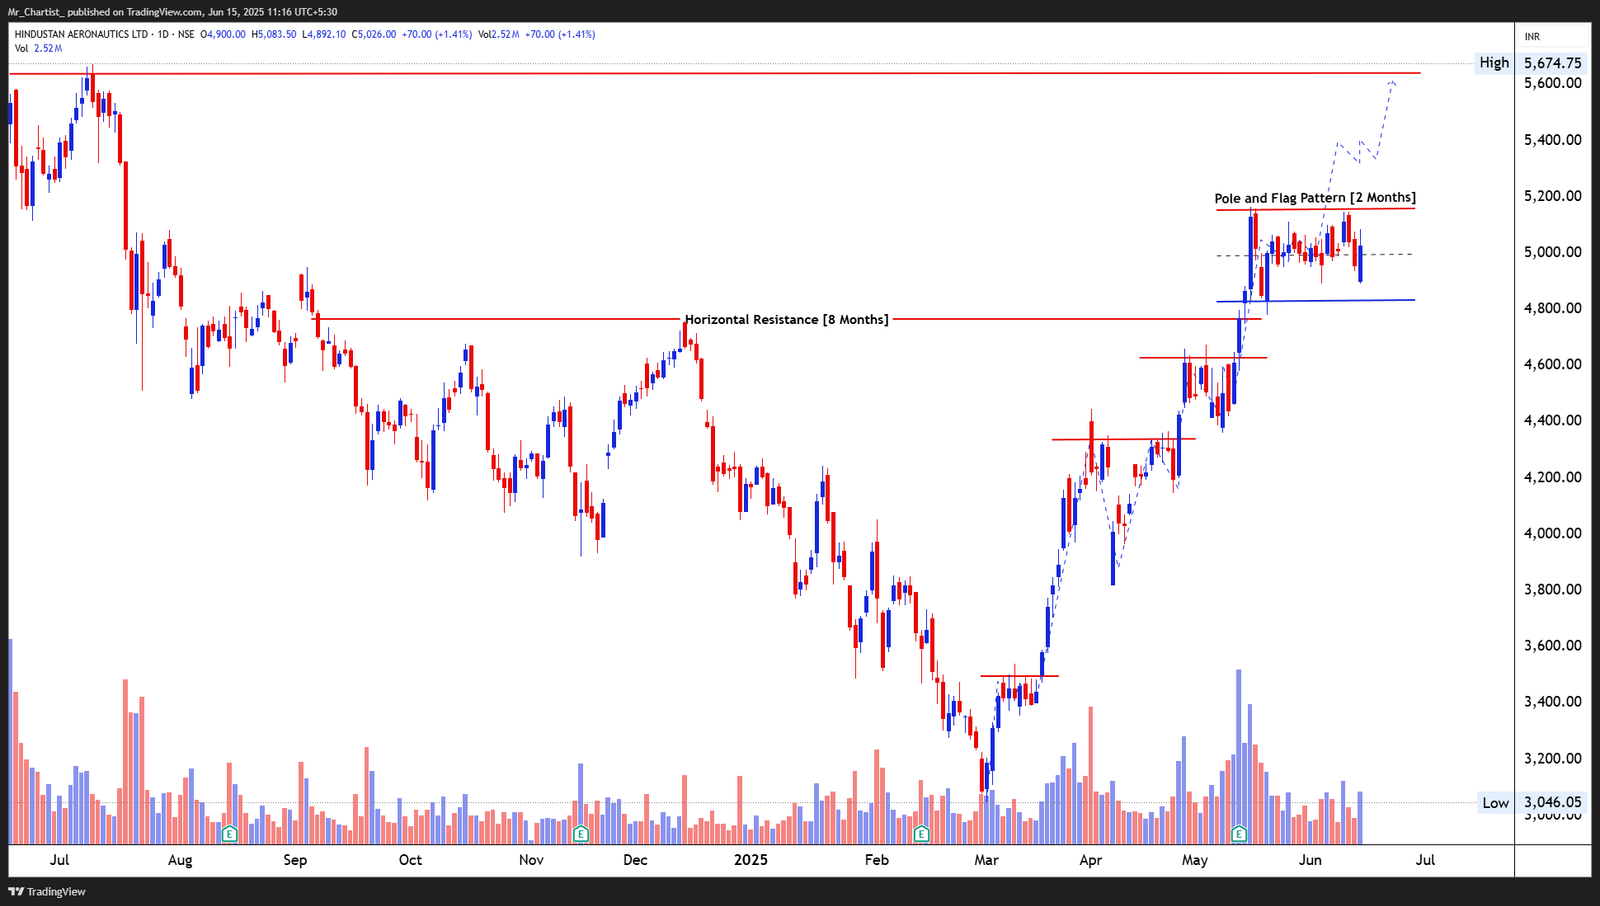
VARIMAN GLOBAL ENTERPRISES LTD
bearish fnoDouble Bottom Breakout
Descending Channel Pattern [1.2 Years]
Thesis & Analysis
📉 Price Action Overview: Variman Global had been trapped in a well-defined descending channel for over a year, with consistent lower highs and lower lows forming within the red-blue trendlines. The recent breakout above the upper boundary of the channel marks a significant technical shift and hints at a trend reversal from long-term downtrend to potential accumulation breakout. The price broke out from the upper resistance band with a steep vertical move, indicating momentum-driven strength rarely seen in such penny stocks. This shift is supported by a series of bullish candles with minor intraday retracements. 🕯 Candlestick Behavior: The recent candles show sustained upward pressure with increasing body length and minimal upper wicks—suggesting strong follow-through buying. Today’s close above the trendline adds technical weight to the breakout.
Price Action
- ■Price action is structurally positive.
- ■Forming higher highs and higher lows.
Volume Profile
- ■Volume has surged sharply in tandem with the breakout, validating the upward thrust.
- ■Prior to the breakout, volume was muted—indicating a stealth accumulation phase now
- ■transitioning into public participation.
- ■2. Crucial Support and Resistance Levels
- ■Support Levels:
- ■₹12.00: Breakout retest level—key pivot from the descending channel.
- ■₹10.20: Short-term swing base during last consolidation.
- ■₹8.00: Final support near historical volume cluster and previous bounce zones.
- ■Resistance Levels:
- ■₹15.50–₹16.00: Minor resistance from October 2023 high within the channel.
- ■₹18.50+: Extension target based on channel width.
- ■₹22.00: Psychological mark and prior supply zone.
- ■3. Strategic Trade Scenarios
- ■🚀 Bullish Scenario (Bias View)
- ■If price sustains above ₹12.00 with volume holding above average, it confirms the
- ■descending channel breakout. Short-term momentum could carry the stock toward
- ■₹15.50–₹16.00, with room to expand toward ₹18.50+. The overall breakout context
- ■supports medium-term trend continuation.
- ■🔁 Pullback Scenario
- ■In case of a retest, price may revisit ₹12.00. Holding this zone with bullish price action
- ■(hammer or inside bar) may present a continuation setup. Failure to hold ₹10.20 would
- ■weaken momentum and suggest possible re-entry into the previous range.
Key Levels
No zones specified
No zones specified
Invalidation Scenario
A weekly close below the support level invalidates this structure.
Charts to Watch
Setups forming favorable structures
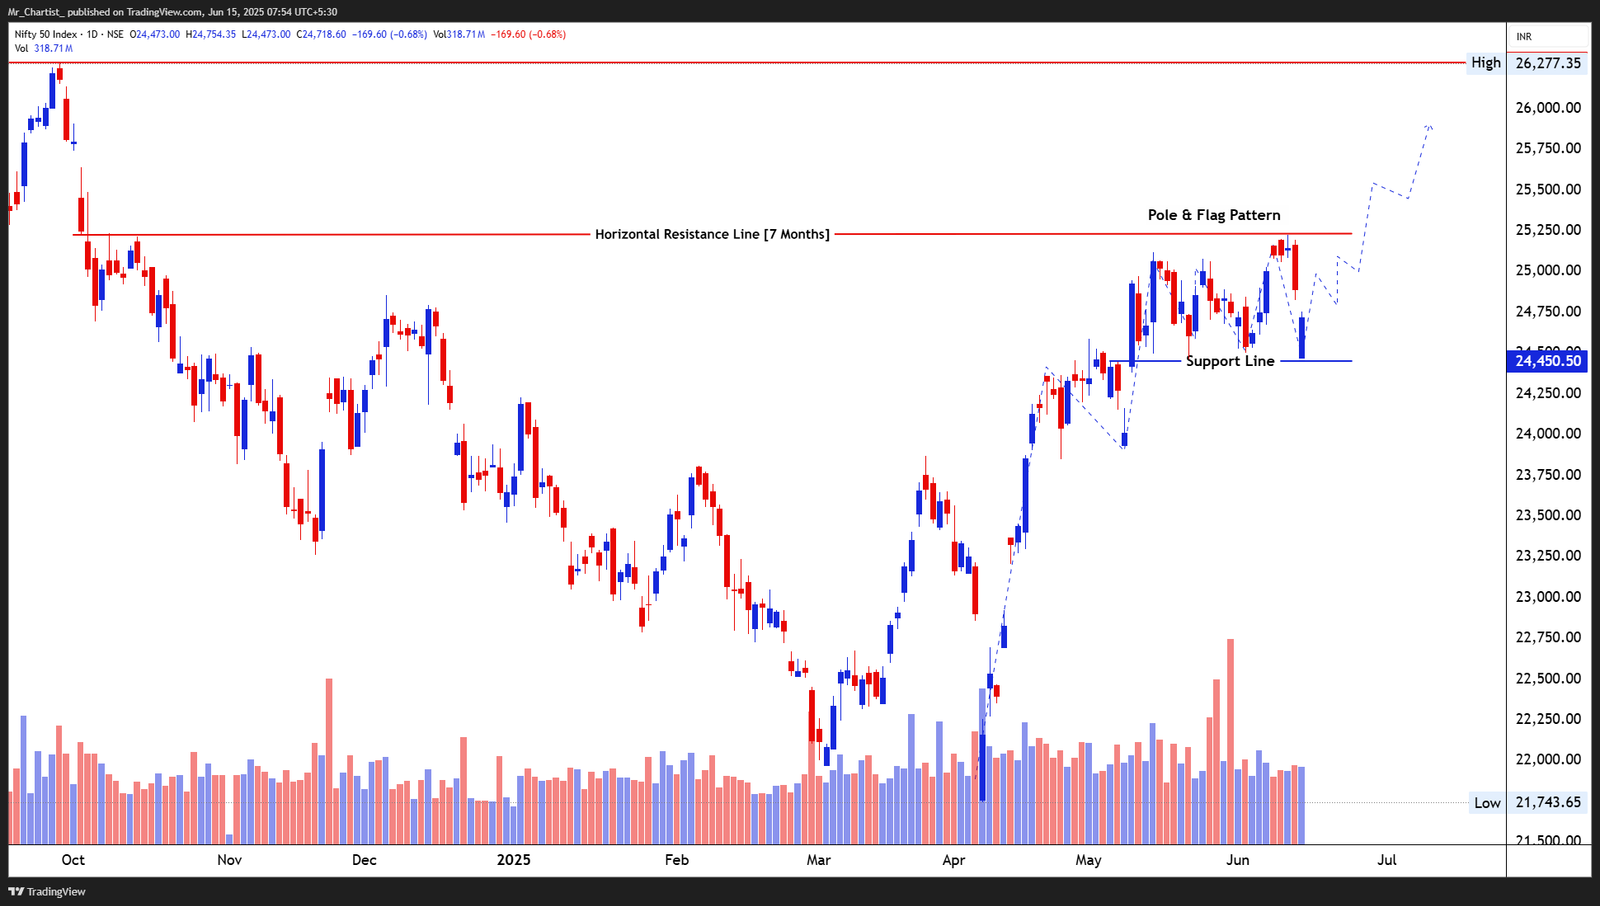
Nifty 50 Index
charts to-watchDouble Bottom Breakout
Daily Chart
Thesis & Analysis
No detailed thesis provided for this setup.
Price Action
- ■Price action is structurally positive.
- ■Forming higher highs and higher lows.
Volume Profile
- ■Volume is supportive of the price action.
- ■Wait for volume expansion on breakout.
Key Levels
No zones specified
No zones specified
Invalidation Scenario
A weekly close below the support level invalidates this structure.
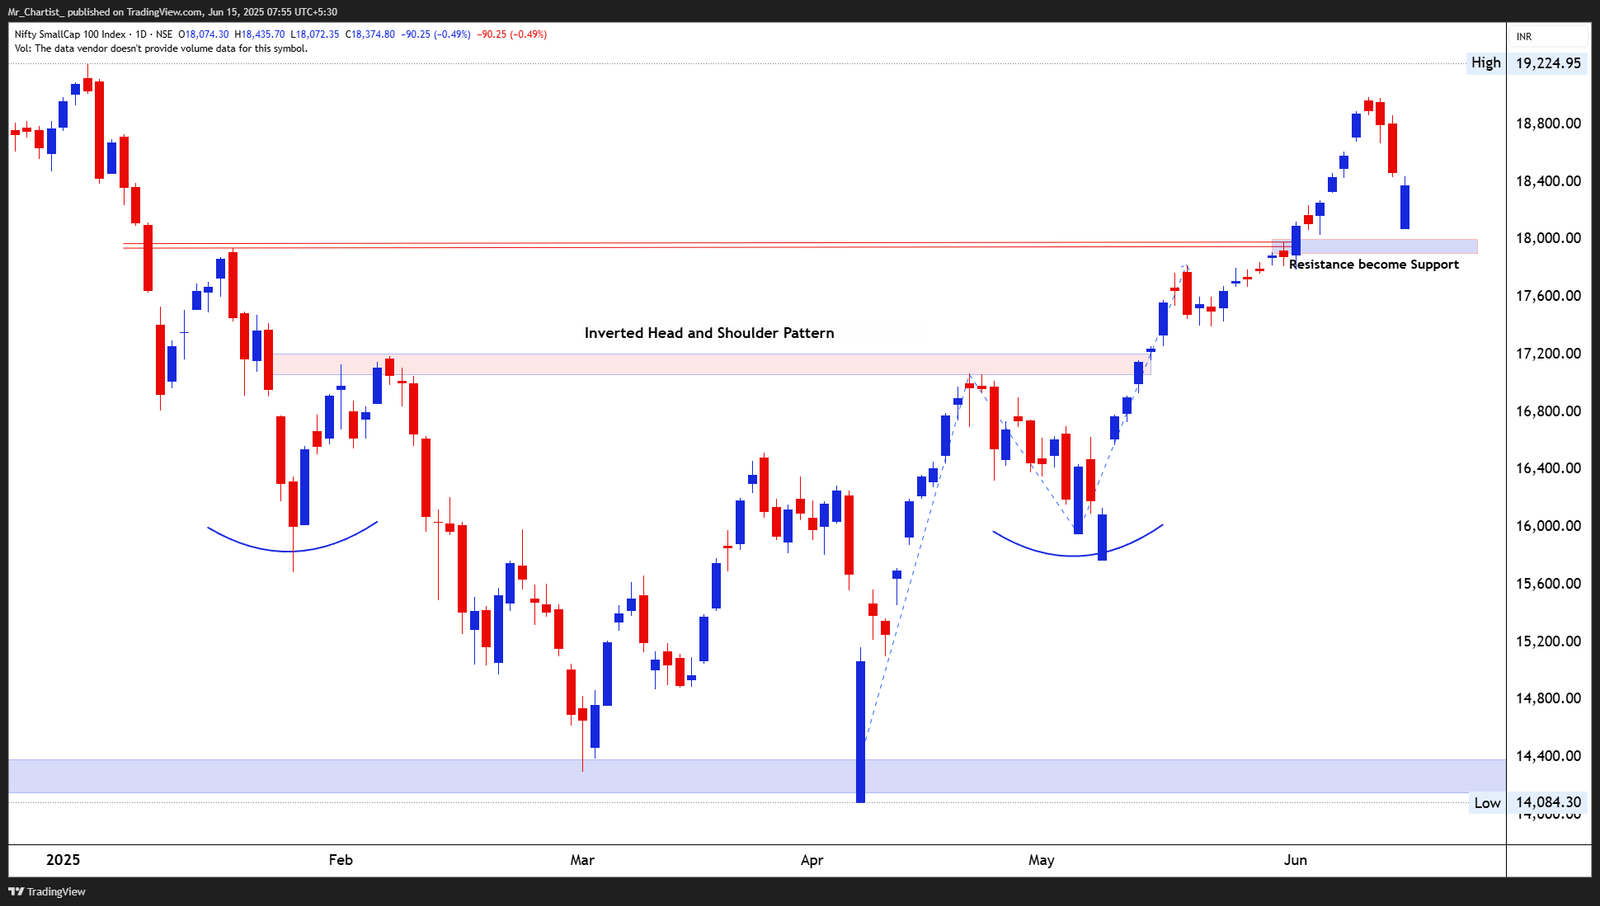
NIFTY 50 INDEX
charts to-watchA clean bullish marubozu formed at the base of the flag—no upper/lower shadow—
~7 Weeks within a broader uptrend
Thesis & Analysis
Price Action Overview: Nifty is currently consolidating inside a flag structure post a sharp pole-like vertical rally. Price has oscillated between ₹25,250 (flag resistance) and ₹24,450 (support), forming a tight rectangular consolidation. This is typical behavior before trend continuation in a flag setup. The most recent candle shows a bullish marubozu, suggesting short-term strength. Importantly, this candle emerged after a pullback to the support zone—indicative of a possible gap-fill attempt toward the upper flag boundary. Candlestick Pattern: A clean bullish marubozu formed at the base of the flag—no upper/lower shadow— signaling momentum revival. Prior candles show a mix of indecision and absorption near support. Volume Analysis: Volume during the recent bullish candle was relatively strong. Volume generally tapers during flag formations and expands on breakout—watch for a volume spike on any move above ₹25,250 for breakout validation. 2. Crucial Support and Resistance Levels Support Levels: ₹24,450: Flag support and recent base formed post sharp rally. ₹24,000: Psychological round-number and minor swing low. ₹23,500: Pre-flag rally base and strong demand zone. Resistance Levels: ₹25,250: Flag resistance – breakout trigger zone. ₹25,775–₹25,800: Measured target zone from flag pole extension. ₹26,275: All-time high; psychological and technical ceiling. 3. Strategic Trade Scenarios 🔹 Bullish Continuation Setup: A decisive breakout above ₹25,250 with increased volume would confirm the flag continuation pattern, opening a move toward the ₹25,775–₹25,800 range, derived from pole height projection. 🔸 Breakdown Scenario: If price breaks below ₹24,450 with volume confirmation, it would invalidate the flag setup and open downside potential toward ₹24,000–₹23,500 support zones.
Price Action
- ■Price action is structurally positive.
- ■Forming higher highs and higher lows.
Volume Profile
- ■Volume is supportive of the price action.
- ■Wait for volume expansion on breakout.
Key Levels
No zones specified
No zones specified
Invalidation Scenario
A weekly close below the support level invalidates this structure.
Nifty SmallCap 100 Index
charts to-watchDouble Bottom Breakout
Daily Chart
Thesis & Analysis
No detailed thesis provided for this setup.
Price Action
- ■Price action is structurally positive.
- ■Forming higher highs and higher lows.
Volume Profile
- ■Volume is supportive of the price action.
- ■Wait for volume expansion on breakout.
Key Levels
No zones specified
No zones specified
Invalidation Scenario
A weekly close below the support level invalidates this structure.
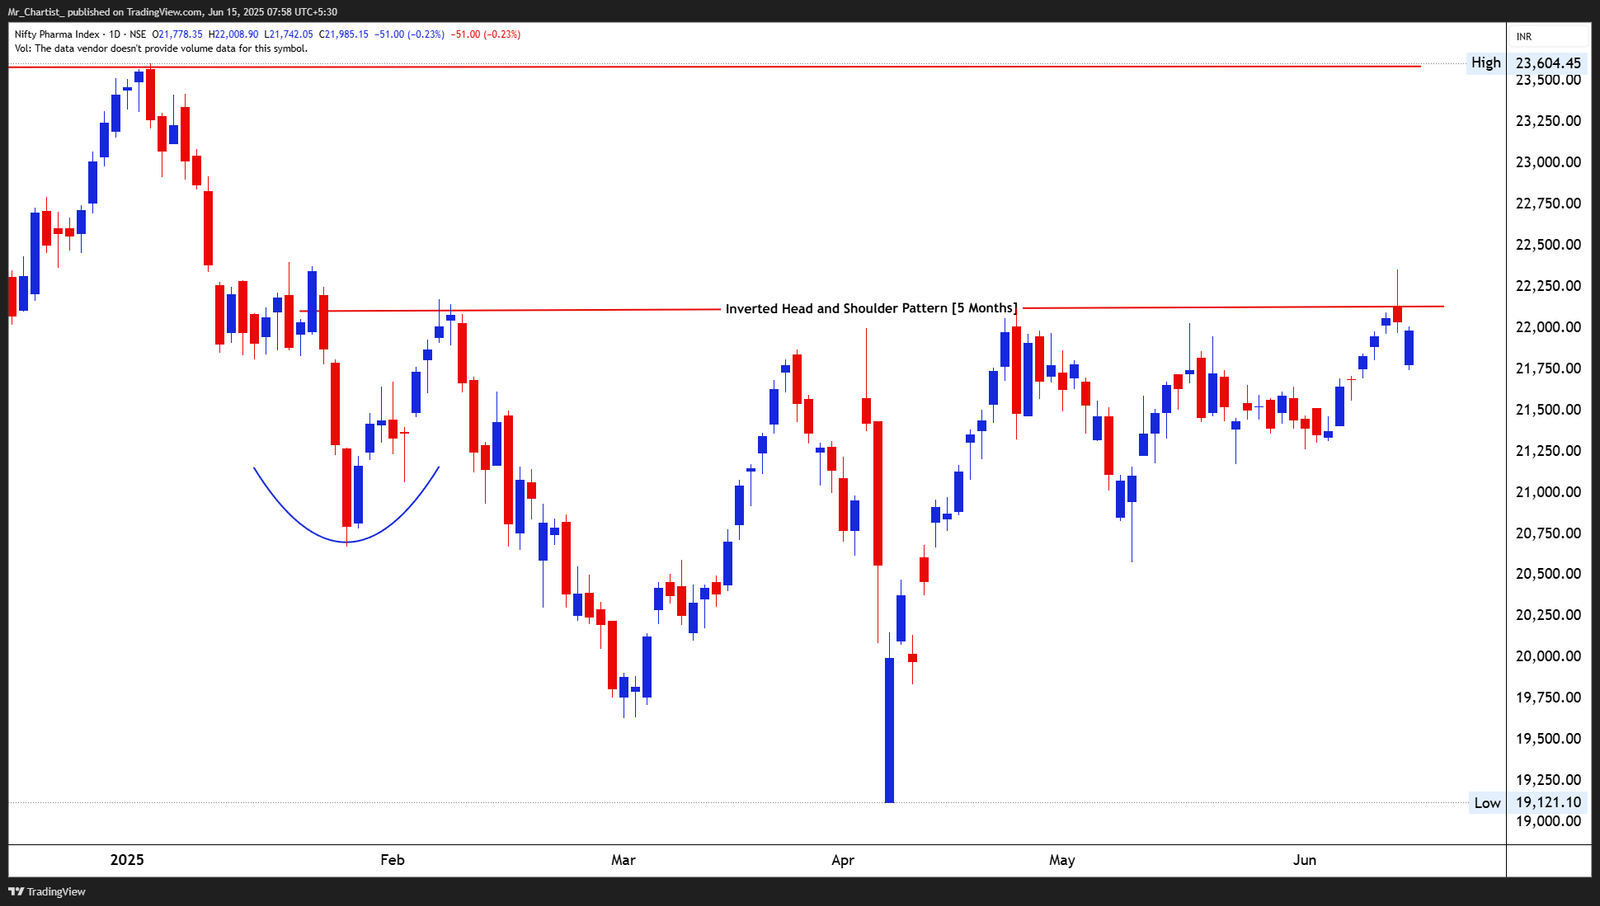
NIFTY SMALLCAP 100 INDEX
charts to-watchDouble Bottom Breakout
~4.5 Months of base formation and breakout
Thesis & Analysis
Price Action Overview: Nifty SmallCap has completed an Inverted Head & Shoulder pattern, followed by a secondary Cup and Handle formation. A clear breakout above ₹17,800 triggered a strong upward leg, confirming bullish intent. The price has since pulled back slightly after hitting a recent swing high of ₹19,224, but remains technically sound as it retests the previous breakout zone. Key Observations: Breakout from the Cup & Handle pattern led to swift upside with minimal resistance. The current dip appears orderly and could be a retest of the prior resistance-turned- support at ₹18,000. Trend structure remains intact with higher highs and higher lows since mid-May. Candlestick Behavior: Recent red candles show profit booking but not panic selling. Bullish marubozu candles formed during the breakout phase emphasize strength. 2. Crucial Support and Resistance Levels Support Levels: ₹18,000: Former neckline and handle breakout level, now acting as immediate support. ₹17,250: Prior neckline from the larger inverted H&S base; major demand zone. ₹16,000: Pattern’s low and structural base. Resistance Levels: ₹19,225: Immediate swing high; short-term resistance. ₹19,800–₹20,000: Pattern projection target from Cup depth extension. ₹20,500+: Psychological milestone and long-term upside potential. 3. Strategic Trade Scenarios 🔹 Bullish Retest Setup: If the index stabilizes above ₹18,000 and forms a bullish reversal candle, it would confirm a successful retest. A push above ₹18,750 could trigger a fresh move toward ₹19,225 and beyond. 🔸 Breakdown Scenario: A decisive close below ₹18,000 could invalidate the handle breakout and send price back to the neckline zone at ₹17,250. A sustained breach there would weaken the bullish structure.
Price Action
- ■Price action is structurally positive.
- ■Forming higher highs and higher lows.
Volume Profile
- ■Volume is supportive of the price action.
- ■Wait for volume expansion on breakout.
Key Levels
No zones specified
No zones specified
Invalidation Scenario
A weekly close below the support level invalidates this structure.
Nifty Pharma Index
charts to-watchDouble Bottom Breakout
Daily Chart
Thesis & Analysis
No detailed thesis provided for this setup.
Price Action
- ■Price action is structurally positive.
- ■Forming higher highs and higher lows.
Volume Profile
- ■Volume is supportive of the price action.
- ■Wait for volume expansion on breakout.
Key Levels
No zones specified
No zones specified
Invalidation Scenario
A weekly close below the support level invalidates this structure.
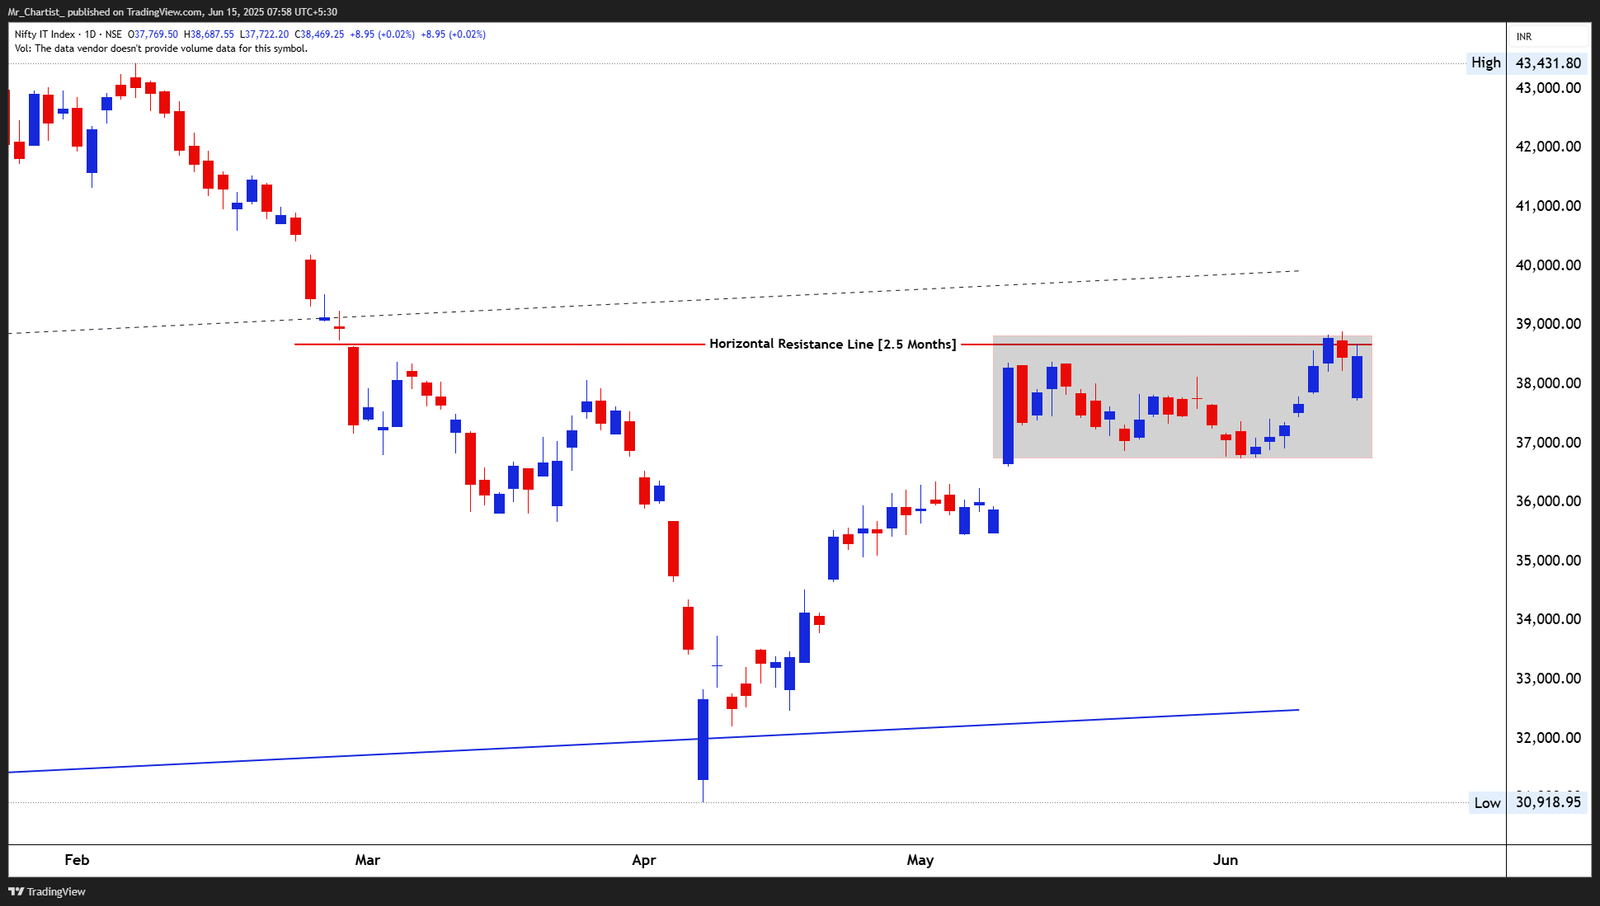
NIFTY PHARMA INDEX
charts to-watchDouble Bottom Breakout
5 Months
Thesis & Analysis
Price Action Overview: The Nifty Pharma Index is testing a crucial horizontal resistance zone near ₹22,250, which marks the neckline of a 5-month Inverted Head & Shoulder base. Although the index recently attempted a breakout, it faced immediate selling pressure, producing a Shooting Star candle — often a sign of buyer exhaustion at key resistance levels. However, buyers regained control shortly after, forming a strong bullish marubozu candle, suggesting renewed momentum and a possible re-attempt at the breakout. Candlestick Behavior: Shooting Star on breakout attempt – signals caution. Followed by a Bullish Marubozu – restoring confidence. Current setup reflects indecision near resistance with bullish bias if follow- through occurs. 2. Crucial Support and Resistance Levels Resistance Levels: ₹22,250: Major neckline resistance of the pattern. ₹22,800–₹23,000: Potential post-breakout upside zone. ₹23,600: Medium-term target based on pattern projection. Support Levels: ₹21,750: Immediate support; failure to hold would negate bullish setup. ₹21,250: Right shoulder support zone and mid-range pivot. ₹20,600–₹20,750: Strong demand zone near left shoulder base. 3. Strategic Trade Scenarios 🔹 Bullish Breakout Setup: A decisive daily close above ₹22,250 backed by strong momentum could confirm breakout from the Inverted H&S pattern. In such case, targets between ₹22,800 and ₹23,600 become actionable. 🔸 Breakdown Failure Setup: If the index fails to sustain above ₹21,750 and closes below this zone, the H&S pattern will be invalidated. This would increase probability of downside extension toward ₹21,250 and even ₹20,750.
Price Action
- ■Price action is structurally positive.
- ■Forming higher highs and higher lows.
Volume Profile
- ■Volume is supportive of the price action.
- ■Wait for volume expansion on breakout.
Key Levels
No zones specified
No zones specified
Invalidation Scenario
A weekly close below the support level invalidates this structure.
Nifty IT Index
charts to-watchDouble Bottom Breakout
Daily Chart
Thesis & Analysis
No detailed thesis provided for this setup.
Price Action
- ■Price action is structurally positive.
- ■Forming higher highs and higher lows.
Volume Profile
- ■Volume is supportive of the price action.
- ■Wait for volume expansion on breakout.
Key Levels
No zones specified
No zones specified
Invalidation Scenario
A weekly close below the support level invalidates this structure.
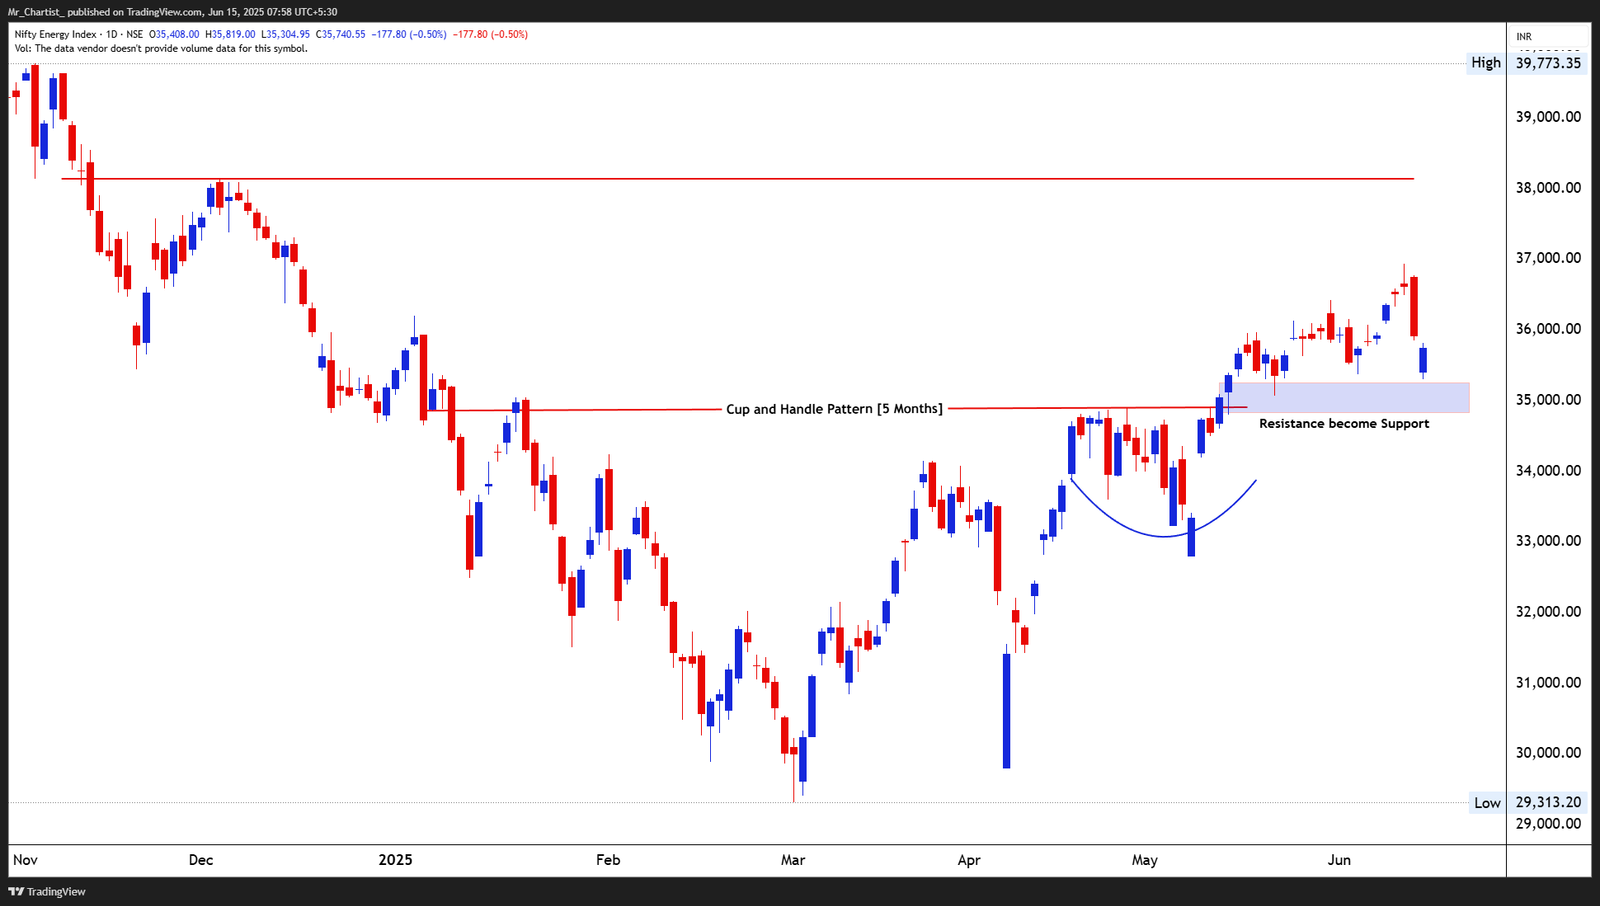
NIFTY IT INDEX
charts to-watchRectangle Consolidation
2.5 Months
Thesis & Analysis
Price Action Overview: Nifty IT Index is exhibiting a dual-pattern setup with a broader ascending triangle structure forming over the past few months, supported by a short-term rectangle range between ₹36,800 and ₹39,000. The price is currently hovering just below the critical ₹39,000 resistance line, which has been tested multiple times over the past 10 sessions. The flat horizontal ceiling against a rising base reflects demand pressure — a textbook ascending triangle behavior. Candlestick Behavior: Price recently formed a small rejection candle near the top resistance band (₹39,000). However, the sequence of higher lows indicates underlying accumulation pressure. Consolidation within a tight range shows declining volatility — typical precursor to directional move. 2. Crucial Support and Resistance Levels Resistance Levels: ₹39,000: Major breakout level of both the rectangle and triangle patterns. ₹40,300–₹41,000: Projected post-breakout zone based on pattern height. ₹43,400: Previous major top. Support Levels: ₹36,800: Immediate floor of rectangle and ascending triangle support. ₹35,700: Short-term demand base and trendline touch point. ₹34,400: Weekly trendline support zone. 3. Strategic Trade Scenarios 🔹 Bullish Breakout Setup: A strong daily close above ₹39,000 with momentum would confirm breakout from both rectangle and triangle. This would open upside targets toward ₹40,300–₹41,000. 🔸 Breakdown Scenario: If the index slips below ₹36,800 and sustains, the ascending triangle gets invalidated. This would expose the index to downside towards ₹35,700 and eventually ₹34,400.
Price Action
- ■Price action is structurally positive.
- ■Forming higher highs and higher lows.
Volume Profile
- ■Volume is supportive of the price action.
- ■Wait for volume expansion on breakout.
Key Levels
No zones specified
No zones specified
Invalidation Scenario
A weekly close below the support level invalidates this structure.
Nifty Energy Index
charts to-watchDouble Bottom Breakout
Daily Chart
Thesis & Analysis
No detailed thesis provided for this setup.
Price Action
- ■Price action is structurally positive.
- ■Forming higher highs and higher lows.
Volume Profile
- ■Volume is supportive of the price action.
- ■Wait for volume expansion on breakout.
Key Levels
No zones specified
No zones specified
Invalidation Scenario
A weekly close below the support level invalidates this structure.
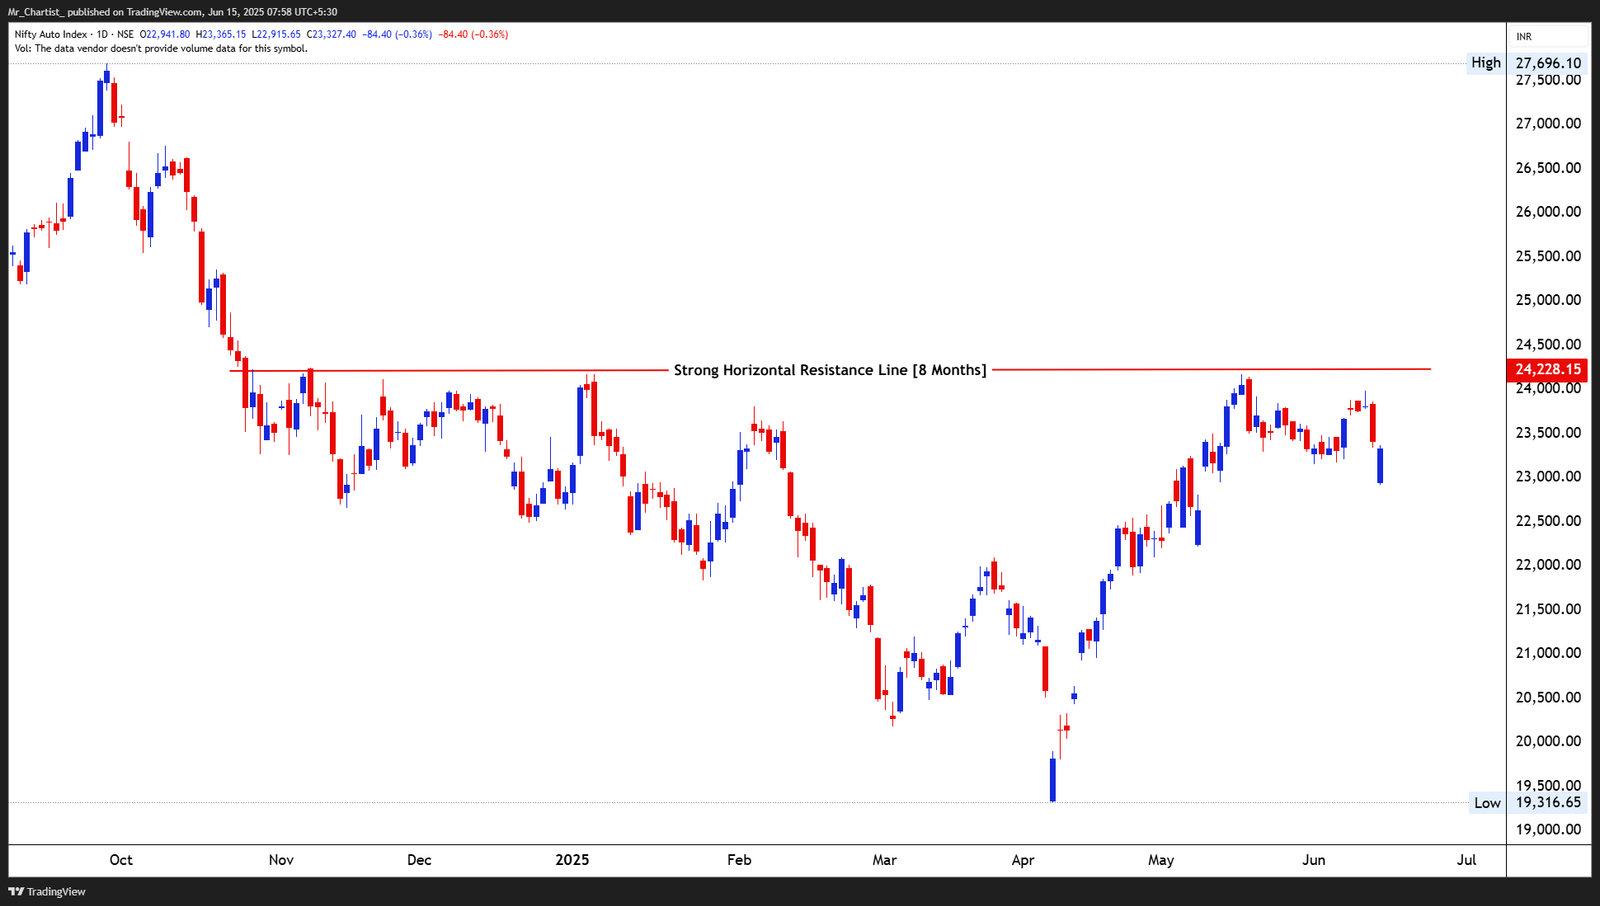
NIFTY ENERGY INDEX
charts to-watchDouble Bottom Breakout
Daily Chart
Thesis & Analysis
No detailed thesis provided for this setup.
Price Action
- ■Price action is structurally positive.
- ■Forming higher highs and higher lows.
Volume Profile
- ■Volume is supportive of the price action.
- ■Wait for volume expansion on breakout.
Key Levels
No zones specified
No zones specified
Invalidation Scenario
A weekly close below the support level invalidates this structure.
Nifty Auto Index
charts to-watchDouble Bottom Breakout
Daily Chart
Thesis & Analysis
No detailed thesis provided for this setup.
Price Action
- ■Price action is structurally positive.
- ■Forming higher highs and higher lows.
Volume Profile
- ■Volume is supportive of the price action.
- ■Wait for volume expansion on breakout.
Key Levels
No zones specified
No zones specified
Invalidation Scenario
A weekly close below the support level invalidates this structure.
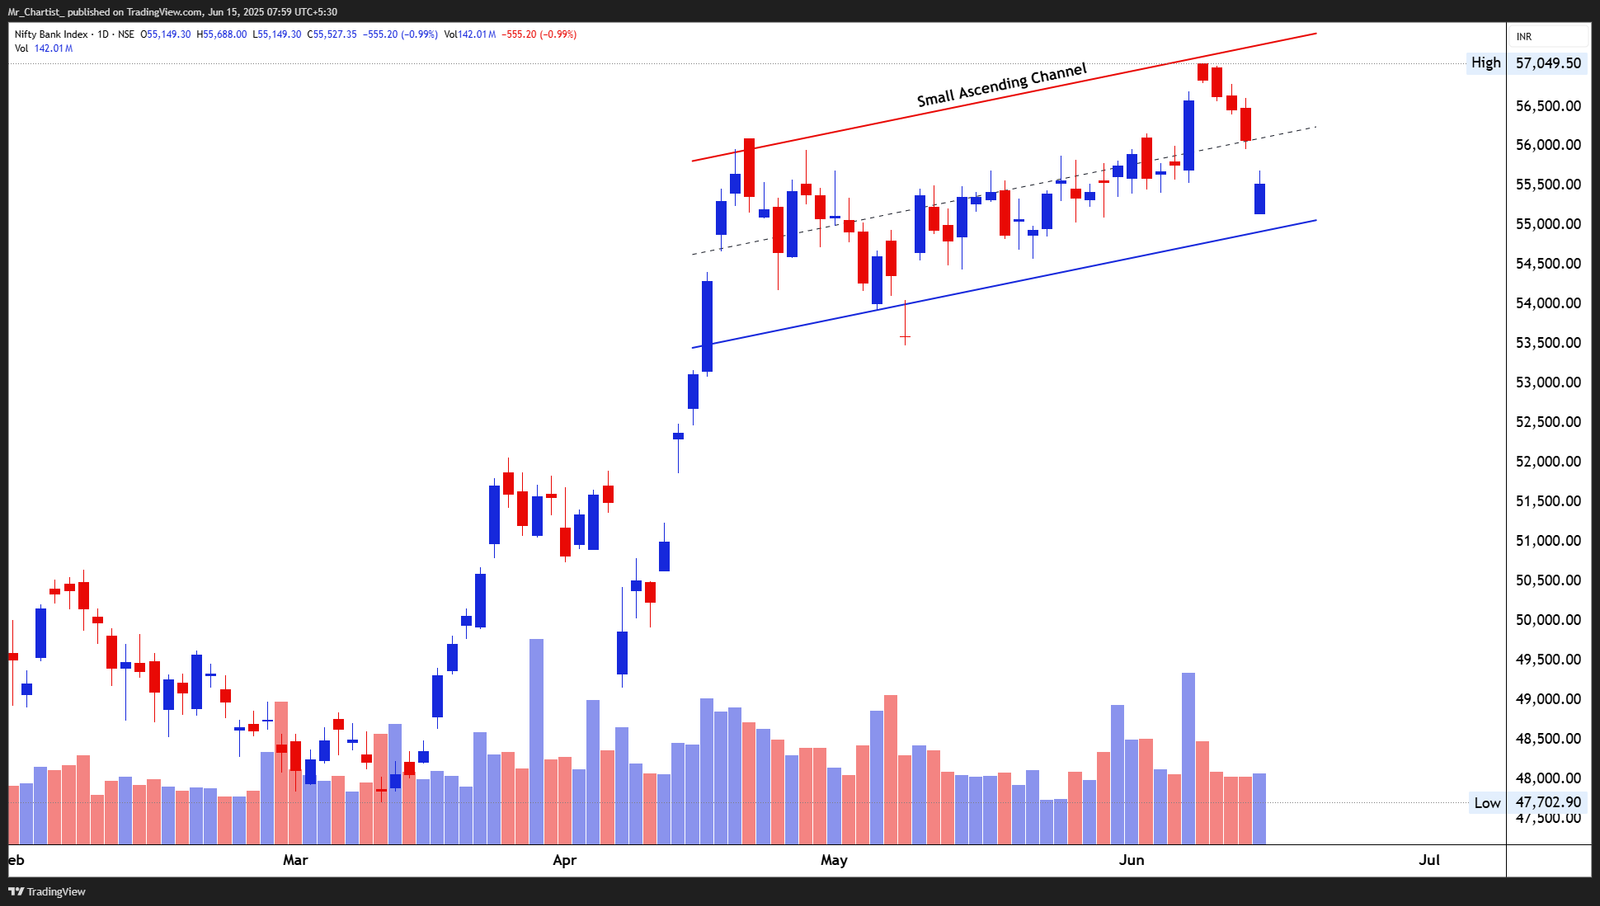
NIFTY AUTO INDEX
charts to-watchDouble Bottom Breakout
8 Months
Thesis & Analysis
Current Price Context: Trading Below Resistance, Rangebound Setup Price Action Overview: The index has been repeatedly testing the ₹24,300 resistance level, which has acted as a strong ceiling since late 2024. Despite multiple rallies, price has failed to secure a sustained close above this horizontal barrier, forming a wide consolidation range between ₹22,500 and ₹24,300. The recent bearish candle reinforces the rejection at this zone, indicating supply pressure remains dominant. Unless price clears this mark with strong follow- through, the index is likely to oscillate within the current band. Candlestick Behavior: Recent rejection candle has a long upper wick, suggesting rejection from highs. Sequence of sideways candles in this zone confirms consolidation. No clear breakout volume observed yet. 2. Crucial Support and Resistance Levels Support Zones: ₹22,500: Well-tested floor of the ongoing consolidation range. ₹21,600: Last significant swing low from April. ₹20,500: Broader base formed during March recovery. Resistance Levels: ₹24,300: Key horizontal barrier; breakout level. ₹25,000: Psychological round number and post-breakout expansion zone. ₹27,000+: Longer-term bullish target, contingent on breakout. 3. Strategic Trade Scenarios 🔹 Bullish Breakout Setup: If price breaks above ₹24,300 and sustains with volume confirmation, the index may target ₹25,000–₹27,000. A daily or weekly close above this level would confirm strength. 🔸 Consolidation Continuation: Failure to surpass ₹24,300 could lead to extended range-bound activity between ₹22,500–₹24,300. Short-term traders can anticipate mean-reversion setups until a decisive move occurs.
Price Action
- ■Price action is structurally positive.
- ■Forming higher highs and higher lows.
Volume Profile
- ■Volume is supportive of the price action.
- ■Wait for volume expansion on breakout.
Key Levels
No zones specified
No zones specified
Invalidation Scenario
A weekly close below the support level invalidates this structure.
Nifty Bank Index
charts to-watchDouble Bottom Breakout
Daily Chart
Thesis & Analysis
No detailed thesis provided for this setup.
Price Action
- ■Price action is structurally positive.
- ■Forming higher highs and higher lows.
Volume Profile
- ■Volume is supportive of the price action.
- ■Wait for volume expansion on breakout.
Key Levels
No zones specified
No zones specified
Invalidation Scenario
A weekly close below the support level invalidates this structure.
Chart Image Not Extracted
NIFTY BANK INDEX
charts to-watchDouble Bottom Breakout
Small Ascending Channel [~2 Months]
Thesis & Analysis
Price Action Overview: The Bank Nifty is currently trading within a narrow ascending channel pattern, defined by higher highs and higher lows. The index recently rejected the upper channel boundary near the ₹57,000 level and has now dropped sharply toward the lower channel support. The last three sessions have seen an acceleration in bearish momentum, with Friday's candle closing well below the mid-channel line and approaching the lower trendline. This price action suggests increasing pressure within the channel. Candlestick Behavior: Recent candles show strong bearish bodies with little to no lower wick. Momentum has shifted down rapidly from the upper resistance line. Volume Insight: Volume has expanded during the recent decline, hinting at distribution pressure as price pulled back from resistance. 2. Crucial Support and Resistance Levels Support Zones: ₹55,000–₹54,800: Lower boundary of ascending channel. ₹53,700: Last major swing low and potential trend invalidation point. ₹52,300: Intermediate demand zone from April rally. Resistance Levels: ₹57,000: Upper channel resistance and recent high. ₹56,200: Mid-channel zone; now flipped to potential resistance. ₹58,000+: Trend continuation zone above breakout. 3. Strategic Trade Scenarios 🔹 Bullish Case: If price finds support near the lower channel line (₹54,800–₹55,000), a reversal could set up a continuation trade targeting ₹56,200 and then ₹57,000+. Look for reversal candlesticks near support, coupled with falling volume on the pullback. 🔸 Breakdown Scenario: A daily close below ₹54,800 with rising volume would signal a pattern breakdown. In such a case, the index could retest lower supports at ₹53,700 and ₹52,300.
Price Action
- ■Price action is structurally positive.
- ■Forming higher highs and higher lows.
Volume Profile
- ■Volume is supportive of the price action.
- ■Wait for volume expansion on breakout.
Key Levels
No zones specified
No zones specified
Invalidation Scenario
A weekly close below the support level invalidates this structure.
SEBI Registered Research Analyst — INH000015297 (INVESTOLOGY). Investment in securities market are subject to market risks. Read all related documents carefully before investing. The content provided is for educational purposes only and should not be considered as financial advice. Past performance is not indicative of future results.