Coming Soon
The Weekend Visual ChartBook is currently undergoing a massive upgrade. Stay tuned for a world-class reading experience.
Return HomeWeekend Visual ChartBook
Edition #271
Extracted Edition
Market Pulse
LiveReal-time index prices above. Detailed index chart analysis below in the Indices section.
Bullish Charts [F&O]
Breakout and momentum setups from the F&O universe
Adani Total Gas Ltd.
bullish fnoDouble Bottom Breakout
Daily Chart
Thesis & Analysis
No detailed thesis provided for this setup.
Price Action
- ■Price action is structurally positive.
- ■Forming higher highs and higher lows.
Volume Profile
- ■Volume is supportive of the price action.
- ■Wait for volume expansion on breakout.
Key Levels
No zones specified
No zones specified
Invalidation Scenario
A weekly close below the support level invalidates this structure.
ADANI TOTAL GAS LTD.
bullish fnoThe latest candle is a strong bullish wide-range bar, with a close near the day’s high and a
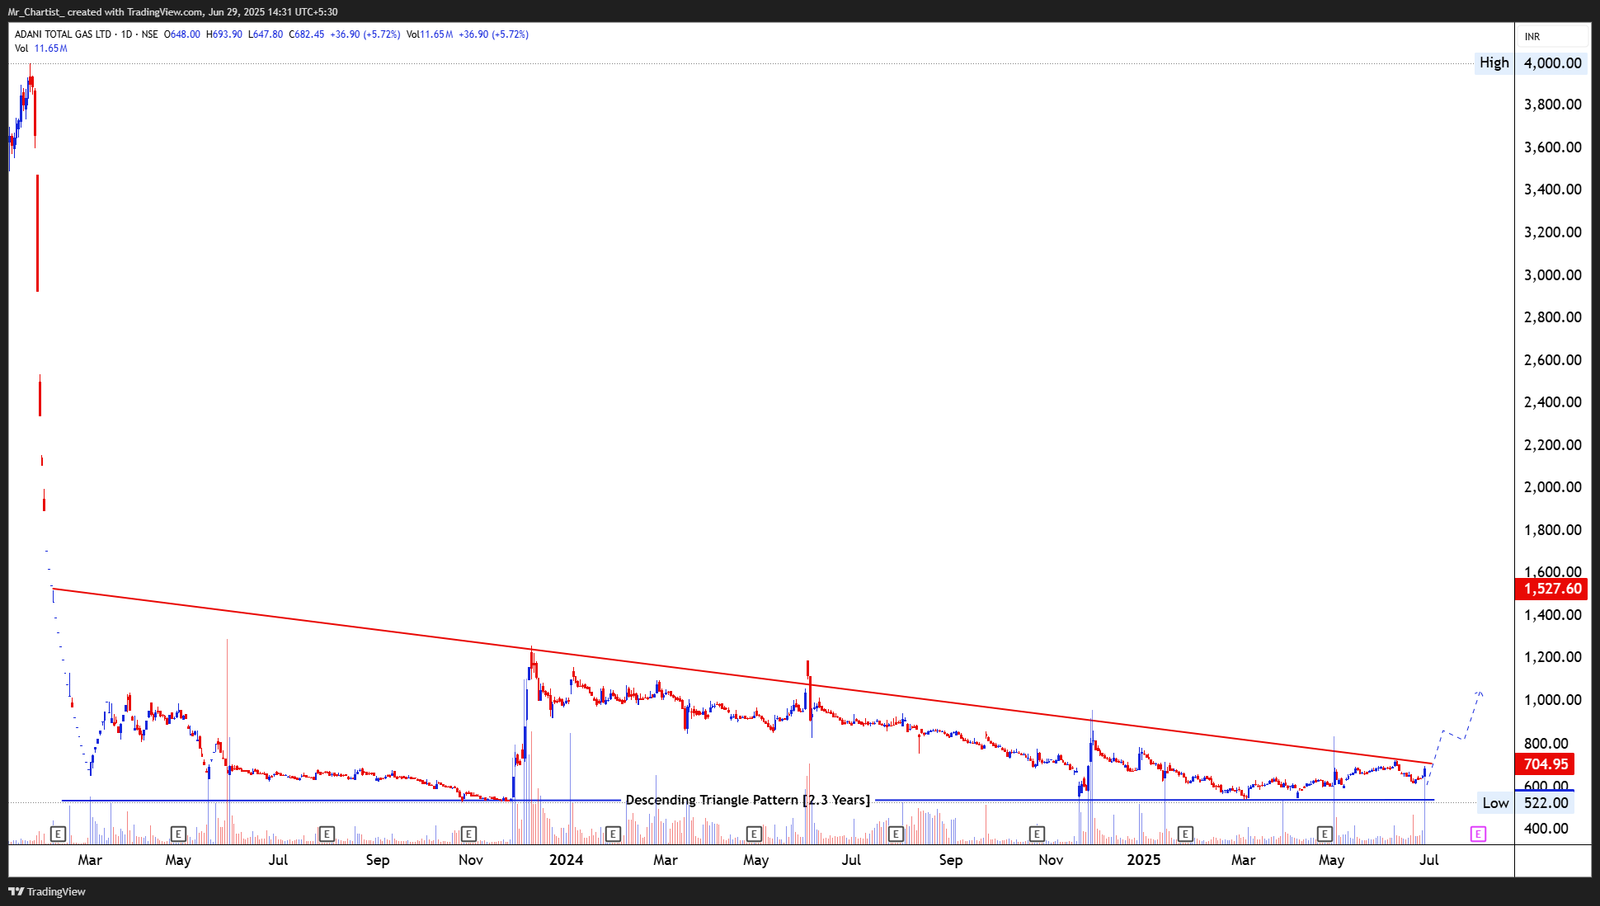
~2.3 Years (Since early 2023)
Thesis & Analysis
Price Action Overview: ATGL has been confined within a long-term descending triangle—a bearish structure by nature—but price is now attempting to challenge the down-sloping resistance line. The flat support near ₹522 has held multiple times since early 2023, showing strong defense from buyers at lower levels. Recent price action has shown a short-term breakout attempt with a sharp move higher, suggesting potential shift in sentiment after prolonged consolidation. Candlestick Pattern: The latest candle is a strong bullish wide-range bar, with a close near the day’s high and a near-vertical rally—indicating aggressive short-covering or fresh buying pressure. This candle emerges just as the price tests the upper trendline, making it a critical moment for directional validation. Volume Analysis: Volume has spiked significantly with the recent breakout attempt, well above the average levels seen over the last several months. This volume surge, in a context of long-term compression, supports the credibility of a structural breakout possibility. 2. Crucial Support and Resistance Levels Support Levels: ₹600: Recent breakout point; prior resistance-turned-support. ₹522: Flat support of the descending triangle—major structural floor. ₹480: Emergency zone if breakdown occurs below structure. Resistance Levels: ₹705–₹750: Near-term resistance and immediate post-breakout test zone. ₹900: Swing high from earlier phases of 2023. ₹1,000+: Round-number zone and major psychological resistance if uptrend continues. Sustained move above ₹705–₹750 range would confirm breakout from the multi-year triangle. 3. Strategic Trade Scenarios 🔹 Potential Bullish Breakout Setup: A follow-through move above ₹705–₹750 with strong volume would confirm a descending triangle breakout, possibly opening up upside targets toward ₹900 and ₹1,000+. This could mark the end of the prolonged downtrend. 🔸 False Breakout / Rejection Scenario: If price fails to sustain above the upper boundary and slips back below ₹600, the breakout attempt would be negated, potentially dragging the stock back toward the ₹522 support zone within the triangle base.
Price Action
- ■Price action is structurally positive.
- ■Forming higher highs and higher lows.
Volume Profile
- ■Volume is supportive of the price action.
- ■Wait for volume expansion on breakout.
Key Levels
No zones specified
No zones specified
Invalidation Scenario
A weekly close below the support level invalidates this structure.
Laurus Labs Ltd.
bullish fnoDouble Bottom Breakout
Daily Chart
Thesis & Analysis
No detailed thesis provided for this setup.
Price Action
- ■Price action is structurally positive.
- ■Forming higher highs and higher lows.
Volume Profile
- ■Volume is supportive of the price action.
- ■Wait for volume expansion on breakout.
Key Levels
No zones specified
No zones specified
Invalidation Scenario
A weekly close below the support level invalidates this structure.
LAURUS LABS LTD.
bullish fnoThe breakout was led by a bullish wide-range candle closing near its high, followed by a
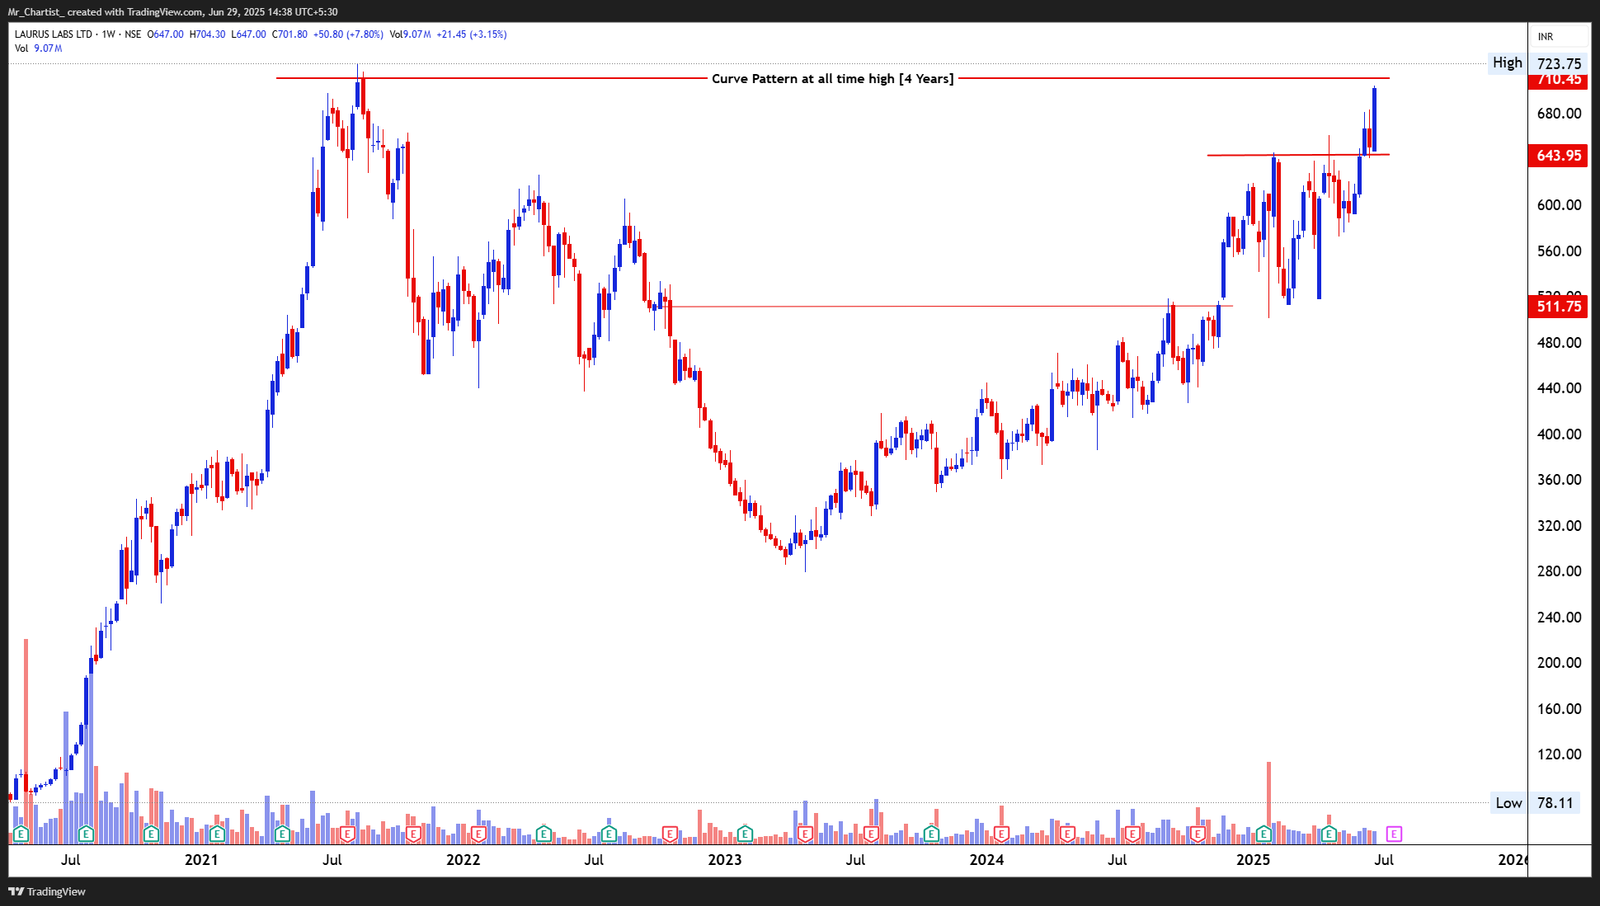
~4 Years (Multi-Year Base at All-Time Highs)
Thesis & Analysis
Price Action Overview: Laurus Labs has completed a rounded base (curve) pattern after spending nearly 4 years consolidating below its all-time highs. The structure resembles a textbook long- term cup formation, with the right side showing steady recovery and volume-backed higher lows. Recently, the price decisively broke above the ₹643–₹645 resistance zone, validating the pattern breakout and pushing into all-time high territory. This breakout from a prolonged base suggests potential for a new structural uptrend. Candlestick Pattern: The breakout was led by a bullish wide-range candle closing near its high, followed by a brief pullback and fresh momentum candle this week. This pattern of breakout–retest– follow-through reflects healthy participation and buyer control. Volume Analysis: Volume has been gradually increasing through the latter half of the base formation. The breakout week saw a noticeable spike in volume, confirming institutional interest and positioning into the breakout zone. 2. Crucial Support and Resistance Levels Support Levels: ₹645: Breakout level from the 4-year curve; now a critical support pivot. ₹600: Short-term breakout base and structural cushion zone. ₹511: Historical resistance from 2021–2022; now a long-term demand level. Resistance Levels: ₹723: Immediate all-time high; a minor psychological barrier. ₹750–₹780+: Fibonacci extensions and price discovery levels post breakout. Staying above ₹645 on closing basis is key to maintain the bullish structure and prevent false breakout risk. 3. Strategic Trade Scenarios 🔹 Bullish Breakout Continuation Setup: If price sustains above ₹645–₹650, the multi-year curve breakout remains active. This sets up a long-term move toward ₹723 followed by ₹750–₹780+ in price discovery. 🔸 Retest Scenario: If the price dips back to ₹645 but holds the level with tight-range candles or reversal signals, it may offer a re-accumulation zone before continuation. A breakdown below ₹600 would weaken the bullish setup temporarily.
Price Action
- ■Price action is structurally positive.
- ■Forming higher highs and higher lows.
Volume Profile
- ■Volume is supportive of the price action.
- ■Wait for volume expansion on breakout.
Key Levels
No zones specified
No zones specified
Invalidation Scenario
A weekly close below the support level invalidates this structure.
Shree Cement Ltd.
bullish fnoDouble Bottom Breakout
Daily Chart
Thesis & Analysis
No detailed thesis provided for this setup.
Price Action
- ■Price action is structurally positive.
- ■Forming higher highs and higher lows.
Volume Profile
- ■Volume is supportive of the price action.
- ■Wait for volume expansion on breakout.
Key Levels
No zones specified
No zones specified
Invalidation Scenario
A weekly close below the support level invalidates this structure.
SHREE CEMENT LTD.
bullish fnoThe latest candle shows a notable rebound following a sharp correction in the prior
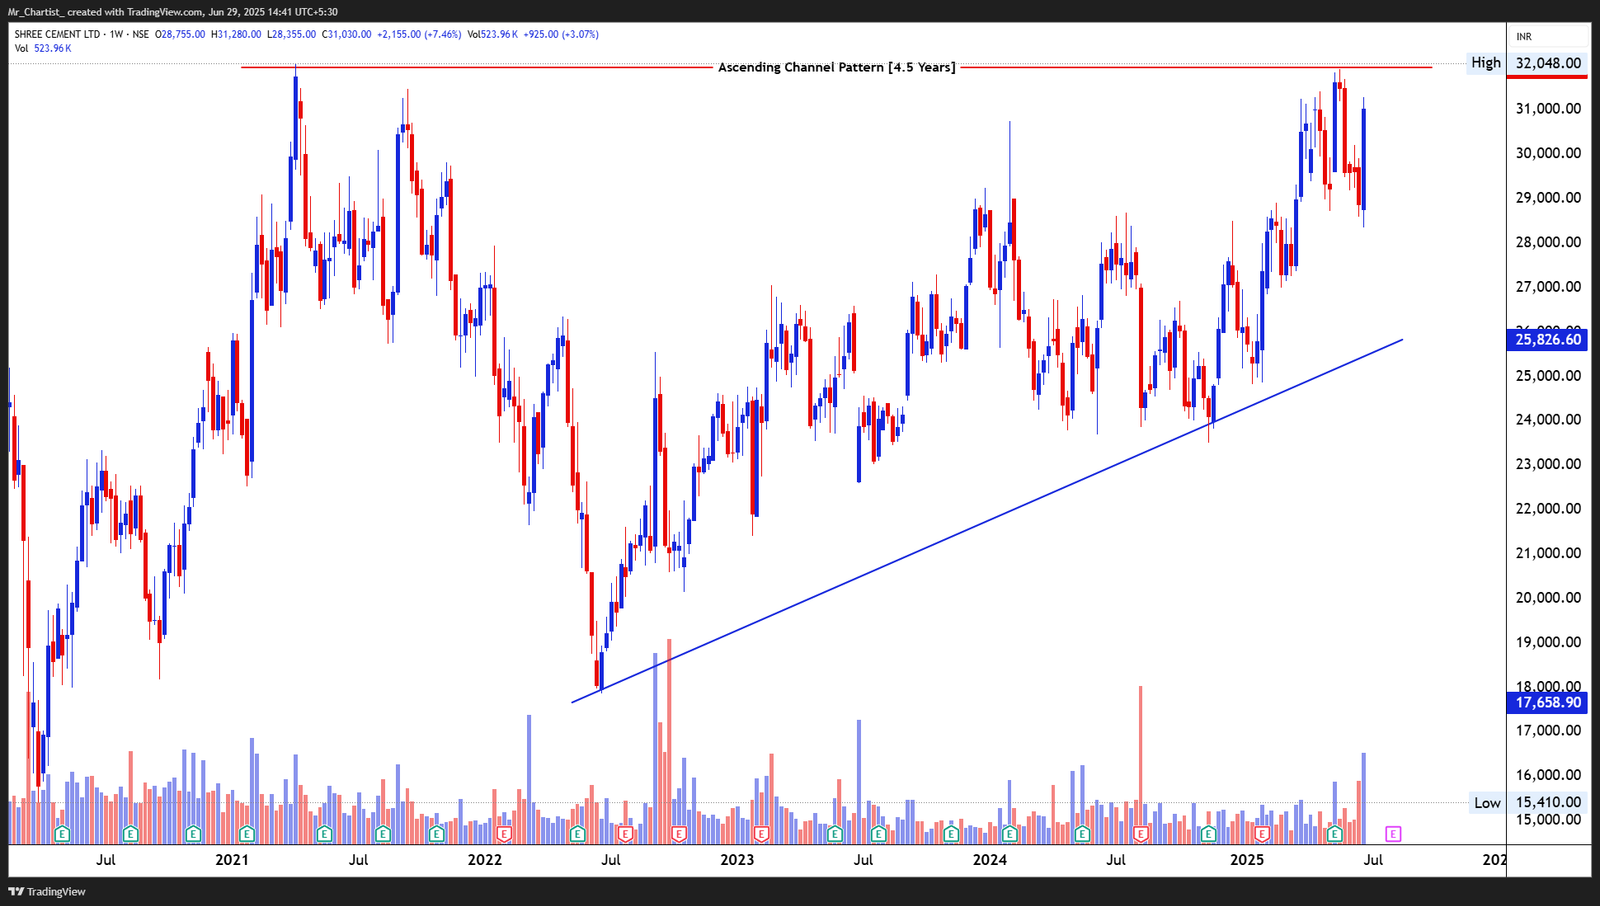
~4.5 Years (Since Late 2020)
Thesis & Analysis
Price Action Overview: Shree Cement has been respecting a long-term ascending Triangle for over four years, consistently making higher lows and testing the upper channel boundary. The price recently faced rejection near the upper end of the structure around ₹32,000, which has capped previous rallies. Despite this pullback, the broader trend remains constructive as the stock trades near the upper third of the channel with a strong bounce from the lower support zones in previous quarters. Candlestick Pattern: The latest candle shows a notable rebound following a sharp correction in the prior week, indicating strong demand absorption. This reversal candle, forming just below the resistance, could set the stage for another test of the channel top. Volume Analysis: Volume during the recent rebound is relatively elevated, suggesting renewed participation at lower levels. Historically, price has respected both bounds of the channel with increasing volume on bounces—underscoring structural reliability. 2. Crucial Support and Resistance Levels Support Levels: ₹29,000: Recent pivot support just below current price. ₹27,500: Intermediate channel support and previous swing low. ₹25,800: Lower Triangle trendline and multi-month structural base. Resistance Levels: ₹32,000–₹32,050: Triangle ceiling; long-term resistance zone. ₹33,500+: Breakout extension level if channel top is breached. The ascending channel remains intact as long as price holds above ₹27,500, with breakout confirmation needed above ₹32,050. 3. Strategic Trade Scenarios 🔹 Channel Breakout Setup: A breakout above ₹32,050 on strong volume could invalidate the upper boundary and initiate a new uptrend leg, with ₹33,500+ as the next target zone. 🔸 Pullback Within Channel: If price fails to breach ₹32,000 and retreats, it may re-enter a consolidation phase toward ₹29,000 or the ₹27,500 lower channel region—still within a healthy long- term bullish structure.
Price Action
- ■Price action is structurally positive.
- ■Forming higher highs and higher lows.
Volume Profile
- ■Volume is supportive of the price action.
- ■Wait for volume expansion on breakout.
Key Levels
No zones specified
No zones specified
Invalidation Scenario
A weekly close below the support level invalidates this structure.
Indraprastha Gas Ltd.
bullish fnoDouble Bottom Breakout
Daily Chart
Thesis & Analysis
No detailed thesis provided for this setup.
Price Action
- ■Price action is structurally positive.
- ■Forming higher highs and higher lows.
Volume Profile
- ■Volume is supportive of the price action.
- ■Wait for volume expansion on breakout.
Key Levels
No zones specified
No zones specified
Invalidation Scenario
A weekly close below the support level invalidates this structure.
INDRAPRASTHA GAS LTD.
bullish fnoRecent candles show alternating strength with some rejection wicks near ₹215–₹220,
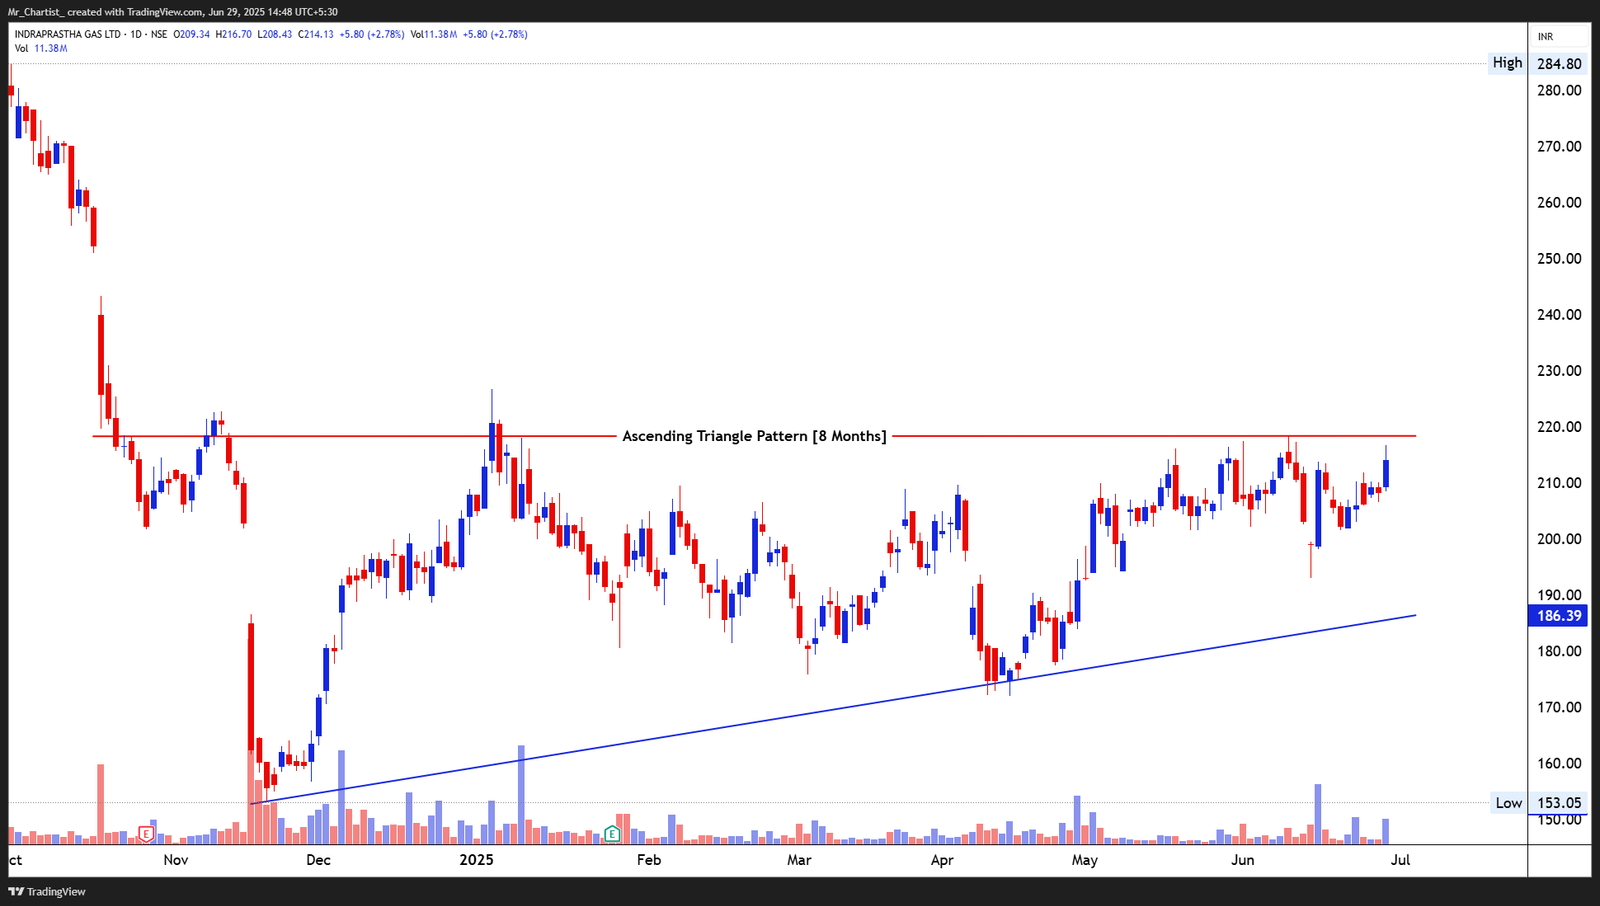
~8 Months (Consolidation Phase)
Thesis & Analysis
Price Action Overview: IGL has been forming an ascending triangle with a flat resistance at ₹220 and higher lows since November 2024. This is a constructive pattern that often precedes a breakout to the upside, indicating consistent demand at incrementally higher levels. The price is currently approaching the resistance zone again after rebounding from its rising trendline, signaling continued pressure buildup. Candlestick Pattern: Recent candles show alternating strength with some rejection wicks near ₹215–₹220, but a higher low base has held consistently. Today’s candle shows a minor pullback, but the overall structure remains intact within the triangle. Volume Analysis: Volume has been average during the formation, with brief spikes near support—typical of accumulation zones. Watch for a volume surge on a confirmed breakout above ₹220 for confirmation. 2. Crucial Support and Resistance Levels Support Levels: ₹200: Intermediate support and recent swing low. ₹186: Rising trendline support—critical for pattern validity. ₹175: Breakdown point in case of structure failure. Resistance Levels: ₹220: Flat horizontal resistance and breakout trigger. ₹245–₹250: Prior gap area and potential upside target post breakout. ₹284: Previous swing high; long-term resistance. A daily close above ₹220 with volume would signal a potential breakout from this 8- month pattern. 3. Strategic Trade Scenarios 🔹 Bullish Breakout Setup: A confirmed breakout above ₹220, especially with strong volume, may open targets toward ₹245–₹250 in the near term, with scope for extended move to ₹284. 🔸 Range Continuation / Breakdown Setup: If price faces rejection from ₹220 again and breaks below ₹200 or the ₹186 rising support, the ascending triangle could invalidate, leading to a broader consolidation or deeper pullback.
Price Action
- ■Price action is structurally positive.
- ■Forming higher highs and higher lows.
Volume Profile
- ■Volume is supportive of the price action.
- ■Wait for volume expansion on breakout.
Key Levels
No zones specified
No zones specified
Invalidation Scenario
A weekly close below the support level invalidates this structure.
UNO Minda Ltd.
bullish fnoDouble Bottom Breakout
Daily Chart
Thesis & Analysis
No detailed thesis provided for this setup.
Price Action
- ■Price action is structurally positive.
- ■Forming higher highs and higher lows.
Volume Profile
- ■Volume is supportive of the price action.
- ■Wait for volume expansion on breakout.
Key Levels
No zones specified
No zones specified
Invalidation Scenario
A weekly close below the support level invalidates this structure.
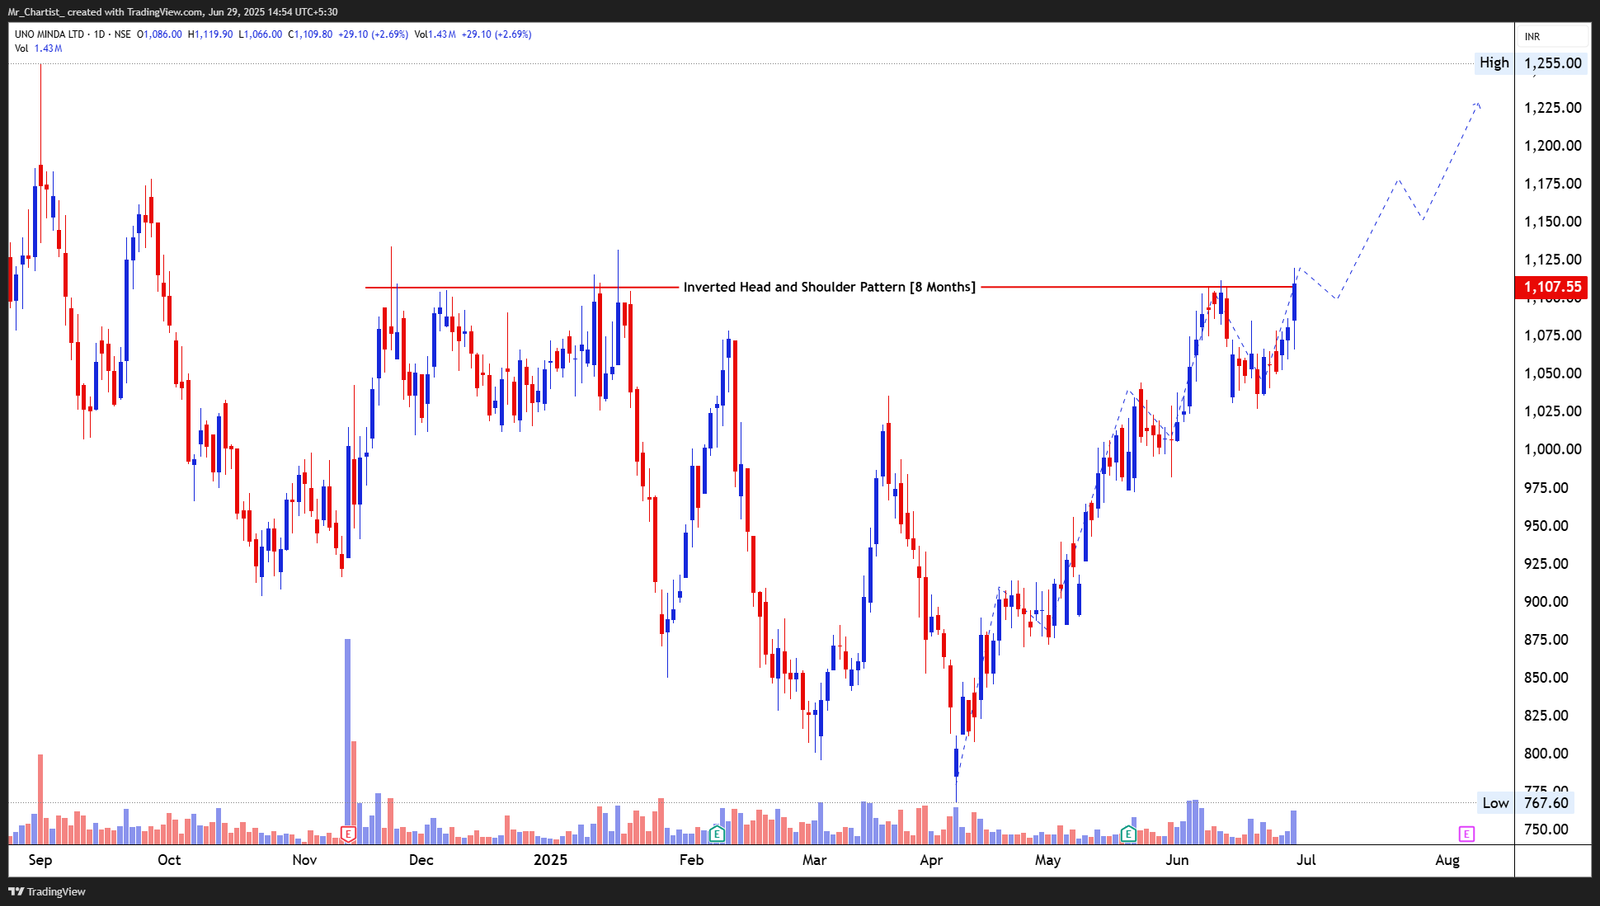
UNO MINDA LTD.
bullish fnoToday’s candle is a strong bullish close above the neckline, following a series of higher
~8 Months Consolidation Base
Thesis & Analysis
Price Action Overview: UNO Minda has completed a well-defined inverted head and shoulder pattern, with the neckline around ₹1,107 now being challenged. This bullish reversal formation has developed over the last 8 months, with higher troughs forming the left shoulder, head, and right shoulder. The current breakout attempt reflects bullish intent, with a clean uptrend into the neckline and no major supply zones overhead in the short term. Candlestick Pattern: Today’s candle is a strong bullish close above the neckline, following a series of higher highs and higher lows. Previous sessions showed absorption of selling pressure just below the neckline, setting up a healthy breakout. Volume Analysis: Volume on the breakout is supportive, showing a modest but clear uptick from the consolidation zone. Continuation of rising volume will be key for sustaining the breakout toward higher levels. 2. Crucial Support and Resistance Levels Support Levels: ₹1,107: Neckline breakout zone—must hold for bullish confirmation. ₹1,050: Prior swing high and short-term base. ₹980: Intermediate demand zone from May. Resistance Levels: ₹1,175: Initial measured target derived from pattern height. ₹1,225–₹1,255: Previous major high zone and likely medium-term resistance. Holding above ₹1,107 will maintain bullish structure and set the stage for continued upside. 3. Strategic Trade Scenarios 🔹 Bullish Breakout Setup: A sustained close above ₹1,107 confirms the inverted H&S breakout, with a potential upside target around ₹1,175–₹1,225. Rising volume and narrow-range follow-through candles would strengthen the case. 🔸 Breakout Failure Scenario: If the stock drops back below ₹1,107 and closes below the neckline zone, the breakout could be considered failed. In such case, price may revisit the ₹1,050 or ₹980 support levels for reaccumulation.
Price Action
- ■Price action is structurally positive.
- ■Forming higher highs and higher lows.
Volume Profile
- ■Volume is supportive of the price action.
- ■Wait for volume expansion on breakout.
Key Levels
No zones specified
No zones specified
Invalidation Scenario
A weekly close below the support level invalidates this structure.
ICICI Bank Ltd.
bullish fnoDouble Bottom Breakout
Daily Chart
Thesis & Analysis
No detailed thesis provided for this setup.
Price Action
- ■Price action is structurally positive.
- ■Forming higher highs and higher lows.
Volume Profile
- ■Volume is supportive of the price action.
- ■Wait for volume expansion on breakout.
Key Levels
No zones specified
No zones specified
Invalidation Scenario
A weekly close below the support level invalidates this structure.
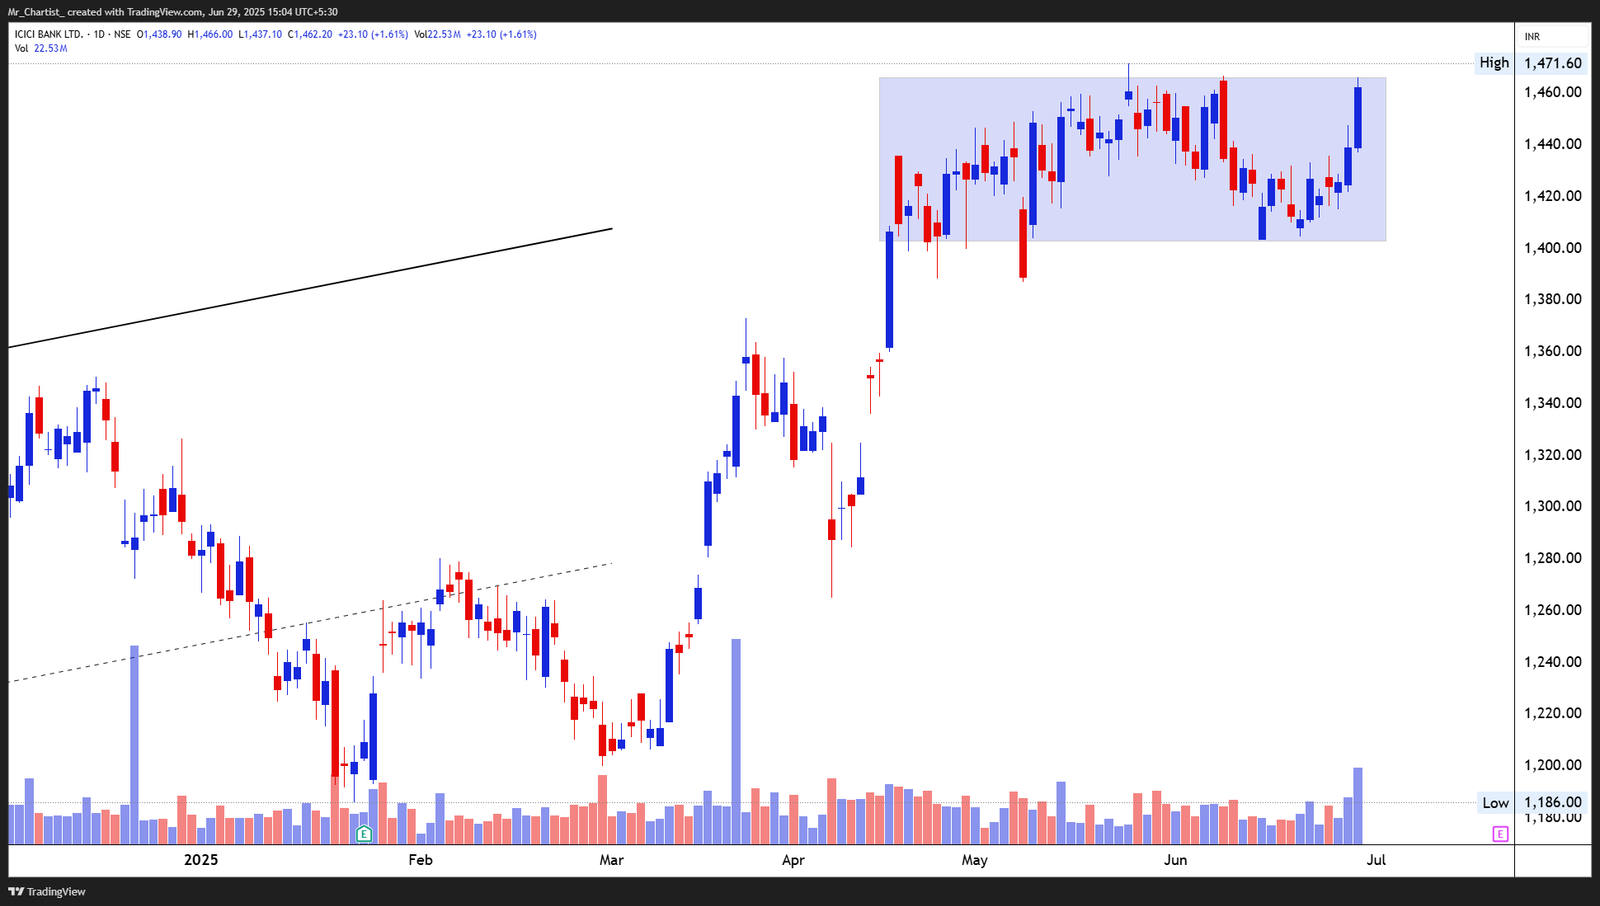
ICICI BANK LTD.
bullish fnoToday’s candle is a bullish marubozu—a wide-bodied candle with no upper or lower
~2 Months (Pole: mid-April rally; Flag: 6-week range)
Thesis & Analysis
Price Action Overview: ICICI Bank has formed a Pole & Flag structure where a sharp vertical rally created the pole, followed by a tight rectangular consolidation range between ₹1,415 and ₹1,470. The current breakout attempt from the upper boundary of this flag indicates a bullish continuation. This setup suggests temporary consolidation after a strong move and sets the stage for another potential leg higher. Candlestick Pattern: Today’s candle is a bullish marubozu—a wide-bodied candle with no upper or lower shadow—closing near the day’s high. This signifies strong momentum and breakout conviction. Volume Analysis: Volume surged significantly on today’s breakout candle—confirming bullish intent and supporting the validity of the flag breakout. The volume spike following a low-volume consolidation aligns perfectly with classic flag behavior. 2. Crucial Support and Resistance Levels Support Levels: ₹1,415: Flag base and immediate support zone. ₹1,375: Prior short-term pivot low. ₹1,300: Pre-rally accumulation base. Resistance Levels: ₹1,472–₹1,480: Immediate post-breakout reaction zone. ₹1,525–₹1,550: Projected target range based on pole height. ₹1,600+: Psychological round number and next possible resistance zone. Price must hold above ₹1,415 to keep the breakout structure valid. 3. Strategic Trade Scenarios 🔹 Bullish Continuation Setup: A sustained close above ₹1,470 backed by volume confirms the pole & flag breakout. Targets lie around ₹1,525–₹1,550 based on measured move, with potential for ₹1,600+ on continued strength. 🔸 Breakout Failure Scenario: If the price falls back below ₹1,415 and re-enters the consolidation, the breakout would be considered failed. In that case, expect range-bound action or a retest toward ₹1,375.
Price Action
- ■Price action is structurally positive.
- ■Forming higher highs and higher lows.
Volume Profile
- ■Volume is supportive of the price action.
- ■Wait for volume expansion on breakout.
Key Levels
No zones specified
No zones specified
Invalidation Scenario
A weekly close below the support level invalidates this structure.
Nestle India Ltd.
bullish fnoDouble Bottom Breakout
Daily Chart
Thesis & Analysis
No detailed thesis provided for this setup.
Price Action
- ■Price action is structurally positive.
- ■Forming higher highs and higher lows.
Volume Profile
- ■Volume is supportive of the price action.
- ■Wait for volume expansion on breakout.
Key Levels
No zones specified
No zones specified
Invalidation Scenario
A weekly close below the support level invalidates this structure.
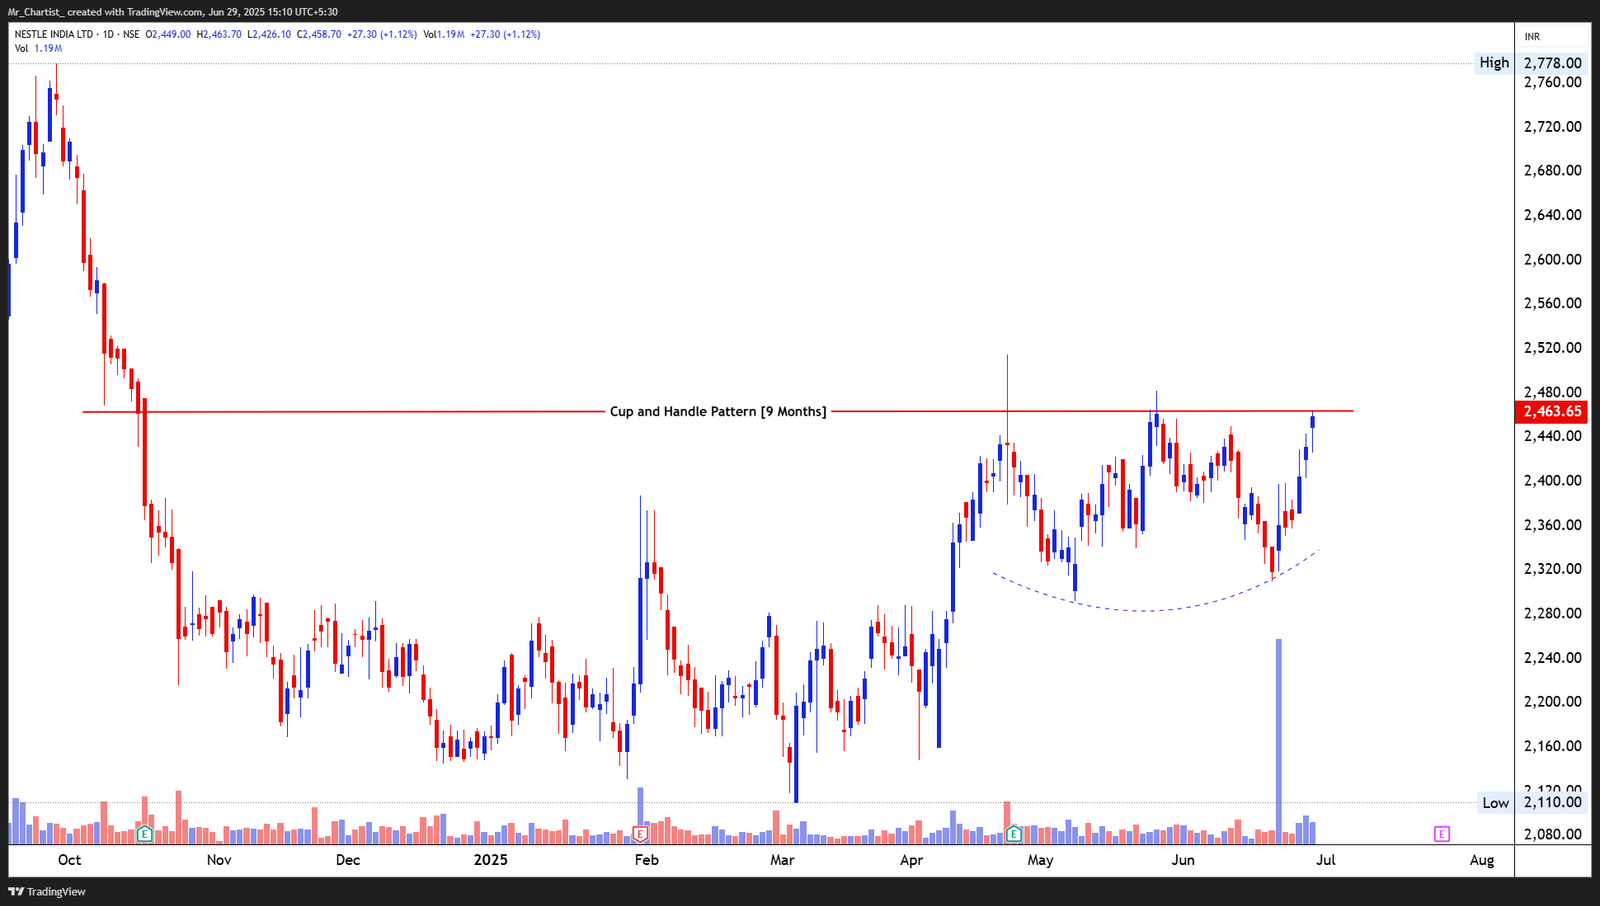
NESTLE INDIA LTD.
bullish fnoRecent candles show bullish momentum, with a clean upward series of higher lows and
~9 Months (Cup Base + Handle Formation)
Thesis & Analysis
Price Action Overview: Nestle India has developed a Cup and Handle pattern over the past 9 months, a bullish continuation setup that suggests accumulation before a breakout. The stock formed a rounded base (the cup), followed by a downward-sloping handle between May and June. Price has now rebounded toward the ₹2,480 neckline, showing signs of breakout preparation. The smooth curvature of the cup and the shallow pullback in the handle strengthen this setup. Candlestick Pattern: Recent candles show bullish momentum, with a clean upward series of higher lows and higher closes. Today’s small-bodied candle reflects minor hesitation near the breakout point, typical just before confirmation. Volume Analysis: There was a significant volume spike during the right side of the cup and on early handle breakout attempts—indicating institutional buildup. A strong volume thrust on breakout above ₹2,480 would be a key validation trigger. 2. Crucial Support and Resistance Levels Support Levels: ₹2,420: Short-term support at the top of the handle. ₹2,360: Lower handle base and near-term demand zone. ₹2,280: Mid-cup base; key structural support level. Resistance Levels: ₹2,480: Cup rim and breakout trigger. ₹2,600–₹2,620: Measured move target post breakout. ₹2,775: All-time high and long-term resistance zone. Price remains in breakout watch zone. A close above ₹2,480 with volume will confirm directional bias. 3. Strategic Trade Scenarios 🔹 Bullish Breakout Setup: A breakout above ₹2,480 with expanded volume would activate the cup and handle pattern. Projected upside targets lie in the ₹2,600–₹2,620 zone, with scope for further extension toward ₹2,775. 🔸 Handle Extension / Breakdown Setup: If price fails to breach ₹2,480 and pulls back below ₹2,420, it may extend the handle phase or consolidate further toward ₹2,360 before another breakout attempt.
Price Action
- ■Price action is structurally positive.
- ■Forming higher highs and higher lows.
Volume Profile
- ■Volume is supportive of the price action.
- ■Wait for volume expansion on breakout.
Key Levels
No zones specified
No zones specified
Invalidation Scenario
A weekly close below the support level invalidates this structure.
Divi’s Laboratories Ltd.
bullish fnoDouble Bottom Breakout
Daily Chart
Thesis & Analysis
No detailed thesis provided for this setup.
Price Action
- ■Price action is structurally positive.
- ■Forming higher highs and higher lows.
Volume Profile
- ■Volume is supportive of the price action.
- ■Wait for volume expansion on breakout.
Key Levels
No zones specified
No zones specified
Invalidation Scenario
A weekly close below the support level invalidates this structure.
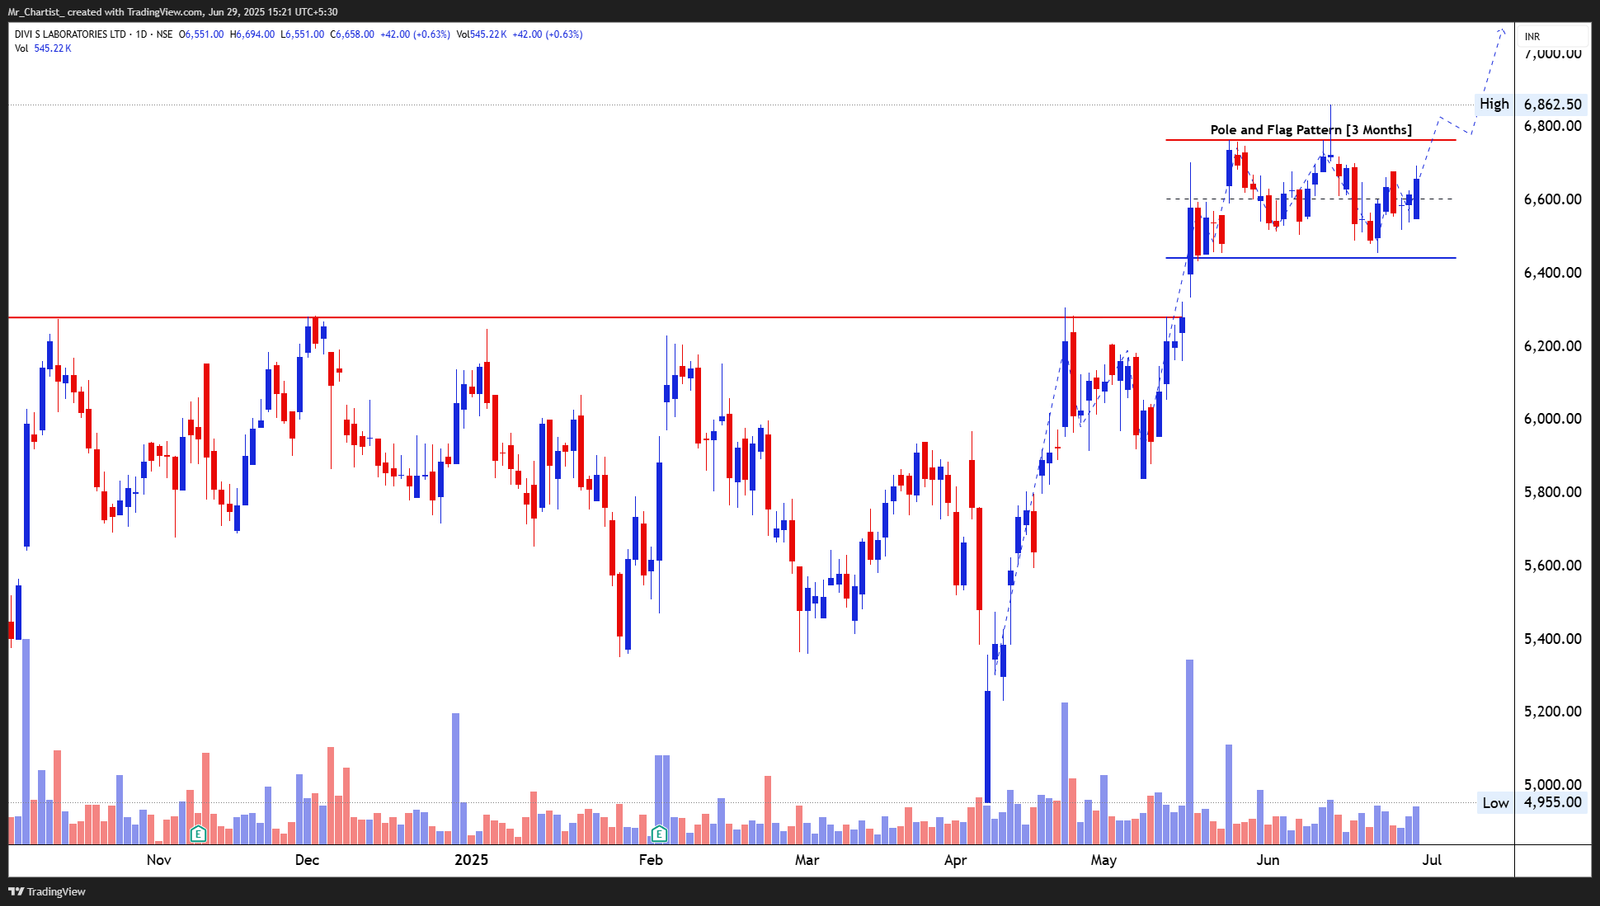
DIVI’S LABORATORIES LTD.
bullish fnoRecent candles exhibit narrow ranges with higher lows, reflecting contraction and
~3 Months (Flag consolidation following April-May rally)
Thesis & Analysis
Price Action Overview: Divi’s Labs has formed a Pole and Flag continuation pattern, with a strong vertical rally (the pole) from early April to mid-May, followed by a 3-month sideways consolidation between ₹6,450 and ₹6,750. The stock is now hovering near the upper resistance of the flag, indicating a potential breakout attempt. Price has respected the lower end of the flag, showing tight range price action—often a precursor to directional resolution. Candlestick Pattern: Recent candles exhibit narrow ranges with higher lows, reflecting contraction and potential breakout pressure. The latest bullish candle sits near the upper flag edge, hinting at breakout readiness. Volume Analysis: Volume spiked during the pole phase and has contracted during the flag consolidation —textbook flag behavior. A breakout above ₹6,750 with volume surge would confirm pattern resolution. 2. Crucial Support and Resistance Levels Support Levels: ₹6,450: Lower flag boundary and immediate support. ₹6,200: Post-breakout base from April; strong accumulation area. ₹5,950: Deeper correction support; prior resistance turned demand. Resistance Levels: ₹6,750: Flag resistance and breakout trigger. ₹6,862: Previous high; minor barrier. ₹7,000+: Round number target and projected move from pole height. Holding above ₹6,450 keeps the flag pattern valid. Breakout above ₹6,750 is the key confirmation level. 3. Strategic Trade Scenarios 🔹 Bullish Continuation Setup: A breakout above ₹6,750 with strong volume would activate the flag pattern, projecting upside targets toward ₹6,900–₹7,000 in the near term. 🔸 Breakout Failure / Pullback Scenario: If price fails to cross ₹6,750 and breaks below ₹6,450, it may invalidate the flag structure and revisit ₹6,200–₹5,950 for fresh accumulation.
Price Action
- ■Price action is structurally positive.
- ■Forming higher highs and higher lows.
Volume Profile
- ■Volume is supportive of the price action.
- ■Wait for volume expansion on breakout.
Key Levels
No zones specified
No zones specified
Invalidation Scenario
A weekly close below the support level invalidates this structure.
Bandhan Bank Ltd.
bullish fnoDouble Bottom Breakout
Daily Chart
Thesis & Analysis
No detailed thesis provided for this setup.
Price Action
- ■Price action is structurally positive.
- ■Forming higher highs and higher lows.
Volume Profile
- ■Volume is supportive of the price action.
- ■Wait for volume expansion on breakout.
Key Levels
No zones specified
No zones specified
Invalidation Scenario
A weekly close below the support level invalidates this structure.
Chart Image Not Extracted
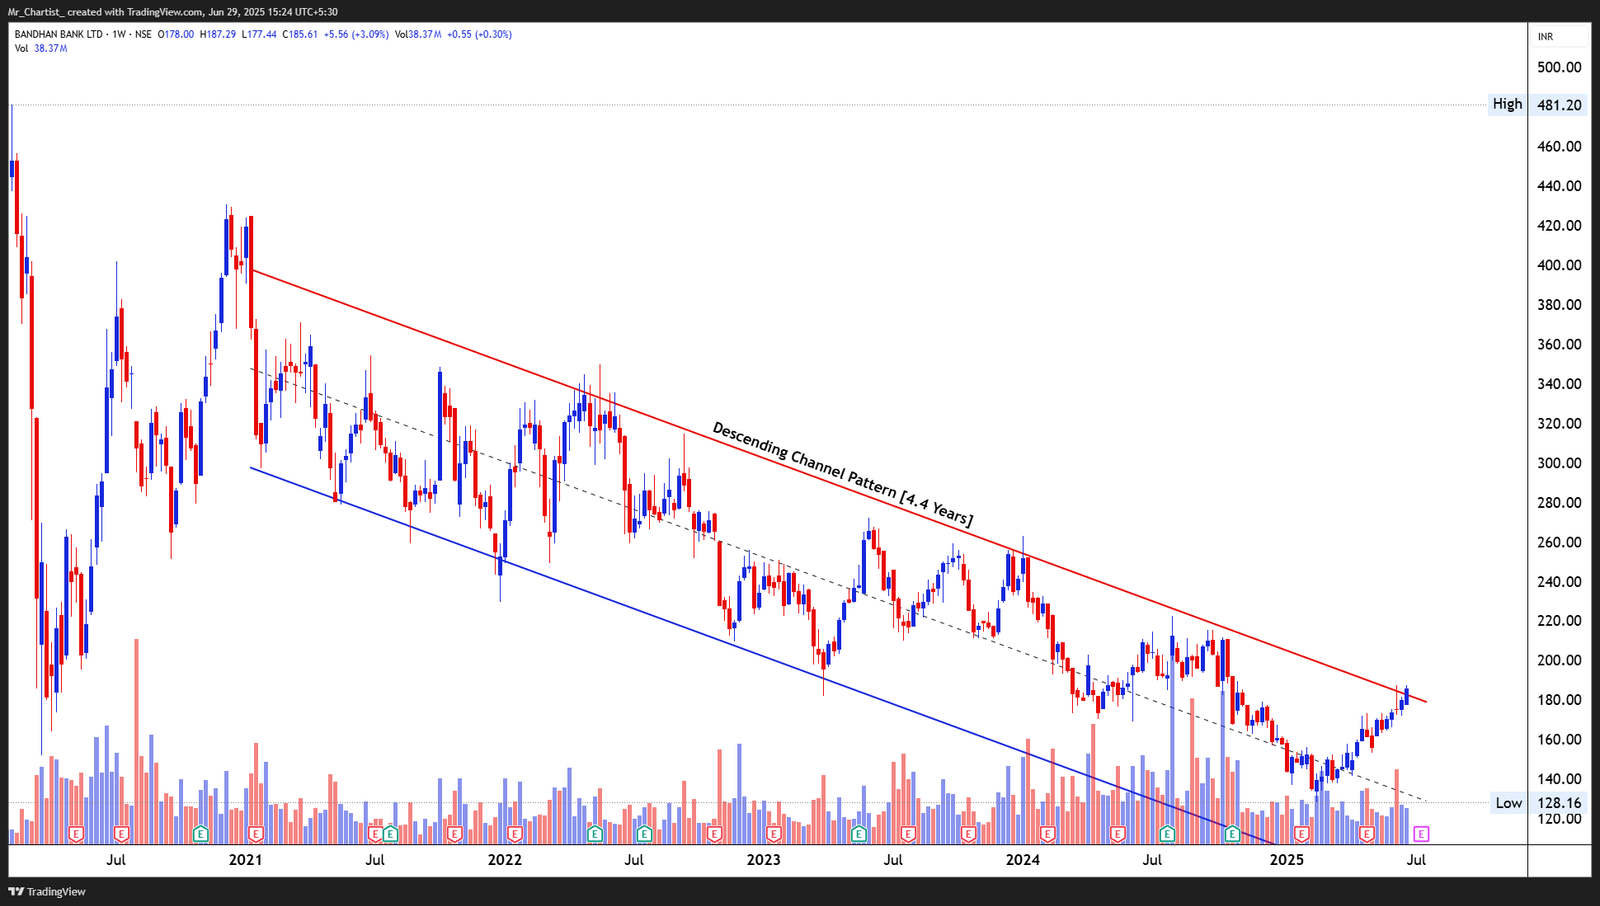
BANDHAN BANK LTD.
bullish fnoThe recent candles show a firm recovery from the bottom of the channel with
~4.4 Years (Mid-2020 to Present)
Thesis & Analysis
Price Action Overview: Bandhan Bank has been trading within a well-defined descending channel for over 4 years, consistently respecting both the upper resistance and lower support trendlines. The stock recently rebounded sharply from the lower boundary near ₹130 and is now testing the upper channel resistance around ₹185–₹190. This area marks a decisive zone—either for a breakout or another leg of downward channel continuation. Candlestick Pattern: The recent candles show a firm recovery from the bottom of the channel with increasing body sizes, but this week’s rejection near the upper trendline indicates supply pressure. Price action is compressing near resistance. Volume Analysis: Volume has steadily increased in the recent upmove, hinting at accumulation. A volume breakout above the channel resistance would be required for any structural trend reversal confirmation. 2. Crucial Support and Resistance Levels Support Levels: ₹175: Immediate zone just below current price. ₹160: Recent swing low in the ongoing leg up. ₹130: Long-term channel base and structural low. Resistance Levels: ₹190–₹195: Channel resistance zone; key breakout level. ₹210: Intermediate horizontal resistance. ₹240–₹260: Major supply zone from earlier channel tests. Channel breakout confirmation would require a sustained move above ₹195 with strength. 3. Strategic Trade Scenarios 🔹 Trend Reversal Breakout Setup: If price breaks and sustains above ₹195 on strong volume, it may trigger a multi- quarter breakout, setting up for a trend reversal toward ₹210–₹240+. 🔸 Channel Rejection Scenario: Failure to break above the upper trendline could lead to a pullback toward ₹175 or ₹160, and if momentum fades further, a retest of ₹130 is possible within the broader channel.
Price Action
- ■Price action is structurally positive.
- ■Forming higher highs and higher lows.
Volume Profile
- ■Volume is supportive of the price action.
- ■Wait for volume expansion on breakout.
Key Levels
No zones specified
No zones specified
Invalidation Scenario
A weekly close below the support level invalidates this structure.
Bearish Charts [F&O]
Short setups indicating weakness
OIL INDIA LTD.
bearish fnoDouble Bottom Breakout
Daily Chart
Thesis & Analysis
No detailed thesis provided for this setup.
Price Action
- ■Price action is structurally positive.
- ■Forming higher highs and higher lows.
Volume Profile
- ■Volume is supportive of the price action.
- ■Wait for volume expansion on breakout.
Key Levels
No zones specified
No zones specified
Invalidation Scenario
A weekly close below the support level invalidates this structure.
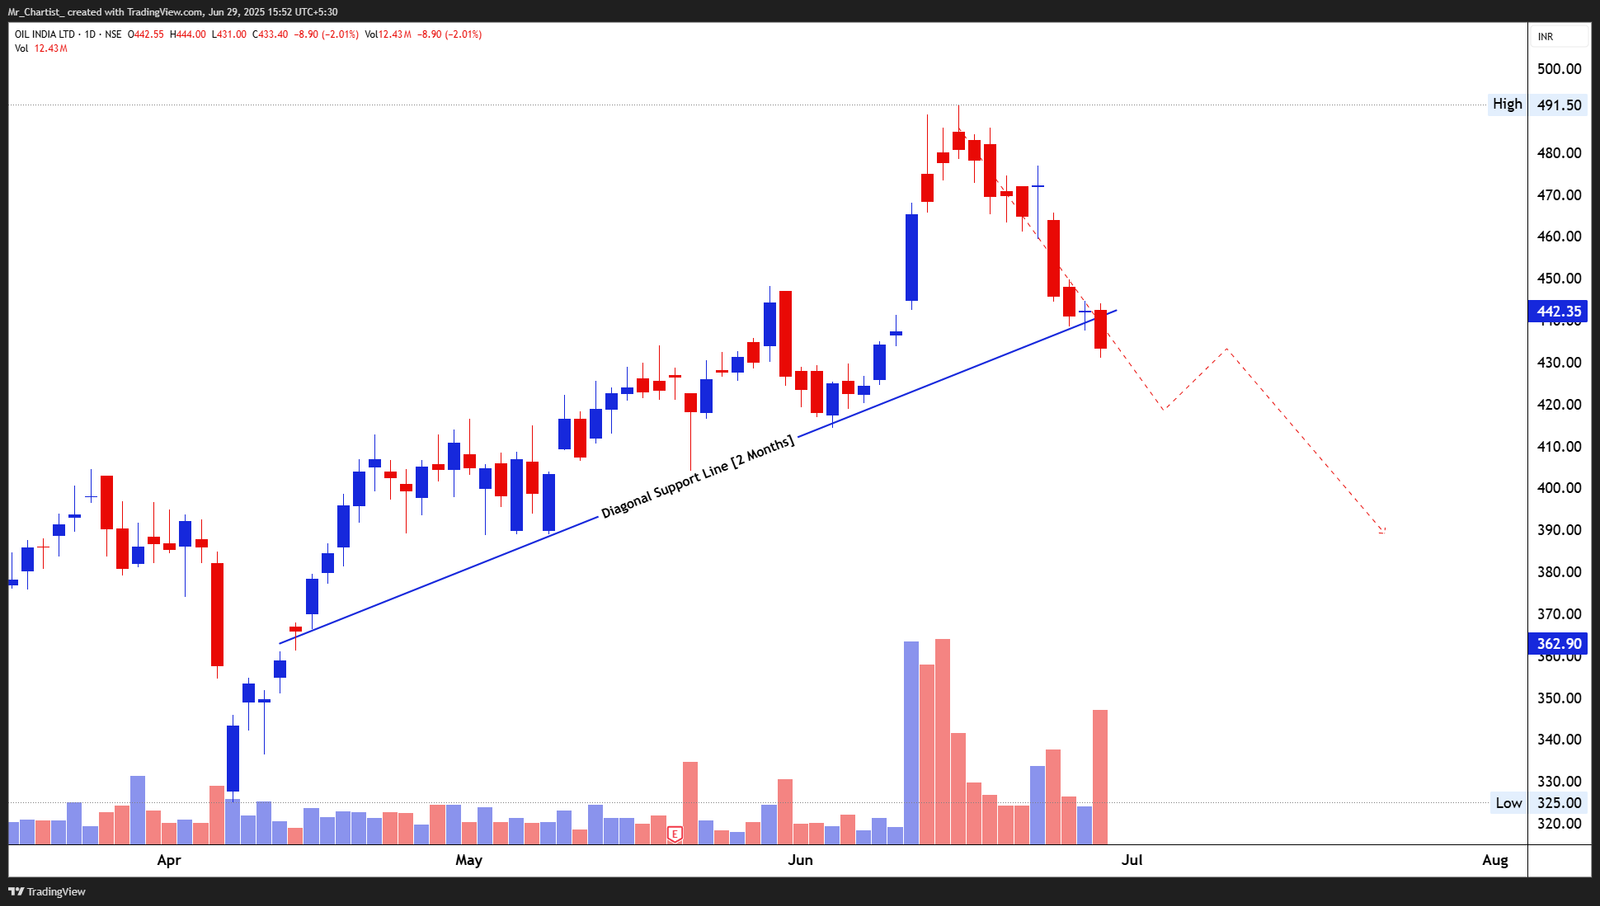
OIL INDIA LTD.
bearish fnoThe latest sessions exhibit large-bodied bearish candles with strong follow-
~2 Months Uptrend (Support Line Broken)
Thesis & Analysis
Price Action Overview: Oil India has broken below a 2-month diagonal support line, signaling a technical breakdown from its recent uptrend. The price had been trending higher steadily, but recent selling pressure has accelerated, confirmed by a decisive close below the trendline. The steep sequence of lower highs and strong bearish candles suggests a shift in sentiment from bullish to corrective. Candlestick Pattern: The latest sessions exhibit large-bodied bearish candles with strong follow- through. The breakdown candle closed well below the support line, showing clear momentum on the downside. Volume Analysis: Volume has expanded significantly over the past few sessions—particularly during the breakdown—which strengthens the bearish case. Elevated red volume bars indicate aggressive selling activity. 2. Crucial Support and Resistance Levels Support Levels: ₹420: Minor interim support from previous price congestion. ₹400: Round-number support and psychological level. ₹362–₹365: Major support from April’s breakout base. Resistance Levels: ₹445: Former trendline zone; now turned resistance. ₹460: Last failed swing high before breakdown. ₹491.50: Recent high; invalidation level for bearish structure. The structure now favors lower levels as long as price stays below ₹445. 3. Strategic Trade Scenarios 🔻 Breakdown Continuation Setup: If the price sustains below ₹445 with continued volume buildup, further downside toward ₹400 and ₹362 looks probable. Watch for weak bounce attempts as shorting opportunities below resistance. 🔸 False Breakdown Scenario: If the stock reclaims the ₹445 zone quickly and closes back above the trendline, the breakdown would be invalidated, and a return to ₹460–₹470 levels may follow.
Price Action
- ■Price action is structurally positive.
- ■Forming higher highs and higher lows.
Volume Profile
- ■Volume is supportive of the price action.
- ■Wait for volume expansion on breakout.
Key Levels
No zones specified
No zones specified
Invalidation Scenario
A weekly close below the support level invalidates this structure.
PRESTIGE ESTATES LTD.
bearish fnoDouble Bottom Breakout
Daily Chart
Thesis & Analysis
No detailed thesis provided for this setup.
Price Action
- ■Price action is structurally positive.
- ■Forming higher highs and higher lows.
Volume Profile
- ■Volume is supportive of the price action.
- ■Wait for volume expansion on breakout.
Key Levels
No zones specified
No zones specified
Invalidation Scenario
A weekly close below the support level invalidates this structure.
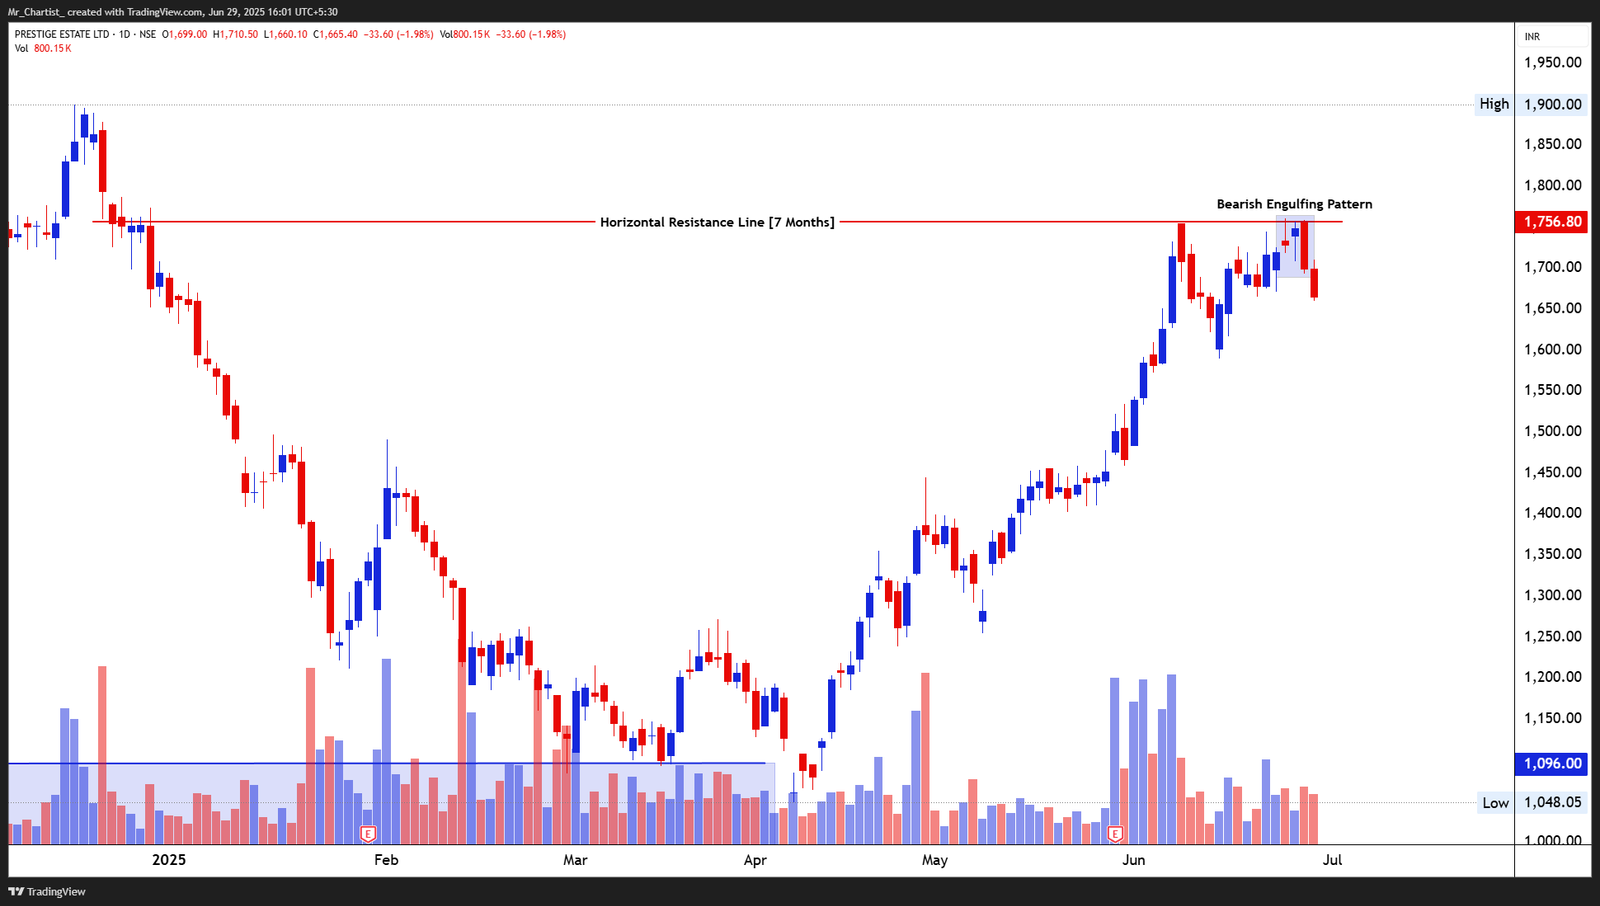
PRESTIGE ESTATES LTD.
bearish fnoThe bearish engulfing candle has fully engulfed the prior day’s body and closed
7-Month Resistance Test
Thesis & Analysis
Price Action Overview: Prestige Estates approached a long-standing horizontal resistance zone at ₹1,756, which has capped price advances since late 2023. After a strong rally into this zone, the price has formed a bearish engulfing pattern, signaling a potential reversal. This reversal pattern appears right at a critical inflection point, making it a meaningful signal. The sharp rejection and follow-through selling suggest buyer exhaustion and increased supply near resistance. Candlestick Pattern: The bearish engulfing candle has fully engulfed the prior day’s body and closed near the session low—confirming control shifting to sellers. This is a classic reversal signal, especially when appearing at a key horizontal resistance. Volume Analysis: Volume during the engulfing session was moderately high, indicating participation in the sell-off. Recent sessions also showed tapering bullish volume near resistance —often a sign of weakening momentum. 2. Crucial Support and Resistance Levels Support Levels: ₹1,620: Near-term swing support. ₹1,530: Last consolidation zone during the uptrend. ₹1,400–₹1,380: Intermediate structure and potential retracement zone. Resistance Levels: ₹1,756: Major multi-month horizontal resistance. ₹1,800: Minor psychological resistance. ₹1,900: 52-week high; upper bound for long-term projection. Failure to reclaim ₹1,756 soon keeps the bearish structure active. 3. Strategic Trade Scenarios 🔻 Reversal / Breakdown Setup: A continued move below ₹1,620 would validate the bearish engulfing pattern, potentially leading to a correction toward ₹1,530–₹1,400. Lower highs on minor pullbacks would strengthen the reversal structure. 🔸 Failed Breakdown Scenario: If price reclaims ₹1,756 decisively with volume, it would negate the bearish setup and open the path toward ₹1,800 and ₹1,900.
Price Action
- ■Price action is structurally positive.
- ■Forming higher highs and higher lows.
Volume Profile
- ■Volume is supportive of the price action.
- ■Wait for volume expansion on breakout.
Key Levels
No zones specified
No zones specified
Invalidation Scenario
A weekly close below the support level invalidates this structure.
DR. REDDY’S LABS
bearish fnoDouble Bottom Breakout
Daily Chart
Thesis & Analysis
No detailed thesis provided for this setup.
Price Action
- ■Price action is structurally positive.
- ■Forming higher highs and higher lows.
Volume Profile
- ■Volume is supportive of the price action.
- ■Wait for volume expansion on breakout.
Key Levels
No zones specified
No zones specified
Invalidation Scenario
A weekly close below the support level invalidates this structure.
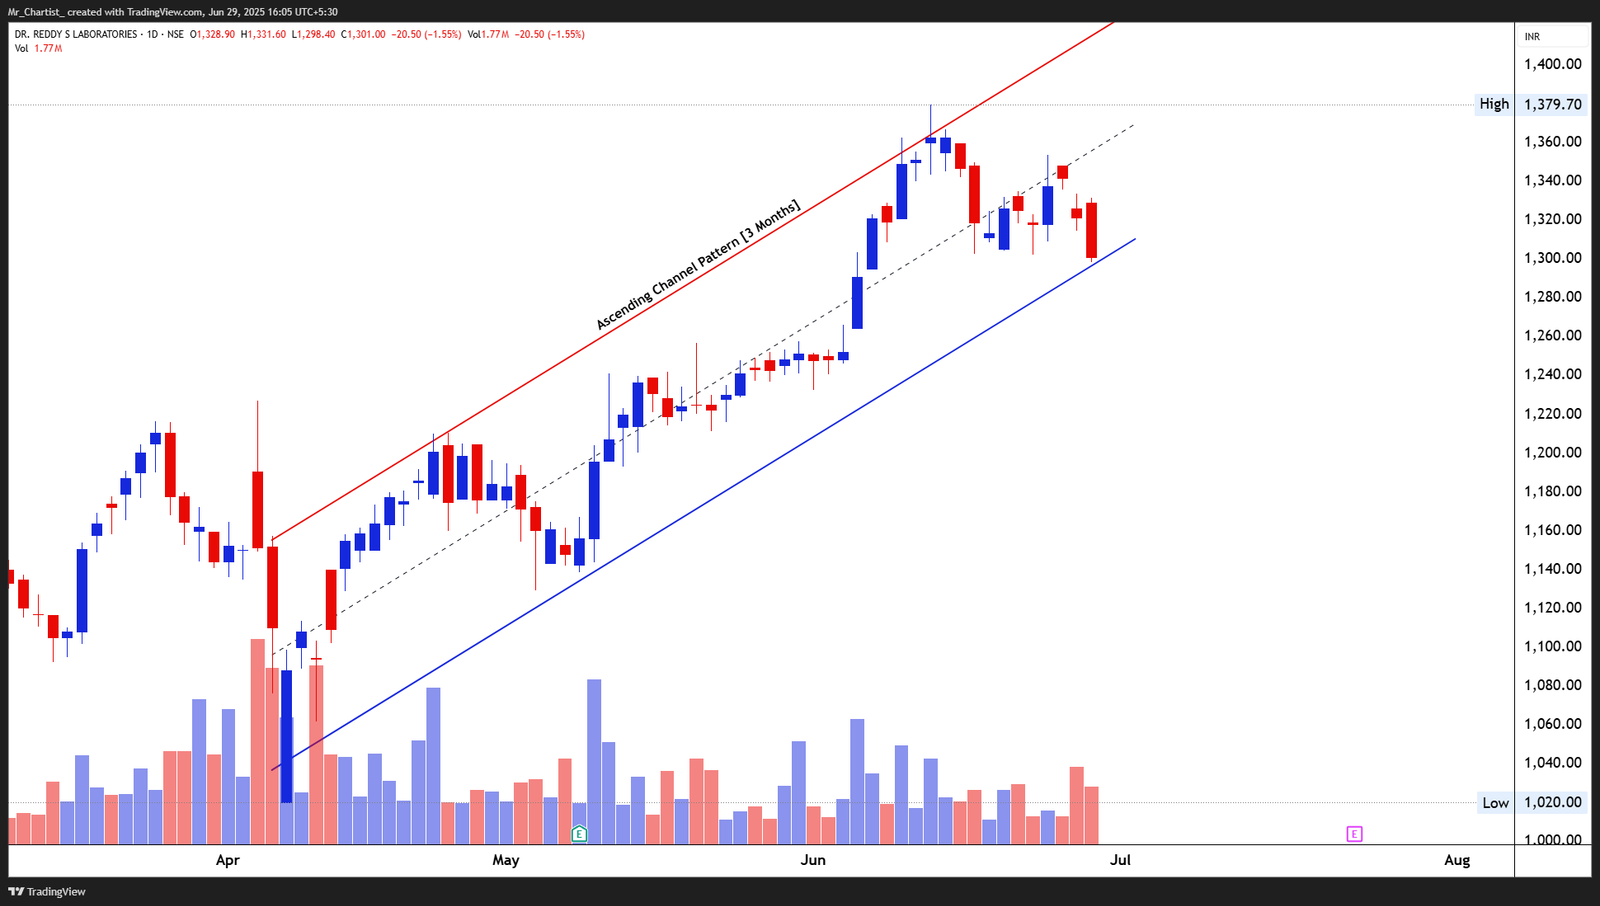
DR. REDDY’S LABS
bearish fnoA strong bearish candle has formed without lower wick rejection, reflecting
~3 Months of Uptrend
Thesis & Analysis
Price Action Overview: The stock has been steadily climbing within a well-formed ascending channel, with clean respect for both upper and lower trendlines. Recently, however, price action has turned weak near the mid-channel zone and is now approaching the lower channel boundary, showing signs of deceleration. The latest candle is a large-bodied red candle—nearly a bearish marubozu— suggesting momentum loss and potential pressure on the lower trendline. Candlestick Pattern: A strong bearish candle has formed without lower wick rejection, reflecting aggressive intraday selling. Volume Analysis: Volume has risen on the current down-move, indicating increased participation on the downside. This could lead to a test of channel support or a breakdown if support fails. 2. Crucial Support and Resistance Levels Support Levels: ₹1,290: Lower ascending trendline—critical level for channel preservation. ₹1,250: Recent swing low and structure base. ₹1,200: Round number and prior accumulation zone. Resistance Levels: ₹1,360: Mid-channel resistance and local high. ₹1,380–₹1,390: Channel top, last rejection zone. Price is vulnerable unless it stabilizes above the trendline with buying response. 3. Strategic Trade Scenarios 🔸 Channel Breakdown Scenario: If price breaks and closes below ₹1,290 with volume, it would indicate a pattern failure and may trigger a descent toward ₹1,250–₹1,200. Watch for bearish follow- through or gap-down moves as confirmation. 🔹 Channel Bounce Setup: A bullish reversal candle near ₹1,290 with declining volume followed by a spike would keep the ascending structure intact, offering scope to revisit ₹1,360 and above.
Price Action
- ■Price action is structurally positive.
- ■Forming higher highs and higher lows.
Volume Profile
- ■Volume is supportive of the price action.
- ■Wait for volume expansion on breakout.
Key Levels
No zones specified
No zones specified
Invalidation Scenario
A weekly close below the support level invalidates this structure.
IIFL FINANCE
bearish fnoDouble Bottom Breakout
Daily Chart
Thesis & Analysis
No detailed thesis provided for this setup.
Price Action
- ■Price action is structurally positive.
- ■Forming higher highs and higher lows.
Volume Profile
- ■Volume is supportive of the price action.
- ■Wait for volume expansion on breakout.
Key Levels
No zones specified
No zones specified
Invalidation Scenario
A weekly close below the support level invalidates this structure.
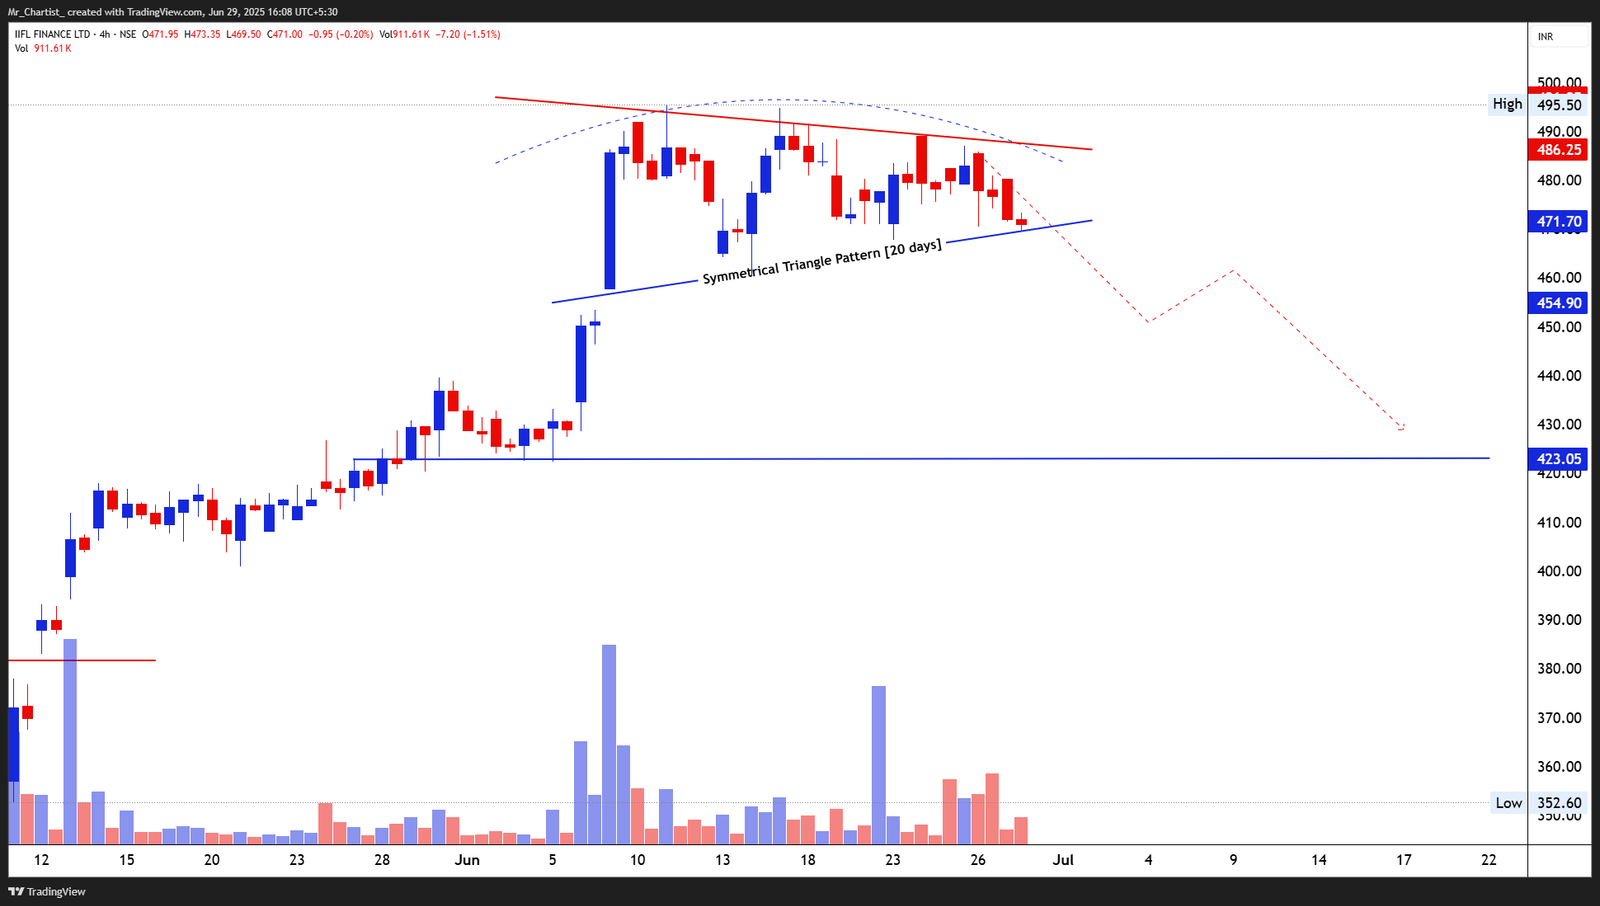
IIFL FINANCE
bearish fnoMultiple red-bodied candles are clustering near support with weak or no lower wicks—a sign
20 Days (4H Chart – Short-Term Compression Phase)
Thesis & Analysis
Price Action Overview: Following a steep upward rally, IIFL Finance has entered a symmetrical triangle pattern, characterized by a tightening range of lower highs and higher lows—a sign of short-term price compression. This typically reflects indecision but often resolves in the direction of the preceding trend. The recent development of a minor rounding top formation inside the triangle further suggests a shift from momentum to distribution. Candles near the lower boundary show persistent pressure, with price staying close to the support line—an indication that buyers are either exhausted or stepping back. Candlestick Pattern: Multiple red-bodied candles are clustering near support with weak or no lower wicks—a sign of controlled selling and lack of immediate demand. The absence of bullish reversal patterns reinforces short-term caution. Volume Analysis: Volume inside the pattern has gradually contracted—a typical triangle behavior—while selective spikes on red candles suggest aggressive selling on minor rallies. This mix signals latent bearish strength, and a breakout with volume would affirm the setup. 2. Crucial Support and Resistance Levels Support Levels: ₹471: Immediate triangle base—key decision point in the short term. ₹454.90: Minor swing low and probable initial landing zone if breakdown occurs. ₹423.05: Broader structural support from previous base—anchor zone for trend reassessment. Resistance Levels: ₹486.25: Downsloping upper triangle boundary—first resistance in case of reversal. ₹495.50: Recent swing high; breakout failure point—major resistance and invalidation level for bearish bias. Unless the price decisively closes above ₹486.25 with range expansion, resistance remains intact. 3. Strategic Trade Scenarios 🔸 Breakdown Continuation Setup: If price breaches ₹471 with strong bearish volume, the triangle breakdown confirms. Downside may extend to ₹455 initially, followed by a broader retracement to ₹423.05, which has acted as a key structural pivot in recent weeks. This setup would validate a distribution outcome post compression. 🔹 Bounce Reversal Setup: If the price defends ₹471 with a bullish reversal candle (e.g., hammer or bullish engulfing) and sees volume pick-up, it may suggest the lower boundary is attracting demand. A move past ₹486.25 would then flip the pattern bullish, opening a possible retest of ₹495.50–₹500, where prior selling emerged.
Price Action
- ■Price action is structurally positive.
- ■Forming higher highs and higher lows.
Volume Profile
- ■Volume is supportive of the price action.
- ■Wait for volume expansion on breakout.
Key Levels
No zones specified
No zones specified
Invalidation Scenario
A weekly close below the support level invalidates this structure.
LTIMINDTREE
bearish fnoDouble Bottom Breakout
Daily Chart
Thesis & Analysis
No detailed thesis provided for this setup.
Price Action
- ■Price action is structurally positive.
- ■Forming higher highs and higher lows.
Volume Profile
- ■Volume is supportive of the price action.
- ■Wait for volume expansion on breakout.
Key Levels
No zones specified
No zones specified
Invalidation Scenario
A weekly close below the support level invalidates this structure.
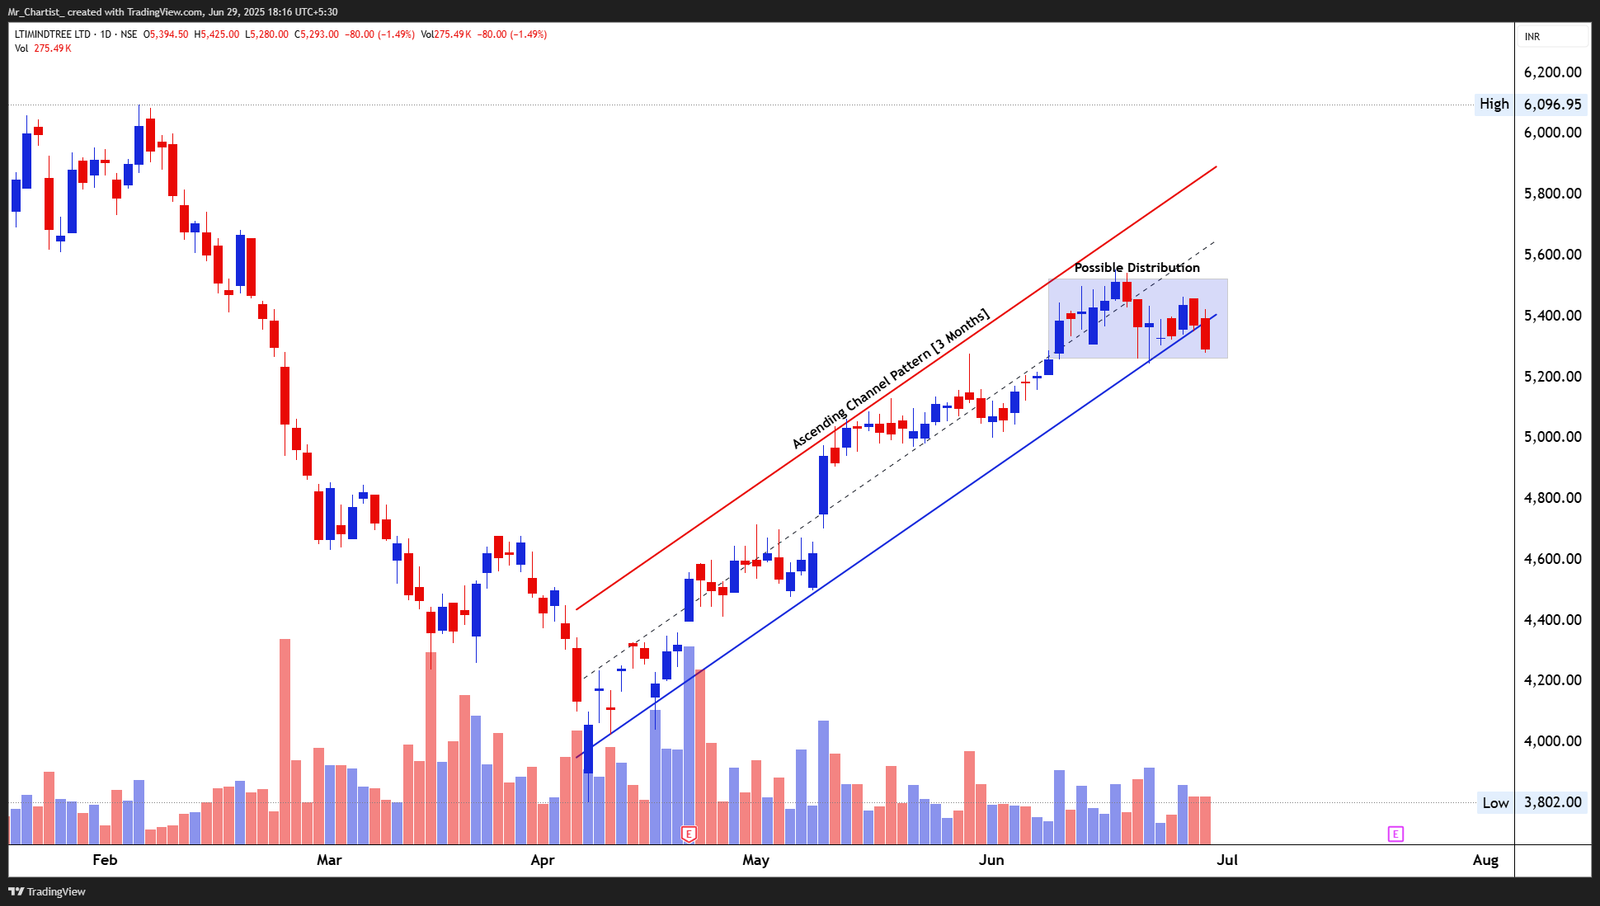
LTIMINDTREE
bearish fnoA series of bearish candles with minimal lower wicks within the rectangle zone imply that
3 Months (Daily Chart)
Thesis & Analysis
Price Action Overview: After a strong recovery from the March lows, LTIMindtree has steadily climbed within a well-defined ascending channel. However, recent price action in the last 2–3 weeks has shown signs of distribution near the upper half of the channel, where prices have stalled and formed a tight consolidation range. The candles within this range show lower closes and frequent upper wicks, hinting at supply emergence. The last few sessions exhibit a bearish bias within this distribution zone, with today's wide- range red candle breaching short-term support inside the channel—raising caution for a potential shift in structure. Candlestick Pattern: A series of bearish candles with minimal lower wicks within the rectangle zone imply that demand is weakening. The current candle broke below the distribution box with volume expansion, reinforcing near-term bearishness. Volume Analysis: Volumes spiked during the initial uptrend but have since flattened during consolidation, a classic sign of absorption. Today’s higher volume red candle is notable—it suggests the possibility of a distribution phase culminating into a breakdown, unless quickly reversed. 2. Crucial Support and Resistance Levels Support Levels: ₹5,260–5,240: Lower edge of distribution zone; first defense for bulls. ₹5,080: Mid-channel level and prior consolidation zone; could attract buyers temporarily. ₹4,920: Lower channel boundary—key support for trend preservation. Resistance Levels: ₹5,420–5,460: Upper end of the distribution box; needs a decisive close above to reclaim bullish momentum. ₹5,600: Upper channel resistance—tested but never breached during the current up-leg. 3. Strategic Trade Scenarios 🔸 Breakdown & Channel Retest Setup: If price continues lower and sustains below ₹5,240 with volume follow-through, it opens downside potential toward ₹5,080, and eventually the ₹4,920 zone near the ascending channel base. This would confirm the distribution-to-decline transition. 🔹 False Breakdown & Reclaim Scenario: If the price stabilizes around ₹5,260 and forms a bullish reversal candle (e.g., morning star or bullish engulfing), followed by volume, the break may be invalidated. A move above ₹5,420–5,460 would reestablish strength and retarget the ₹5,600 zone.
Price Action
- ■Price action is structurally positive.
- ■Forming higher highs and higher lows.
Volume Profile
- ■Volume is supportive of the price action.
- ■Wait for volume expansion on breakout.
Key Levels
No zones specified
No zones specified
Invalidation Scenario
A weekly close below the support level invalidates this structure.
NATIONAL ALUMINIUM
bearish fnoDouble Bottom Breakout
Daily Chart
Thesis & Analysis
No detailed thesis provided for this setup.
Price Action
- ■Price action is structurally positive.
- ■Forming higher highs and higher lows.
Volume Profile
- ■Volume is supportive of the price action.
- ■Wait for volume expansion on breakout.
Key Levels
No zones specified
No zones specified
Invalidation Scenario
A weekly close below the support level invalidates this structure.
Chart Image Not Extracted
NATIONAL ALUMINIUM
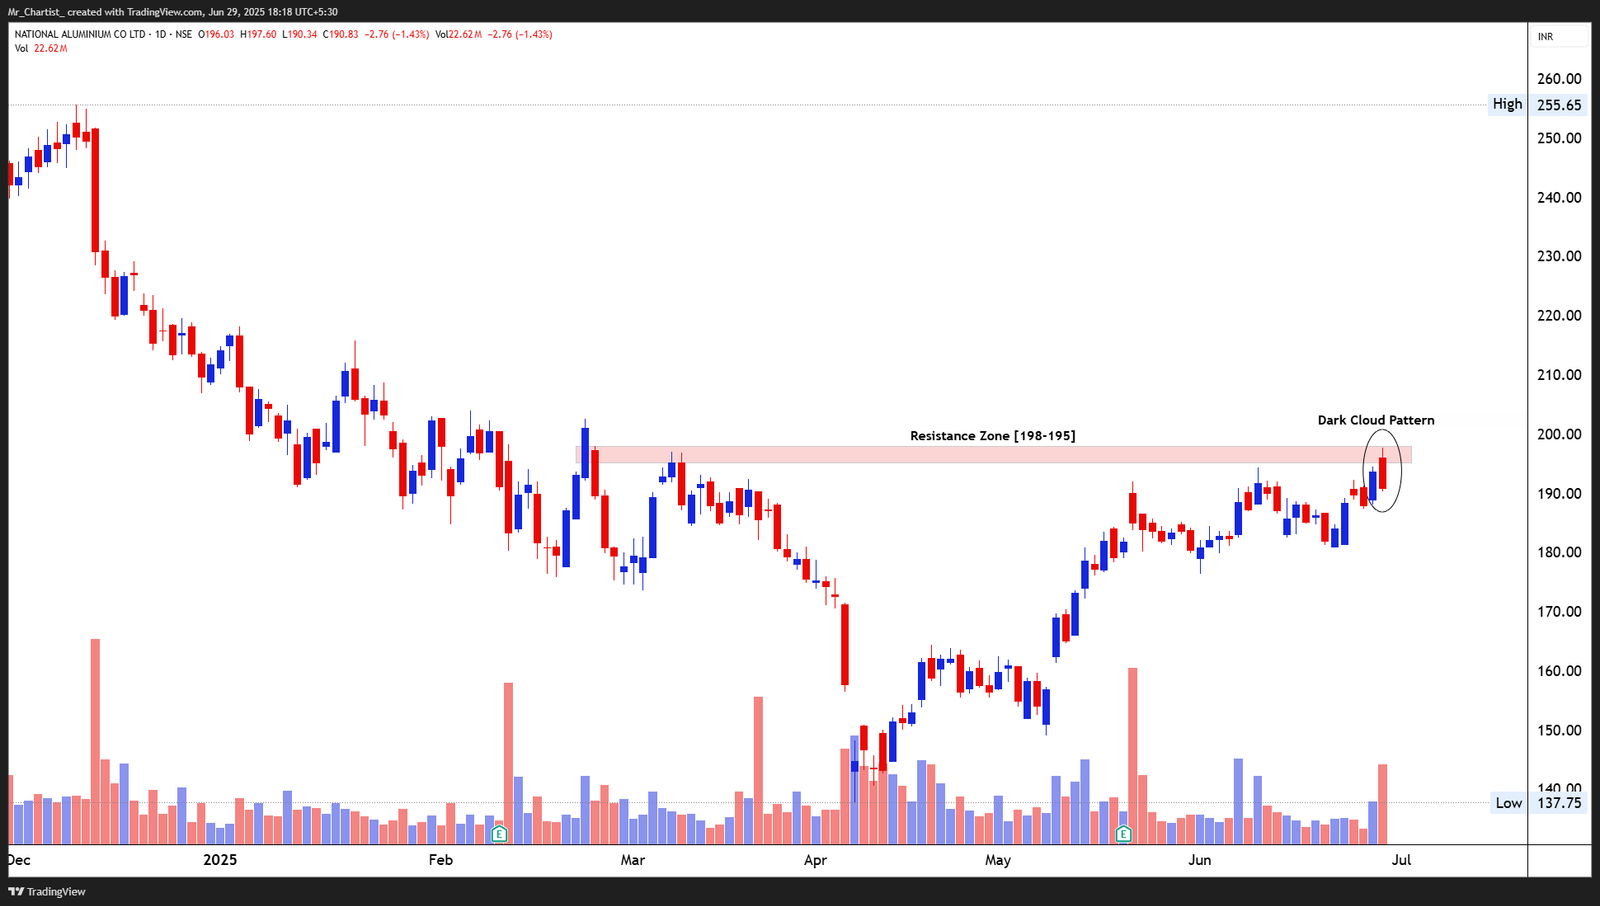
bearish fnoThe Dark Cloud Cover, a two-bar reversal pattern, signals that sellers are aggressively
7-Month Resistance Zone Retest
Thesis & Analysis
Price Action Overview: The stock recently rallied into a strong resistance zone between ₹195–₹198, which has historically acted as a supply shelf over the past several months. Upon re-approaching this zone, the price action slowed and formed a bearish Dark Cloud Cover pattern, hinting at buyer exhaustion and potential reversal pressure. The move into resistance came after a relatively sharp up-leg, indicating overextension and susceptibility to mean reversion. The rejection candle closed well into the prior bullish bar, creating a notable shift in sentiment. Candlestick Pattern: The Dark Cloud Cover, a two-bar reversal pattern, signals that sellers are aggressively defending the resistance zone. It formed precisely after price tagged the upper bound of the ₹195–₹198 band. Volume Analysis: Volume rose during the rejection candle, validating the bearish structure. This combination of price reversal and volume uptick within resistance elevates the credibility of the rejection. 2. Crucial Support and Resistance Levels Support Levels: ₹186: Immediate prior swing low. A breakdown here would confirm short-term weakness. ₹178: Consolidation base and a minor demand zone. ₹165: Major structural support and prior breakout level from May. Resistance Levels: ₹195–₹198: Strong overhead zone; multiple rejections observed over 7 months. ₹205: Only if price breaks out with volume, this would be the next upside resistance. 3. Strategic Trade Scenarios 🔸 Reversal Continuation Setup: If price breaks below ₹186 on higher volume, expect momentum to carry toward ₹178, potentially even to ₹165 in a continued retracement. This confirms the bearish implication of the Dark Cloud Cover. 🔹 Bullish Reclaim Scenario: Should price recover back above ₹198 with a bullish marubozu or gap-up and supportive volume, the resistance zone may get invalidated. That would re-open upside toward ₹205.
Price Action
- ■Price action is structurally positive.
- ■Forming higher highs and higher lows.
Volume Profile
- ■Volume is supportive of the price action.
- ■Wait for volume expansion on breakout.
Key Levels
No zones specified
No zones specified
Invalidation Scenario
A weekly close below the support level invalidates this structure.
PRIME FOCUS
bearish fnoDouble Bottom Breakout
Daily Chart
Thesis & Analysis
No detailed thesis provided for this setup.
Price Action
- ■Price action is structurally positive.
- ■Forming higher highs and higher lows.
Volume Profile
- ■Volume is supportive of the price action.
- ■Wait for volume expansion on breakout.
Key Levels
No zones specified
No zones specified
Invalidation Scenario
A weekly close below the support level invalidates this structure.
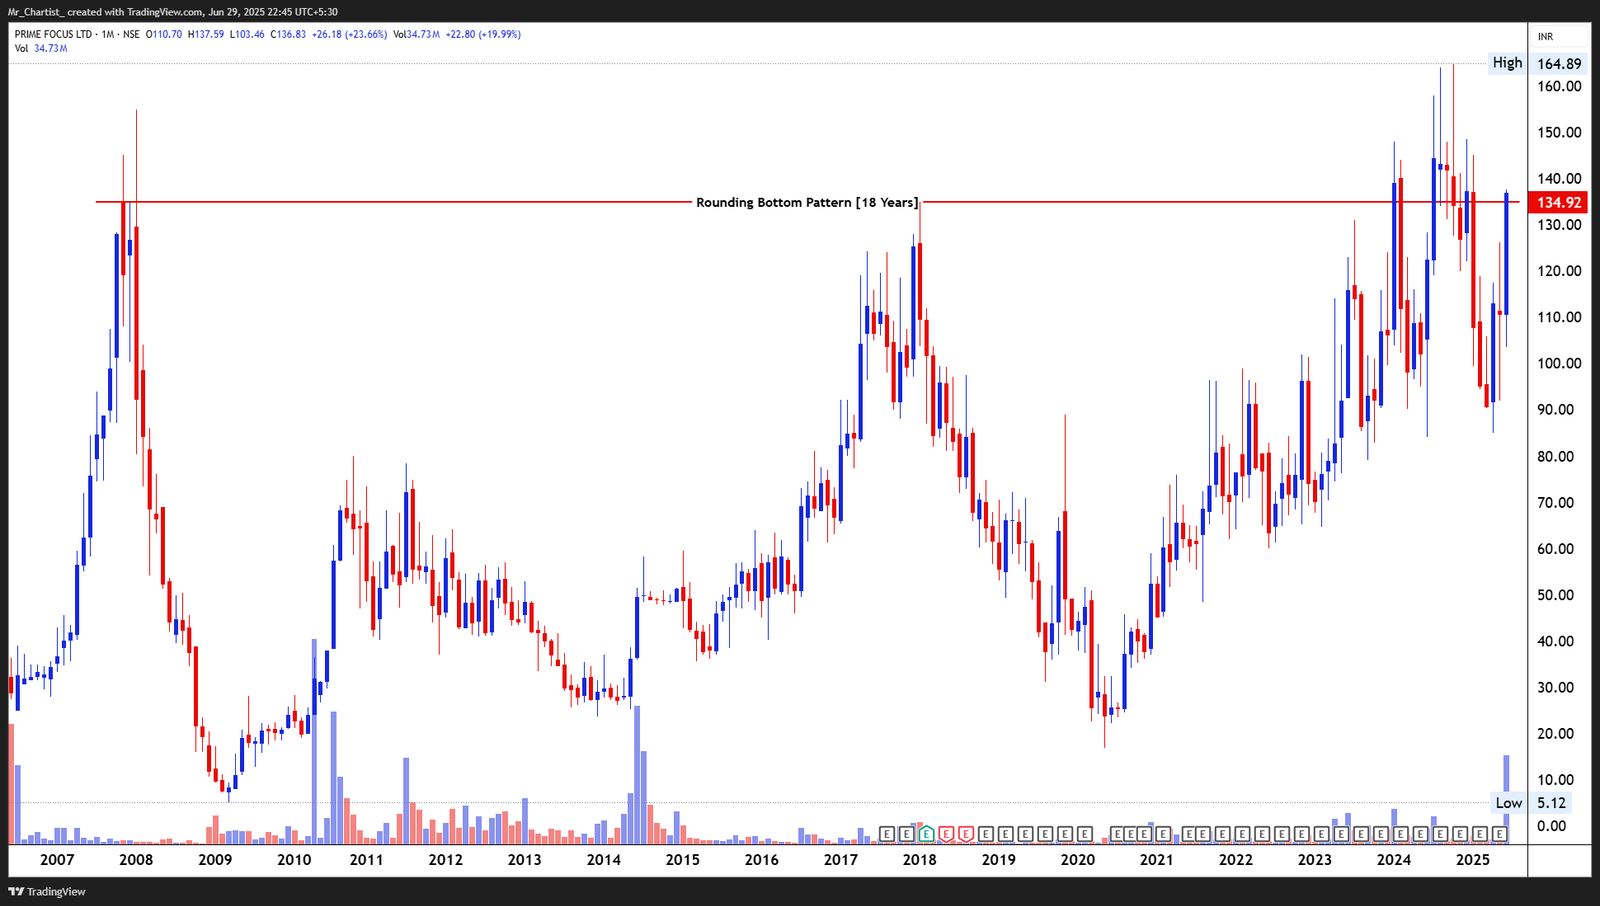
PRIME FOCUS
bearish fnoDouble Bottom Breakout
18-Year Monthly Chart
Thesis & Analysis
Price Action Overview: The stock has formed a classic Rounding Bottom over an 18-year period, a powerful accumulation and reversal structure indicating a gradual transition from long-term distribution to accumulation and eventual trend reversal. This pattern signifies sustained investor interest building over time, despite broad cycles of volatility and decline. After years of price contraction and base building between ₹10 and ₹90, the stock has finally reclaimed the ₹134.90 neckline, which had acted as a historical supply ceiling since 2007. This month's candle shows a significant breakout attempt, backed by a wide-bodied bullish range and aggressive follow-through. Candlestick Behavior: The current monthly candle is large and bullish, showing a strong price rejection from lower levels and confident follow-through beyond resistance. Prior months also display narrowing wicks and higher closes—a sign of growing conviction. Volume Analysis: Volume has exploded to multi-year highs, confirming institutional participation. This kind of volume on a monthly chart is rare and typically confirms the validity of a structural breakout from long accumulation. 2. Crucial Support and Resistance Levels Support Levels: ₹134.90: Neckline of the rounding bottom; a retest and hold will confirm breakout validity. ₹110: Last minor consolidation zone before breakout; a demand base. ₹90: Historical support and key psychological zone from 2021–2023. Resistance Levels: ₹164.89: Previous swing high from 2024; breakout target zone. ₹200: Round-number resistance if price sustains momentum; potential medium-term level. 3. Strategic Trade Scenarios 🔸 Breakout Continuation Setup: If price sustains above ₹134.90 on monthly closing basis, expect follow-through momentum toward ₹165 initially. Holding above this neckline with ongoing volume expansion would validate a structural breakout and initiate a potential long-term uptrend. 🔹 Retest and Rejection Setup: Should price dip back below ₹134.90 with weakness and fading volume, the breakout would be termed premature. In such a case, monitor ₹110 for base reformation. Breakdown below this would indicate failed breakout and reversion into prior range.
Price Action
- ■Price action is structurally positive.
- ■Forming higher highs and higher lows.
Volume Profile
- ■Volume is supportive of the price action.
- ■Wait for volume expansion on breakout.
Key Levels
No zones specified
No zones specified
Invalidation Scenario
A weekly close below the support level invalidates this structure.
SANGAM (INDIA) LTD
bearish fnoDouble Bottom Breakout
Daily Chart
Thesis & Analysis
No detailed thesis provided for this setup.
Price Action
- ■Price action is structurally positive.
- ■Forming higher highs and higher lows.
Volume Profile
- ■Volume is supportive of the price action.
- ■Wait for volume expansion on breakout.
Key Levels
No zones specified
No zones specified
Invalidation Scenario
A weekly close below the support level invalidates this structure.
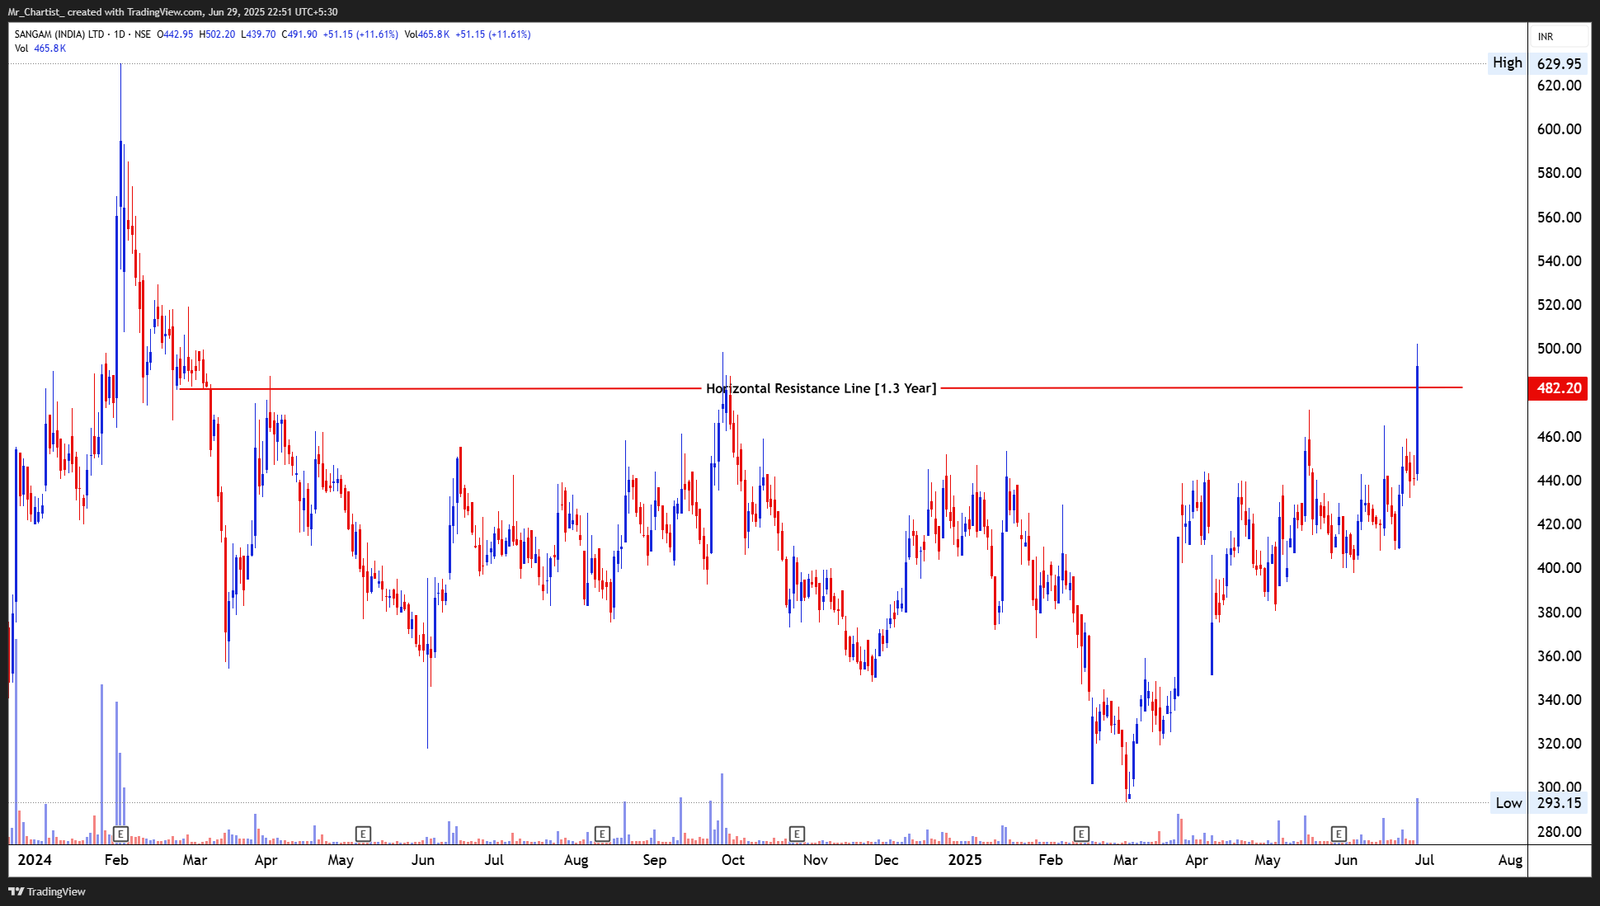
SANGAM (INDIA) LTD
bearish fnoDouble Bottom Breakout
1.3-Year Daily Chart Range
Thesis & Analysis
Price Action Overview: Sangam has been confined within a broad range-bound structure for over a year, repeatedly failing near the ₹482–485 zone. This horizontal resistance acted as a ceiling for multiple rally attempts, establishing itself as a strong supply level. The recent price action finally broke above this key resistance with a wide bullish candle and large body range, showing a clean breakout with strong intent. This upward move has cleared the overhang of consolidation, and the stock has entered fresh territory not seen since early 2024. The structure resembles a volatility contraction breakout, signaling the end of prolonged accumulation. Candlestick Behavior: The breakout candle is a decisive bullish bar with strong follow-through and no upper wick, reflecting sustained buying till close. Previous candles showed tightening ranges and higher lows, pointing to pressure buildup. Volume Analysis: Volume has surged significantly alongside the breakout candle. This is important confirmation as the stock had shown muted volumes during earlier resistance tests, but the current spike implies real institutional activity backing the breakout. 2. Crucial Support and Resistance Levels Support Levels: ₹482.20: Previous horizontal resistance now turns into immediate support (breakout level). ₹450: Minor demand zone within range—mid-channel support. ₹410: Last strong pivot before the rally began. Resistance Levels: ₹525–₹540: Minor historical congestion zone (from early 2024) that could act as short- term resistance. ₹629.95: Swing high from Jan 2024; next major upside objective on sustained strength. 3. Strategic Trade Scenarios 🔸 Breakout Continuation Setup: A daily close above ₹482 with rising volume suggests breakout strength. Sustained price action above this zone could lead to a push toward ₹525 and potentially ₹630 over the medium term. Look for higher lows and volume continuity for confirmation. 🔹 Retest & Reversion Setup: If price pulls back below ₹482 without defending the breakout zone, expect a retest toward ₹450. A breakdown below ₹450 would weaken momentum and reintroduce range-bound behavior.
Price Action
- ■Price action is structurally positive.
- ■Forming higher highs and higher lows.
Volume Profile
- ■Volume is supportive of the price action.
- ■Wait for volume expansion on breakout.
Key Levels
No zones specified
No zones specified
Invalidation Scenario
A weekly close below the support level invalidates this structure.
HUBTOWN LTD
bearish fnoDouble Bottom Breakout
Daily Chart
Thesis & Analysis
No detailed thesis provided for this setup.
Price Action
- ■Price action is structurally positive.
- ■Forming higher highs and higher lows.
Volume Profile
- ■Volume is supportive of the price action.
- ■Wait for volume expansion on breakout.
Key Levels
No zones specified
No zones specified
Invalidation Scenario
A weekly close below the support level invalidates this structure.
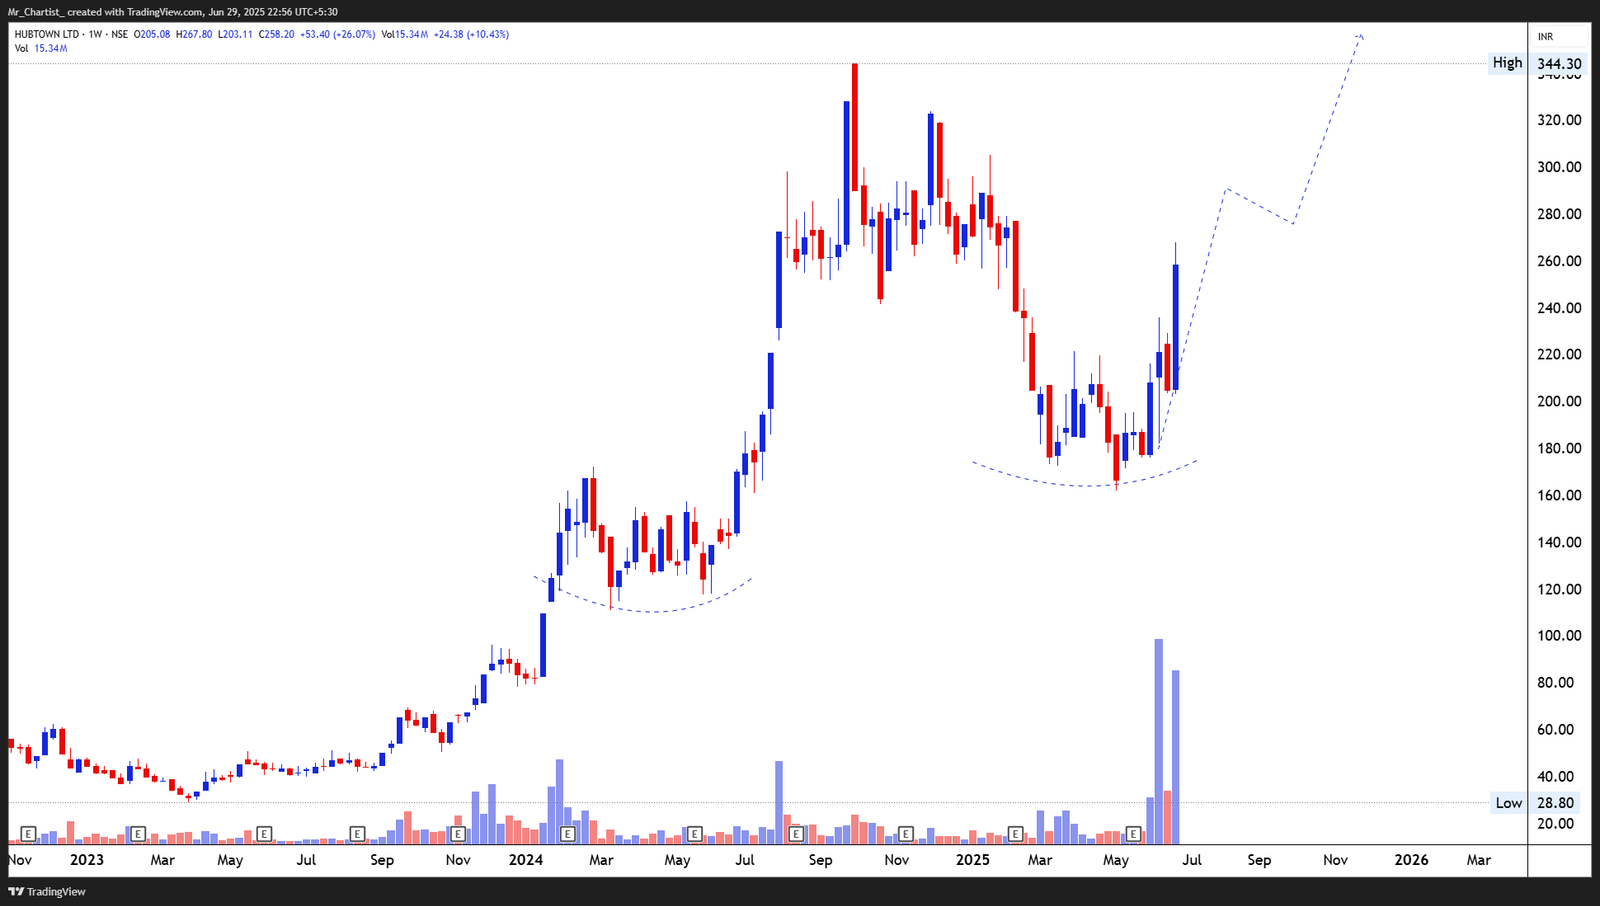
HUBTOWN LTD
bearish fnoDouble Bottom Breakout
1.5-Year Weekly Pattern
Thesis & Analysis
Price Action Overview: Hubtown appears to be completing a multi-month rounding formation, now progressing into the right-side rally. This formation follows a long period of correction and stabilization between ₹160 and ₹200. The recent breakout attempt with an impulsive bullish candle and strong volume signals that the stock may be preparing for a major continuation. The pattern reflects long-term accumulation transitioning into markup, as seen by the smooth curve on both sides of the structure. Price is now testing the neckline zone of the previous highs from late 2024, showing renewed buyer aggression after a corrective phase. Candlestick Behavior: The last 2 weekly candles show significant range expansion with bullish closes and little upper wick pressure—strong signs of momentum buildup. There’s no selling tail at current levels, which indicates low supply absorption. Volume Analysis: Volume has surged considerably in recent weeks. This increasing activity aligns with the right side of the rounding base, where demand typically overtakes lingering supply. Volume on breakout weeks has exceeded prior averages, strengthening the reliability of the emerging move. 2. Crucial Support and Resistance Levels Support Levels: ₹225: Short-term breakout zone—now an immediate demand base. ₹205–₹200: Consolidation band from the base, structurally critical. ₹160: Key swing low—acts as pattern’s anchor and long-term invalidation level. Resistance Levels: ₹280–₹285: Previous rejection zone; acts as the neckline for the rounding bottom. ₹344.30: All-time high zone—potential major breakout level if current move extends. 3. Strategic Trade Scenarios 🔸 Breakout Continuation Setup: A weekly close above ₹280 with rising volume will confirm a breakout from the rounding base. This could unlock a rally toward the ₹340–₹350 region, supported by price structure symmetry and historical volume behavior. 🔹 Pullback Reentry Setup: If the stock retraces after testing ₹280, watch for a dip toward ₹225–₹230. A bullish reversal pattern here (inside bar, bullish engulfing) with supporting volume would indicate a healthy handle formation within a classic continuation framework.
Price Action
- ■Price action is structurally positive.
- ■Forming higher highs and higher lows.
Volume Profile
- ■Volume is supportive of the price action.
- ■Wait for volume expansion on breakout.
Key Levels
No zones specified
No zones specified
Invalidation Scenario
A weekly close below the support level invalidates this structure.
SILVER TOUCH TECH LTD
bearish fnoDouble Bottom Breakout
Daily Chart
Thesis & Analysis
No detailed thesis provided for this setup.
Price Action
- ■Price action is structurally positive.
- ■Forming higher highs and higher lows.
Volume Profile
- ■Volume is supportive of the price action.
- ■Wait for volume expansion on breakout.
Key Levels
No zones specified
No zones specified
Invalidation Scenario
A weekly close below the support level invalidates this structure.
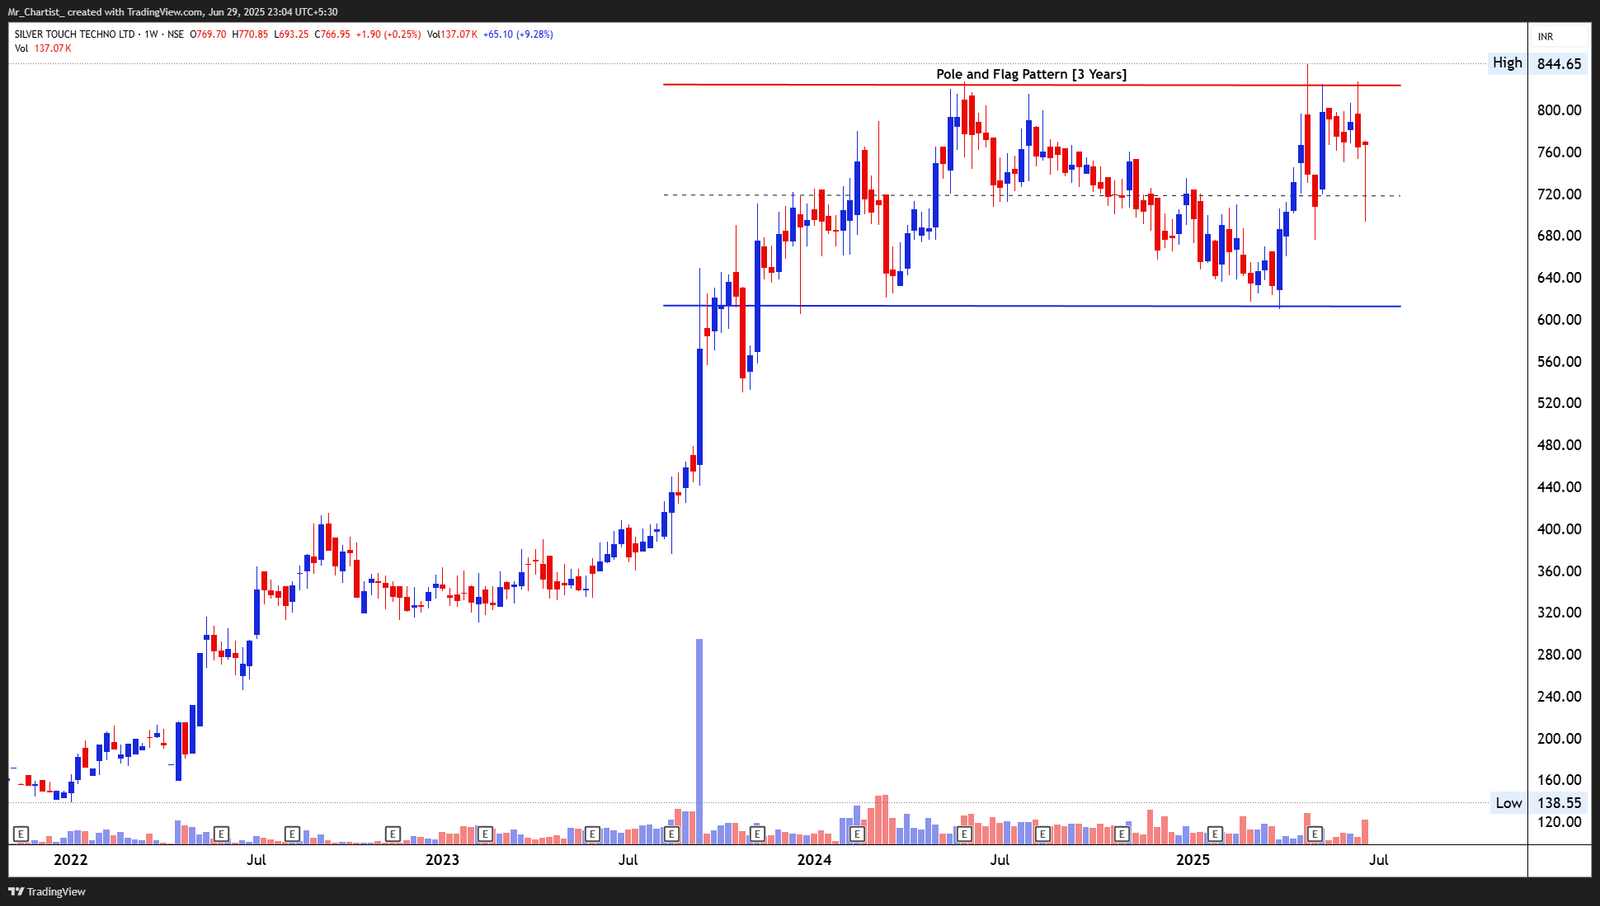
SILVER TOUCH TECH LTD
bearish fnoDouble Bottom Breakout
3-Year Weekly Continuation Pattern
Thesis & Analysis
Price Action Overview: Silver Touch has formed a classic Pole and Flag pattern after a sharp vertical rise between 2022 and early 2024 (the “pole”), followed by a long-term horizontal consolidation between ₹620 and ₹840 (the “flag”). This sideways action has unfolded for over a year, indicating a healthy digestion of prior gains. The most recent candles show upper tail rejections just beneath ₹840 resistance, indicating sellers defending the upper boundary of the flag. The broader structure still remains bullish, with price compressing within a well-defined box range and the latest rally retesting upper breakout levels. Candlestick Behavior: Recent candles display rejection wicks and short-bodied formations—suggesting indecision at the higher band. However, the presence of bullish marubozu-type bars in prior weeks suggests bullish interest remains active on dips. Volume Analysis: Volume during the pole phase surged dramatically—indicative of strong institutional participation. During the flag consolidation, volume has normalized with periodic spikes on upward attempts. A sustained breakout above ₹840 with above-average volume would confirm fresh momentum. 2. Crucial Support and Resistance Levels Support Zones: ₹720: Mid-flag consolidation pivot zone; historical inflection area. ₹640–₹620: Lower edge of the flag structure; tested multiple times and held firmly. ₹590: Final demand base formed before prior rally—flag structure invalidation zone. Resistance Zones: ₹820–₹840: Long-term horizontal resistance and upper breakout zone; multiple rejection points. ₹844.65: All-time high; confluence point of structural breakout. Unless the price achieves a strong weekly close above ₹840, the upper range remains under supply pressure. 3. Strategic Trade Scenarios 🔸 Bullish Flag Breakout Setup: A sustained close above ₹840, preferably accompanied by volume >150K, would confirm a breakout from the 3-year flag. Such a move opens upside potential toward ₹1,000 in the medium term, assuming symmetry with the height of the pole. 🔹 Range Rejection Setup: Failure to close above ₹820–₹840 and subsequent rejection candles (bearish engulfing or long upper shadows) could lead to a retest of ₹720 or deeper toward ₹640. Price activity here would be critical to assess whether the flag remains valid or risks breakdown.
Price Action
- ■Price action is structurally positive.
- ■Forming higher highs and higher lows.
Volume Profile
- ■Volume is supportive of the price action.
- ■Wait for volume expansion on breakout.
Key Levels
No zones specified
No zones specified
Invalidation Scenario
A weekly close below the support level invalidates this structure.
PILANI INVS
bearish fnoDouble Bottom Breakout
Daily Chart
Thesis & Analysis
No detailed thesis provided for this setup.
Price Action
- ■Price action is structurally positive.
- ■Forming higher highs and higher lows.
Volume Profile
- ■Volume is supportive of the price action.
- ■Wait for volume expansion on breakout.
Key Levels
No zones specified
No zones specified
Invalidation Scenario
A weekly close below the support level invalidates this structure.
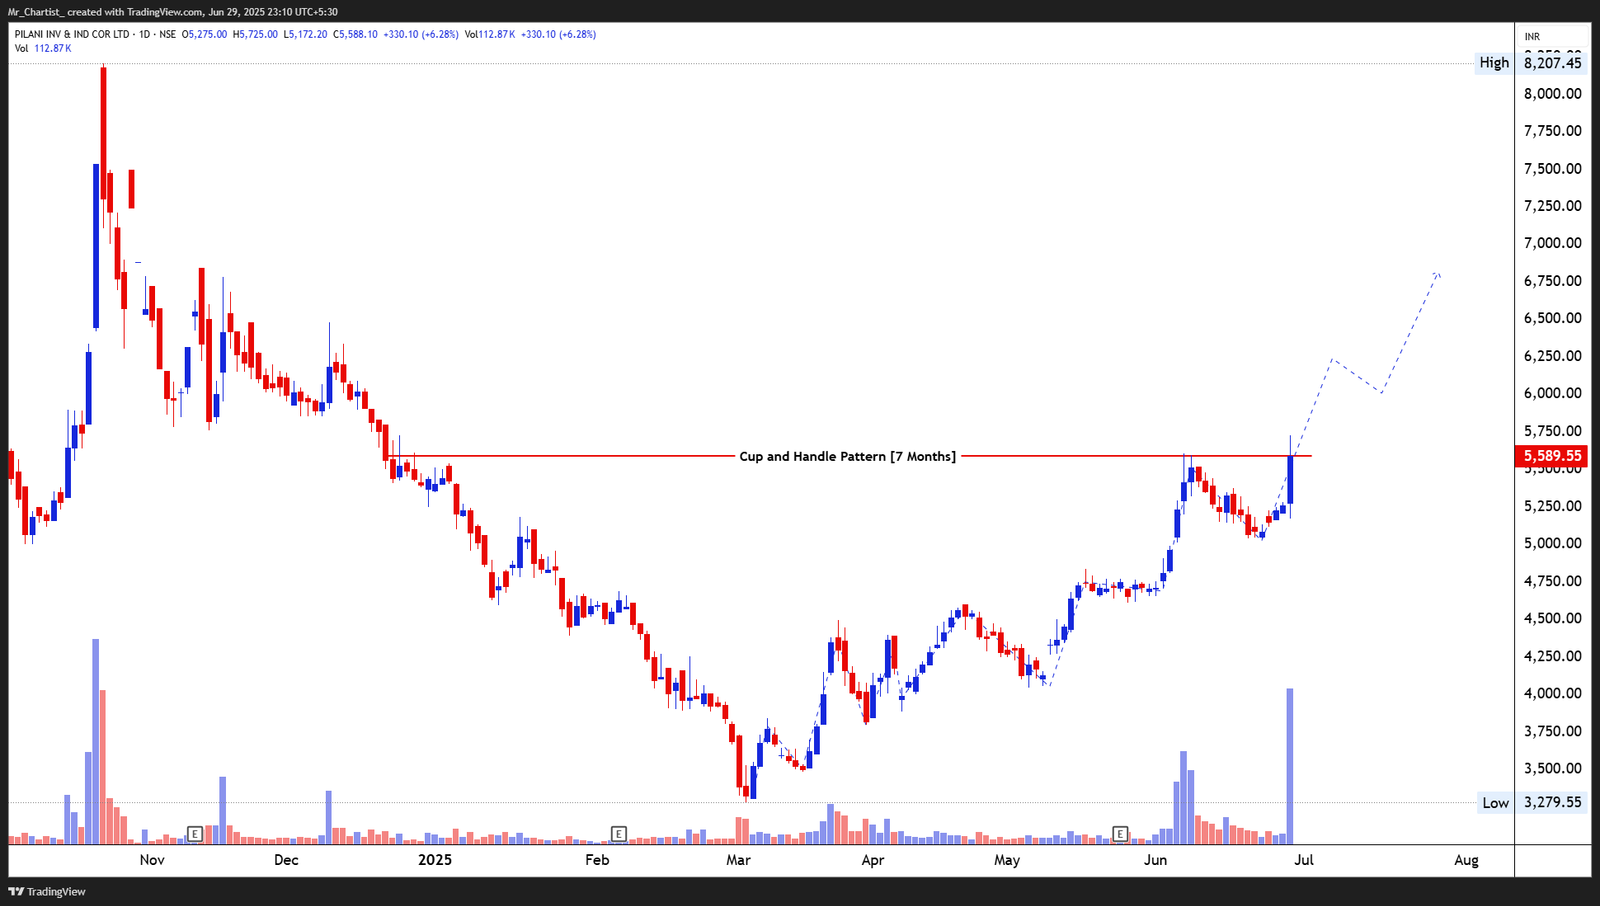
PILANI INVS
bearish fnoDouble Bottom Breakout
7-Month Base Formation (Daily Chart)
Thesis & Analysis
Price Action Overview: PILANI INVS has completed a classic Cup and Handle pattern that developed over the last 7 months. The rounded bottom structure indicates a lengthy accumulation phase after a prolonged downtrend. The recent “handle” pullback was shallow and short-lived, hinting at minimal distribution pressure and strong buyer interest near the neckline. Today's sharp breakout candle has decisively crossed the neckline with a large-bodied bullish bar. The broader shape indicates a textbook breakout setup with continuation potential, especially considering the prior correction was deep and now met with higher timeframe breakout dynamics. Candlestick Behavior: The breakout bar is wide-ranged, supported by a clean bullish marubozu-type body. Previous few candles showed tight consolidation, forming a handle just below resistance, which adds validity to the breakout. No supply wicks visible on the breakout day suggest clear control by buyers. Volume Analysis: A significant volume surge accompanies the breakout—one of the highest in recent weeks— confirming conviction. Volumes during the handle phase were declining, aligning well with classical cup-and-handle behavior. 2. Crucial Support and Resistance Levels Support Zones: ₹5,450–₹5,500: Former neckline turned immediate support; critical for sustaining breakout. ₹5,100: Mid-handle consolidation pivot. ₹4,650: Handle low; pattern failure zone if breached. Resistance Zones: ₹6,250: Round number psychological resistance and projected near-term move. ₹6,900–₹7,000: Visual chart projection from cup depth extension (measured move). ₹8,200: Long-term previous high visible in the extended range—potential extended target zone. 3. Strategic Trade Scenarios 🔸 Cup Breakout Continuation Setup: A sustained move above ₹5,600 backed by volumes >100K indicates follow-through. If price holds above this zone for 2–3 sessions, measured move targets open up toward ₹6,250–₹6,900 based on the pattern’s depth. 🔹 Retest & Pullback Scenario: If the price pulls back toward ₹5,450–₹5,500 with low volume and forms a bullish reversal candle (like a hammer or bullish harami), it may offer a fresh entry opportunity. Breakdown below ₹5,100 could delay momentum or signal pattern failure.
Price Action
- ■Price action is structurally positive.
- ■Forming higher highs and higher lows.
Volume Profile
- ■Volume is supportive of the price action.
- ■Wait for volume expansion on breakout.
Key Levels
No zones specified
No zones specified
Invalidation Scenario
A weekly close below the support level invalidates this structure.
NAVINFLUOR
bearish fnoDouble Bottom Breakout
Daily Chart
Thesis & Analysis
No detailed thesis provided for this setup.
Price Action
- ■Price action is structurally positive.
- ■Forming higher highs and higher lows.
Volume Profile
- ■Volume is supportive of the price action.
- ■Wait for volume expansion on breakout.
Key Levels
No zones specified
No zones specified
Invalidation Scenario
A weekly close below the support level invalidates this structure.
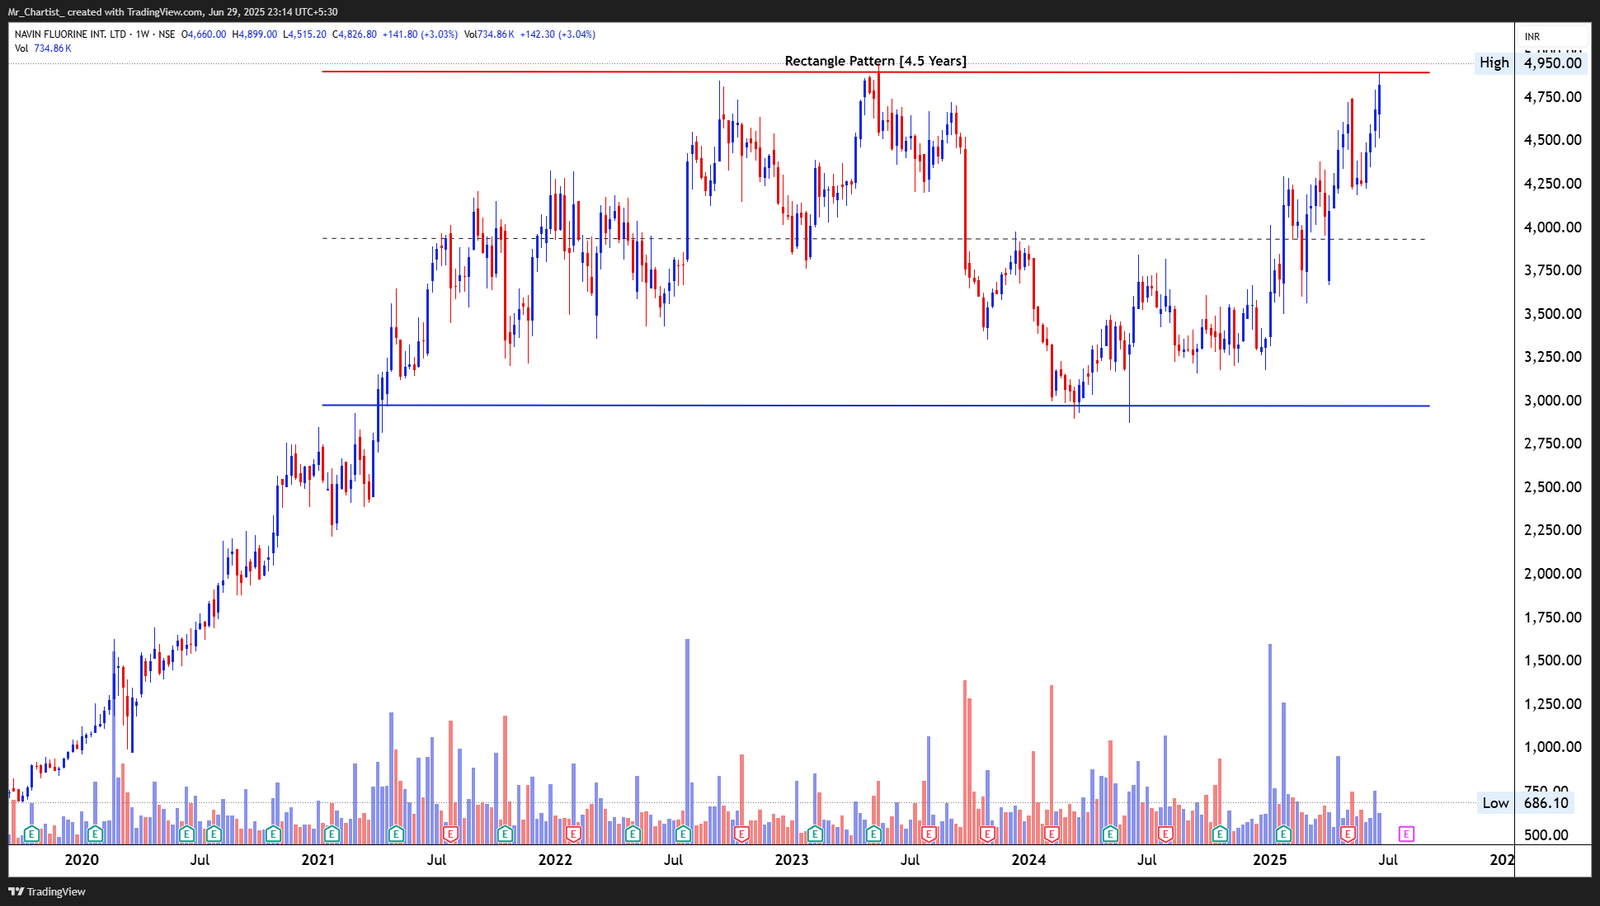
NAVINFLUOR
bearish fnoDouble Bottom Breakout
4.5 Years (Weekly Chart – Long-Term Consolidation)
Thesis & Analysis
Price Action Overview: NAVINFLUOR has been consolidating inside a well-defined rectangle range for over four years, bounded between ~₹3,050 and ₹4,950. The current price is testing the upper resistance of this multi-year range after a sharp leg up from the ₹3,200 zone in early 2024. This retest of resistance comes on the back of higher lows and progressively bullish candles —indicating pressure buildup against the upper ceiling. The rectangular range is indicative of a broad accumulation/distribution phase. Given the recent bullish structure and volume expansion, the bias slightly favors a bullish breakout if resistance is breached convincingly. Candlestick Behavior: Last few weekly candles show consistent higher closes and minimal upper wicks, which reflect steady buying. However, this week’s candle is a minor rejection bar near resistance— needs confirmation next week. Volume Analysis: Volume has been expanding gradually since the base near ₹3,200, and recent bars show strong volume on up weeks. A decisive breakout above ₹4,950 accompanied by further volume expansion would confirm the breakout from the multi-year base. 2. Crucial Support and Resistance Levels Support Zones: ₹4,400: Intermediate support from last breakout structure. ₹4,050: Midpoint of the rectangle, recent price congestion. ₹3,050: Lower boundary of the rectangle and long-term floor. Resistance Zones: ₹4,950: Rectangle top; key breakout trigger level. ₹5,300–₹5,450: Projected post-breakout target zone based on measured move (rectangle height added). ₹6,000+: Psychological milestone if up-move sustains over medium term. 3. Strategic Trade Scenarios 🔸 Multi-Year Breakout Continuation Setup: If price closes above ₹4,950 on a weekly basis with volume exceeding 800K–1M, it would validate a clean rectangle breakout. Post-breakout price projection opens toward ₹5,300– ₹5,450. Higher timeframe breakout often leads to multi-quarter trends. 🔹 Range Rejection Setup: If price fails to sustain above ₹4,950 and starts forming reversal candles (like a shooting star or bearish engulfing), then a retracement back to ₹4,400 or even ₹4,050 is likely. Breakdown below ₹4,050 would shift short-term bias to neutral/bearish.
Price Action
- ■Price action is structurally positive.
- ■Forming higher highs and higher lows.
Volume Profile
- ■Volume is supportive of the price action.
- ■Wait for volume expansion on breakout.
Key Levels
No zones specified
No zones specified
Invalidation Scenario
A weekly close below the support level invalidates this structure.
JMFINANCIL
bearish fnoDouble Bottom Breakout
Daily Chart
Thesis & Analysis
No detailed thesis provided for this setup.
Price Action
- ■Price action is structurally positive.
- ■Forming higher highs and higher lows.
Volume Profile
- ■Volume is supportive of the price action.
- ■Wait for volume expansion on breakout.
Key Levels
No zones specified
No zones specified
Invalidation Scenario
A weekly close below the support level invalidates this structure.
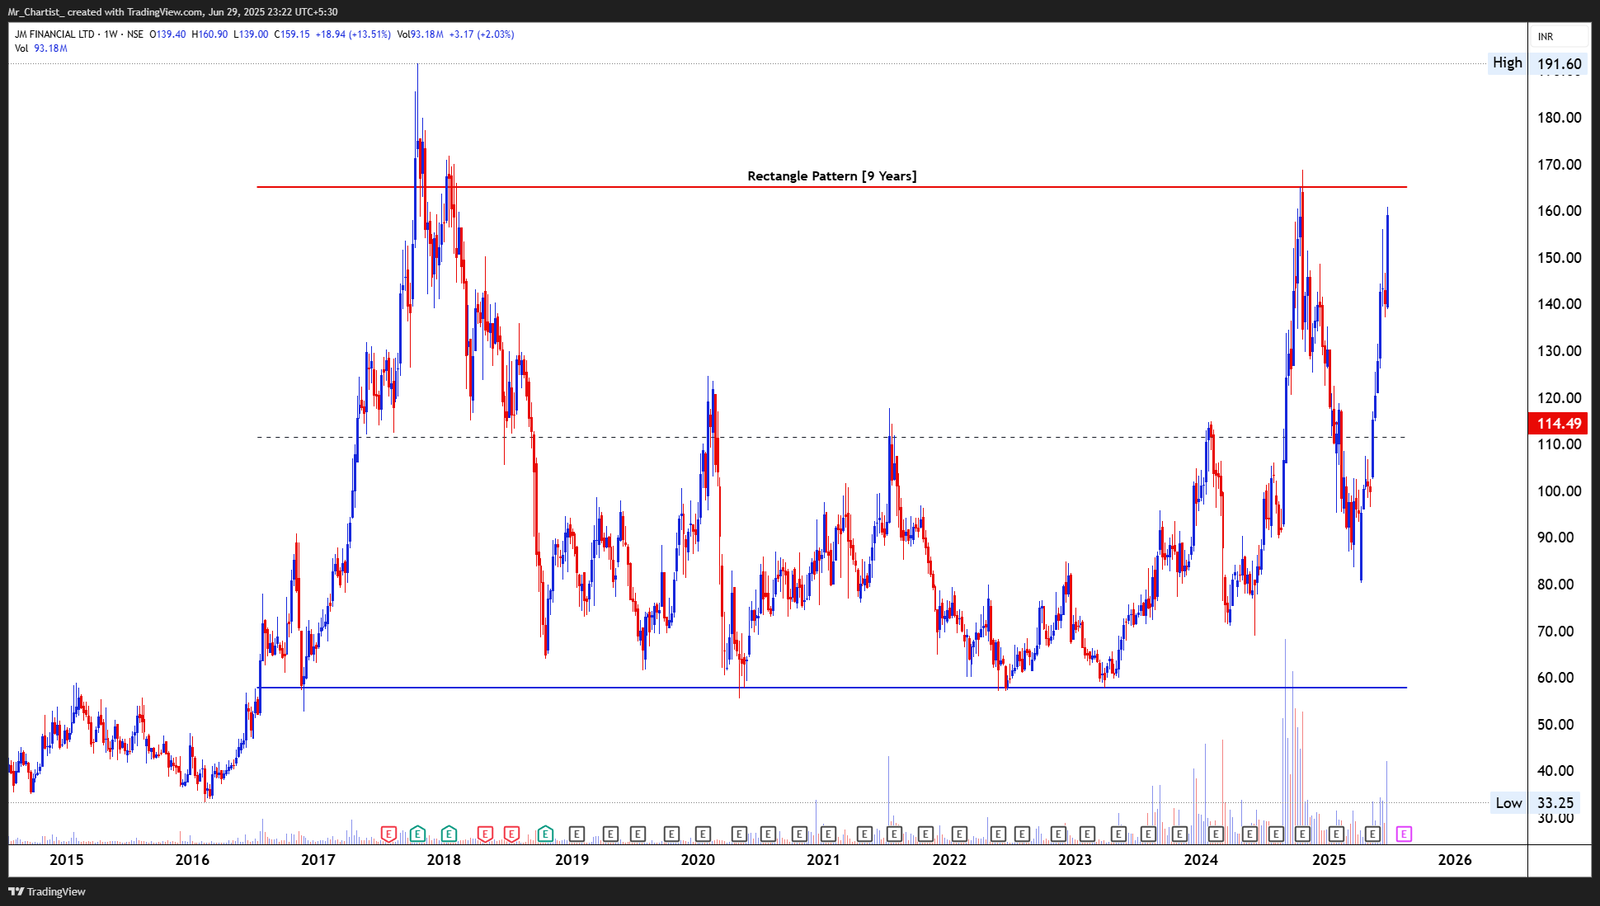
JMFINANCIL
bearish fnoDouble Bottom Breakout
9 Years (Weekly Chart – Broad Range Consolidation)
Thesis & Analysis
Price Action Overview: JM Financial has been trading within a large rectangle consolidation since 2016, oscillating between approximately ₹58 on the lower end and ₹172 on the upper end. The recent surge has brought the stock back near the upper boundary of the rectangle after multiple years of basing. The current upward momentum suggests a potential breakout attempt from this long-term congestion zone. The latest candle is a strong bullish bar with elevated volume and a close near the weekly high—showcasing conviction buying. Candlestick Behavior: The last two weekly candles show strong real bodies with consecutive higher closes, breaking above mid-range resistance around ₹115. There’s strong momentum and price thrust toward the top boundary. Volume Analysis: Volume has expanded significantly over the past few weeks—well above the 6-month average—confirming increased institutional participation. A sustained breakout above ₹172 with volume >100M could mark a major structural shift toward trend resumption. 2. Crucial Support and Resistance Levels Support Zones: ₹130–₹125: Immediate pullback support; zone of last breakout and previous highs. ₹100: Psychological and structural midpoint of the rectangle. ₹58–₹60: Long-term base; key invalidation zone if price fails. Resistance Zones: ₹172–₹174: Rectangle top and breakout trigger level; tested thrice previously. ₹191.60: 2017 high; post-breakout extension resistance. ₹215: Measured move target if breakout sustains. 3. Strategic Trade Scenarios 🔸 Breakout Continuation Setup: A weekly close above ₹172 with follow-through and volume confirmation could lead to a multi-month rally. Pattern targets suggest a potential move toward ₹215 and beyond, backed by rectangle height projection. 🔹 Rejection & Pullback Scenario: Failure to cross ₹172 may result in a retest of ₹130–₹125 zone. Breakdown below ₹100 would re-confirm the range and shift focus back toward the lower band around ₹60.
Price Action
- ■Price action is structurally positive.
- ■Forming higher highs and higher lows.
Volume Profile
- ■Volume is supportive of the price action.
- ■Wait for volume expansion on breakout.
Key Levels
No zones specified
No zones specified
Invalidation Scenario
A weekly close below the support level invalidates this structure.
NYKAA
bearish fnoDouble Bottom Breakout
Daily Chart
Thesis & Analysis
No detailed thesis provided for this setup.
Price Action
- ■Price action is structurally positive.
- ■Forming higher highs and higher lows.
Volume Profile
- ■Volume is supportive of the price action.
- ■Wait for volume expansion on breakout.
Key Levels
No zones specified
No zones specified
Invalidation Scenario
A weekly close below the support level invalidates this structure.
Chart Image Not Extracted
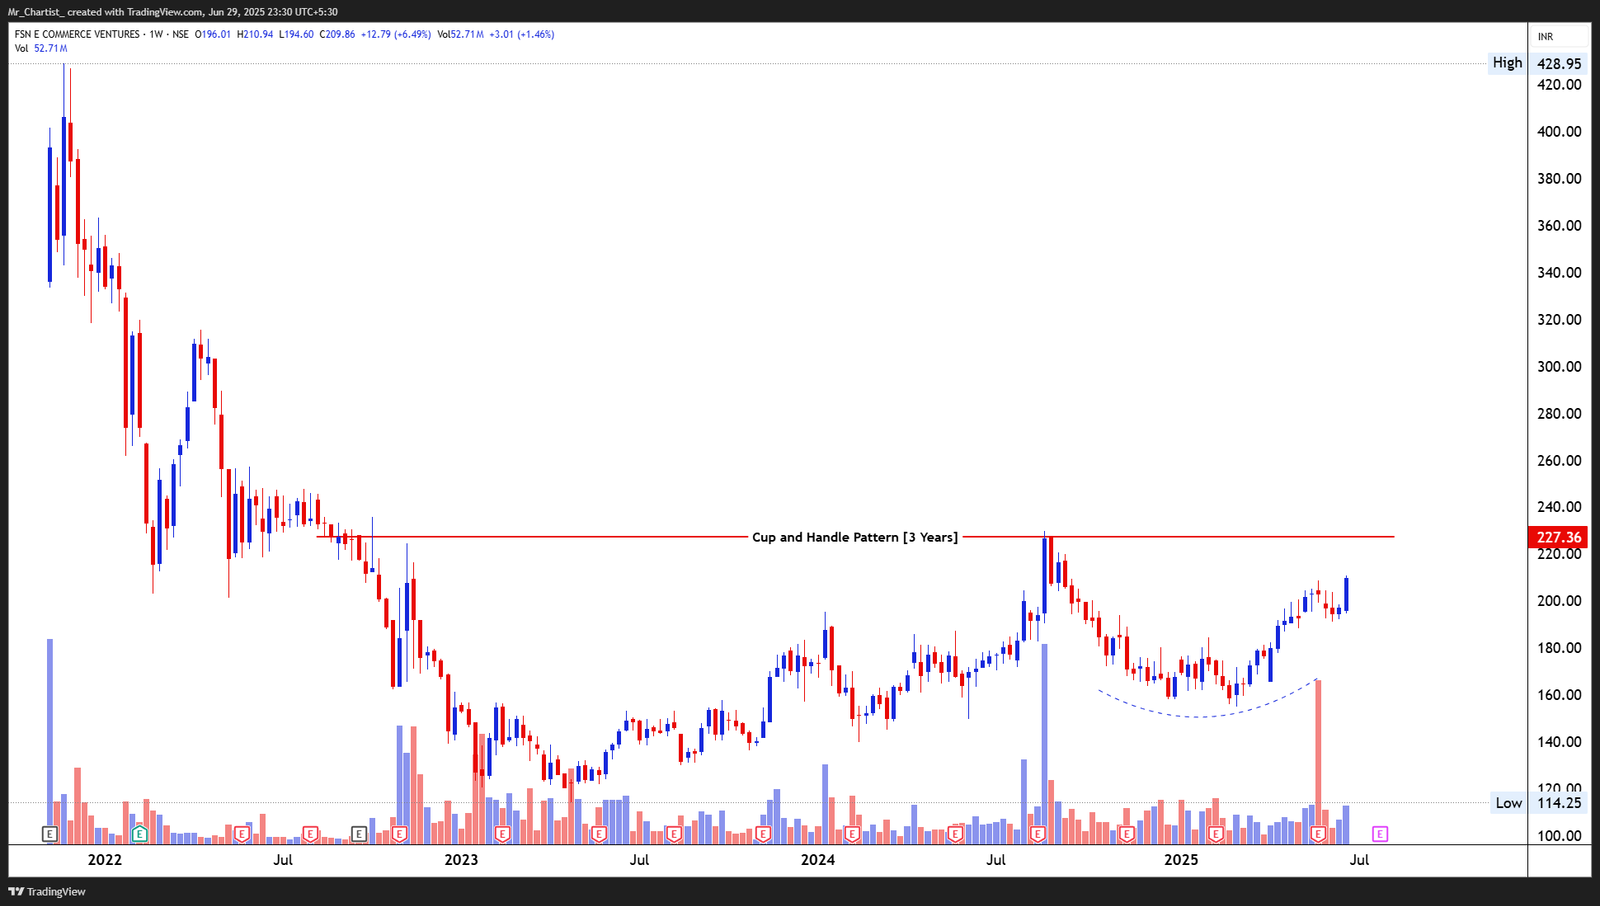
NYKAA
bearish fnoDouble Bottom Breakout
3 Years (Weekly Chart – Long-Term Base Formation)
Thesis & Analysis
Price Action Overview: NYKAA is in the advanced stages of forming a Cup and Handle pattern post a prolonged downtrend and multi-quarter base. The larger cup base spans nearly two years, followed by a shallow handle forming over the last several weeks. This handle structure shows minor pullbacks with higher lows, indicating absorbing supply. The stock is approaching its neckline at ₹227.36, a significant horizontal resistance aligned with previous rejection highs from Jan–Feb 2024. Price is coiling upward in anticipation of a breakout attempt, with healthy structure and narrowing ranges. Candlestick Behavior: Recent candles are showing strong real bodies and higher weekly closes. The latest candle is red but closes higher than the previous swing low, suggesting profit booking without full trend reversal. Volume Analysis: There is visible volume expansion during the right side of the cup and renewed interest during the handle formation. Spike volumes near resistance indicate growing institutional activity. A breakout above ₹227 with 60M+ volume would validate the bullish structure. 2. Crucial Support and Resistance Levels Support Zones: ₹196–₹192: Minor swing zone inside the handle—short-term reference level. ₹174: Bottom of the handle; any breakdown here negates pattern. ₹114: Multi-year base low; invalidation zone for broader structure. Resistance Zones: ₹227.36: Cup and Handle neckline; breakout trigger point. ₹255–₹265: Historical gap zone and early post-IPO supply zone. ₹295+: Pattern target projection based on cup depth. 3. Strategic Trade Scenarios 🔸 Breakout Continuation Setup: A breakout above ₹227.36 with strong volume and wide candle range may trigger a long- term reversal with a projected target near ₹295. Confirmation will require sustained close above resistance with rising OBV and follow-through. 🔹 Handle Breakdown Setup: If price fails near ₹227 and breaks below ₹192–₹174 handle zone with rising bearish volume, the setup weakens. Price may revisit ₹155–₹140 before any base rebuild. The structure would shift from bullish continuation to failed breakout risk.
Price Action
- ■Price action is structurally positive.
- ■Forming higher highs and higher lows.
Volume Profile
- ■Volume is supportive of the price action.
- ■Wait for volume expansion on breakout.
Key Levels
No zones specified
No zones specified
Invalidation Scenario
A weekly close below the support level invalidates this structure.
Charts to Watch
Setups forming favorable structures
Nifty 50 Index
charts to-watchDouble Bottom Breakout
Daily Chart
Thesis & Analysis
No detailed thesis provided for this setup.
Price Action
- ■Price action is structurally positive.
- ■Forming higher highs and higher lows.
Volume Profile
- ■Volume is supportive of the price action.
- ■Wait for volume expansion on breakout.
Key Levels
No zones specified
No zones specified
Invalidation Scenario
A weekly close below the support level invalidates this structure.
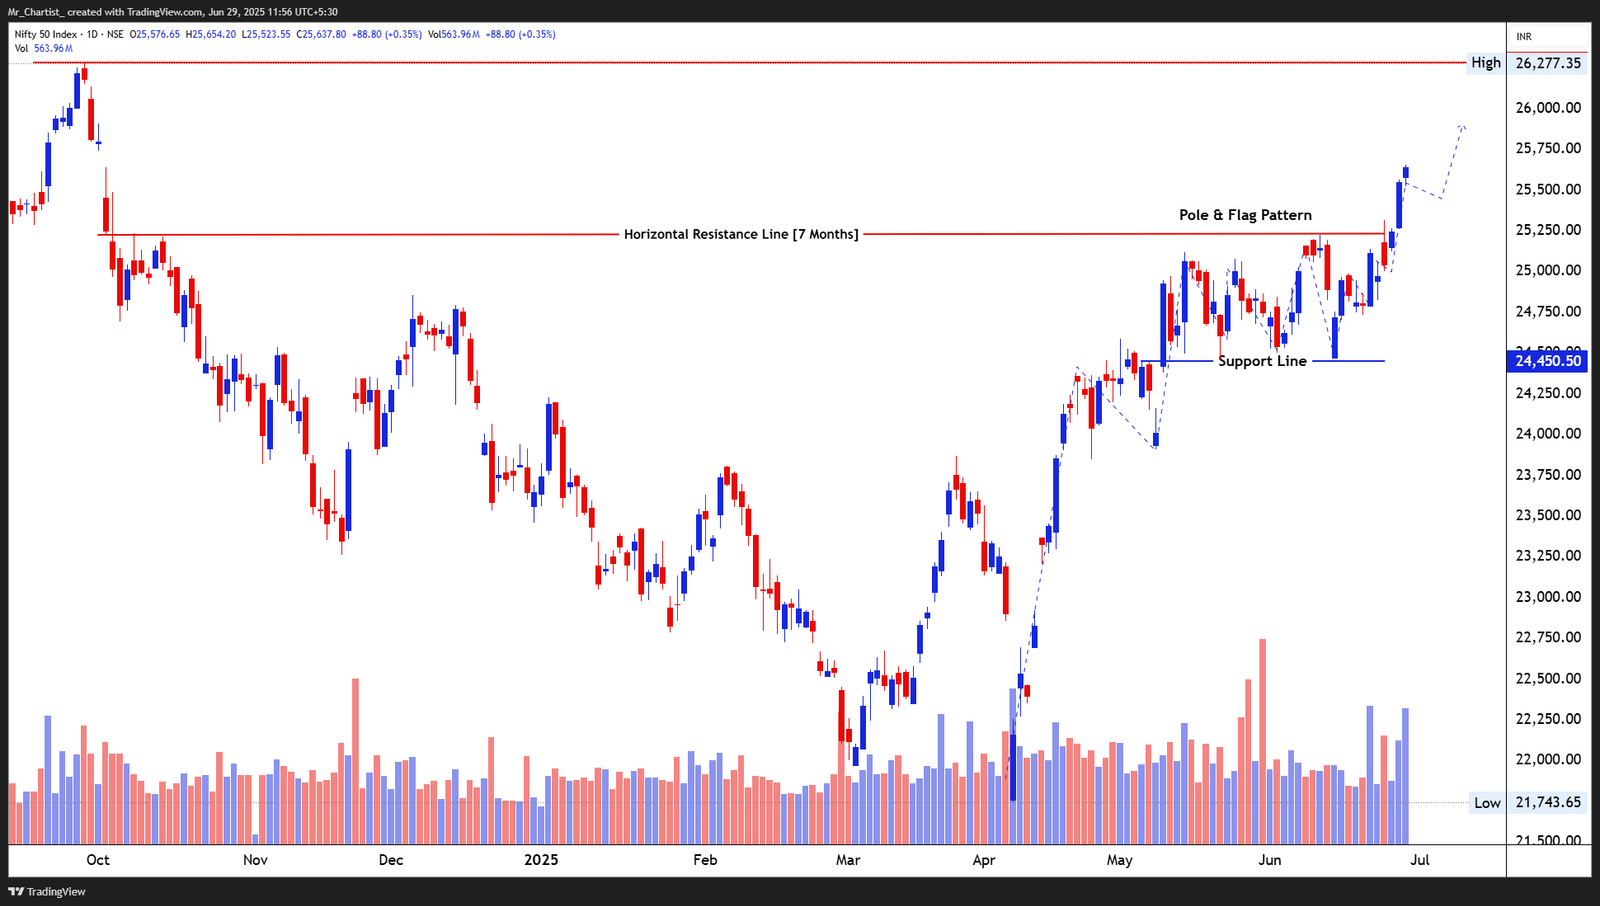
NIFTY 50 INDEX
charts to-watchThe breakout candle is a strong bullish candle with little to no upper wick, signifying firm
~3 Months Pole + ~4 Weeks Flag Consolidation
Thesis & Analysis
Price Action Overview: Nifty has formed a classic pole and flag pattern, with a strong vertical rally forming the pole and a month-long sideways range forming the flag. The index consolidated tightly between ₹25,250 (upper flag boundary) and ₹24,450 (base), indicating controlled profit booking. A recent breakout above the ₹25,250 level suggests a shift in momentum. This upside breakout follows multiple higher lows within the flag—pointing toward bullish accumulation. Candlestick Pattern: The breakout candle is a strong bullish candle with little to no upper wick, signifying firm buying strength. This comes after multiple small-body candles and minor dips into support, which were consistently absorbed by buyers. Volume Analysis: Volume remained muted during the consolidation phase, which is typical of a flag setup. The breakout candle shows a visible uptick in volume, signaling early breakout participation. Watch for volume expansion on follow-through to confirm a sustainable move. 2. Crucial Support and Resistance Levels Support Levels: ₹25,250: Recent breakout zone and upper flag boundary—now a key support pivot. ₹24,450: Flag base and well-tested demand zone during consolidation. ₹23,800: Pre-flag pivot low and interim support. Resistance Levels: ₹25,775–₹25,800: Measured move target from the flagpole height. ₹26,250–₹26,277: All-time high zone and psychological ceiling—final resistance before price discovery. The breakout is technically valid above ₹25,250. Sustaining above this level with rising volume affirms the continuation of the bullish leg. 3. Strategic Trade Scenarios 🔹 Bullish Continuation Setup: If Nifty holds above ₹25,250 with expanding volume, the flag breakout remains active. This sets up a move toward ₹25,775–₹25,800, with potential extension to ₹26,250–₹26,277 if momentum accelerates. 🔸 Breakdown Scenario: Failure to sustain above ₹25,250 and a drop below ₹24,450 would negate the breakout structure. In that case, downside reversion could pull the index back toward the ₹24,000– ₹23,800 zone, where previous accumulation occurred.
Price Action
- ■Price action is structurally positive.
- ■Forming higher highs and higher lows.
Volume Profile
- ■Volume is supportive of the price action.
- ■Wait for volume expansion on breakout.
Key Levels
No zones specified
No zones specified
Invalidation Scenario
A weekly close below the support level invalidates this structure.
Nifty SmallCap 100 Index
charts to-watchDouble Bottom Breakout
Daily Chart
Thesis & Analysis
No detailed thesis provided for this setup.
Price Action
- ■Price action is structurally positive.
- ■Forming higher highs and higher lows.
Volume Profile
- ■Volume is supportive of the price action.
- ■Wait for volume expansion on breakout.
Key Levels
No zones specified
No zones specified
Invalidation Scenario
A weekly close below the support level invalidates this structure.
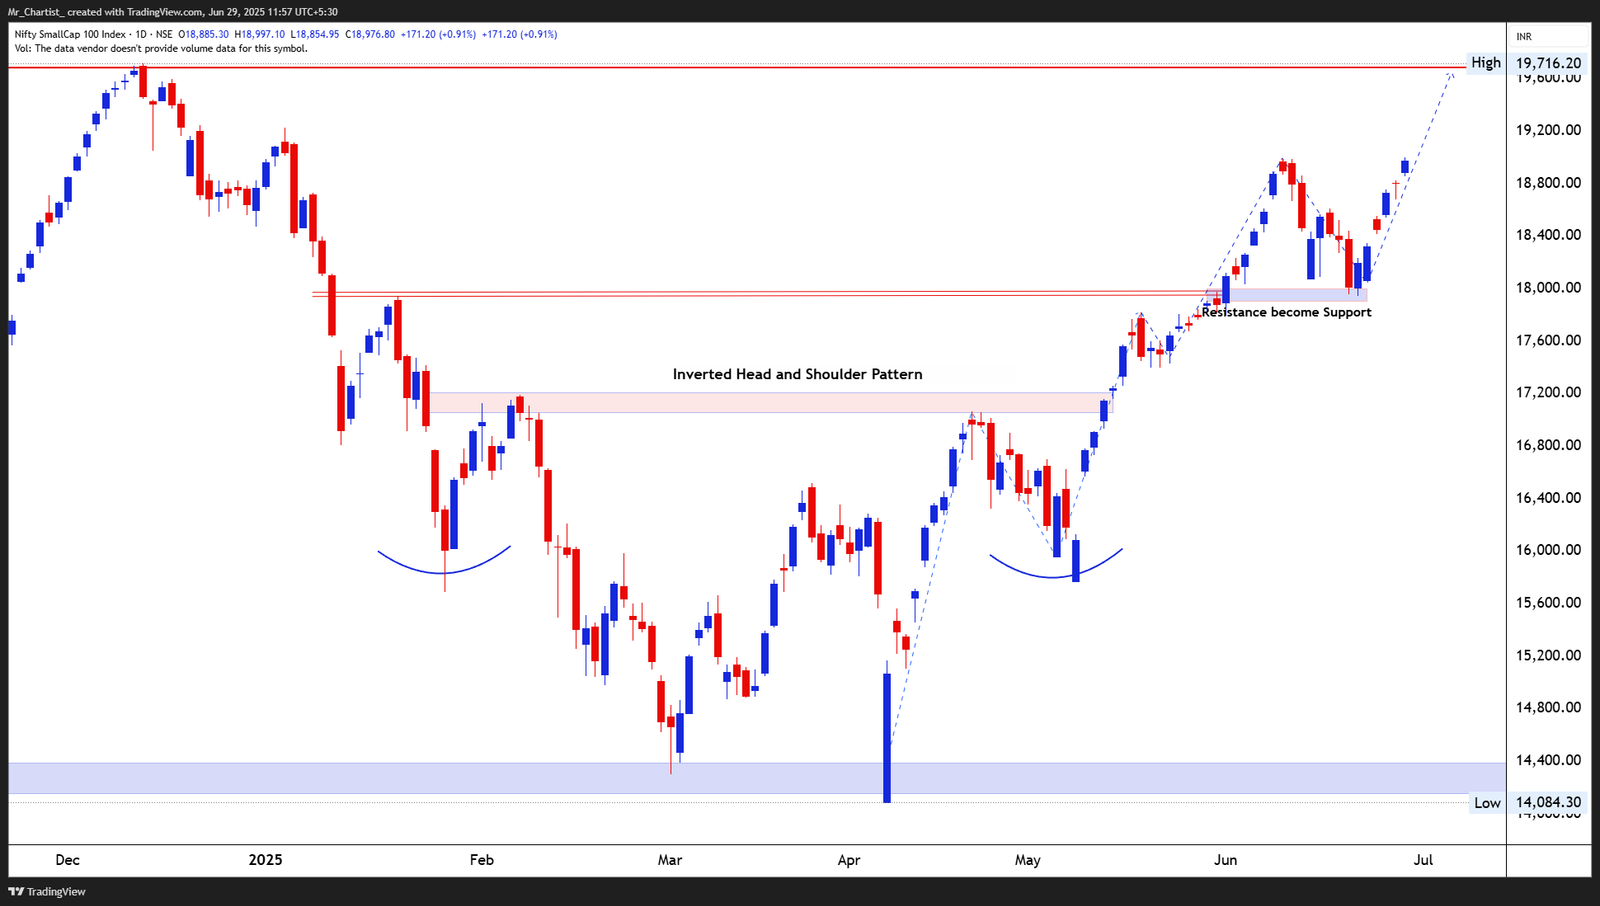
NIFTY SMALLCAP 100 INDEX
charts to-watchThe most recent session shows a strong bullish marubozu, which follows the
~5 Months Base Formation + 2-Month Rally
Thesis & Analysis
Price Action Overview: The index has completed a clean inverted head and shoulders pattern, confirming a bullish reversal. After breaking out above the neckline near ₹17,600, price rallied sharply and recently cleared the psychological ₹19,000 level. The price action also validates the classic resistance-turned-support concept, as the neckline zone has already been retested and held firm during a minor pullback. Candlestick Pattern: The most recent session shows a strong bullish marubozu, which follows the retest of the prior breakout level—indicating conviction-driven continuation. This candle suggests that buyers regained control immediately after minor profit booking.. 2. Crucial Support and Resistance Levels Support Levels: ₹18,000–₹17,600: Former neckline zone; now a strong support band. ₹16,900: Intermediate swing support during the right shoulder formation. ₹15,500: Pattern base and critical demand zone. Resistance Levels: ₹19,700–₹19,716: Swing high and likely near-term target. ₹20,000+: Psychological milestone; may attract profit-booking. The chart remains constructive as long as the price sustains above ₹18,000. Continued higher highs confirm the structural strength of the reversal. 3. Strategic Trade Scenarios 🔹 Bullish Continuation Setup: A sustained move above ₹19,000 with momentum could lead to an advance toward ₹19,700–₹19,716, with ₹20,000 as a potential medium-term extension zone. 🔸 Retest Scenario: If the price fails to hold above ₹19,000 and slips toward ₹18,000, the neckline zone will act as key support. A strong defense here would likely lead to a renewed up-leg.
Price Action
- ■Price action is structurally positive.
- ■Forming higher highs and higher lows.
Volume Profile
- ■Volume is supportive of the price action.
- ■Wait for volume expansion on breakout.
Key Levels
No zones specified
No zones specified
Invalidation Scenario
A weekly close below the support level invalidates this structure.
Nifty Pharma Index
charts to-watchDouble Bottom Breakout
Daily Chart
Thesis & Analysis
No detailed thesis provided for this setup.
Price Action
- ■Price action is structurally positive.
- ■Forming higher highs and higher lows.
Volume Profile
- ■Volume is supportive of the price action.
- ■Wait for volume expansion on breakout.
Key Levels
No zones specified
No zones specified
Invalidation Scenario
A weekly close below the support level invalidates this structure.
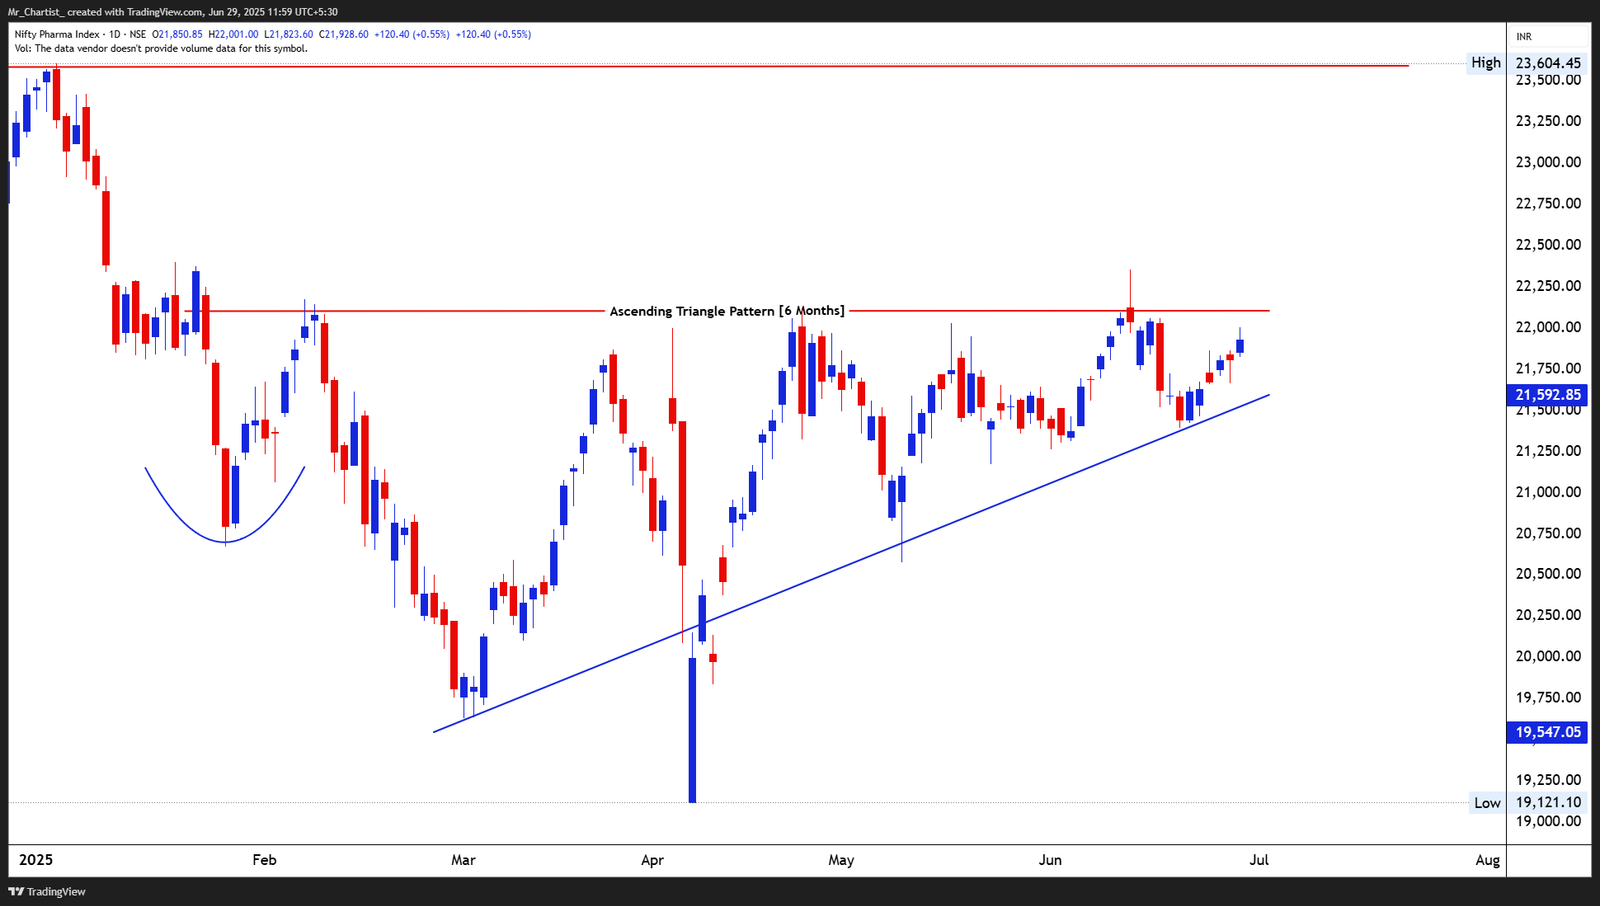
NIFTY PHARMA INDEX
charts to-watchThe last few sessions show a recovery from the trendline with small-bodied
~6 Months (Base from January 2025 onwards)
Thesis & Analysis
Price Action Overview: The index is forming a well-defined ascending triangle pattern, with horizontal resistance near ₹22,250 and rising trendline support since mid-March. This pattern typically reflects accumulation with a bullish bias. Price has oscillated within the triangle range, posting higher lows with each correction—a sign of growing buying pressure. The most recent bounce near the rising trendline reinforces the validity of the pattern and keeps the structure intact. Candlestick Pattern: The last few sessions show a recovery from the trendline with small-bodied candles and higher lows—indicating base building just below the resistance. No definitive breakout candle has formed yet, but price is inching toward a decision point. 2. Crucial Support and Resistance Levels Support Levels: ₹21,500: Near the rising trendline; recent pivot zone. ₹20,900: Previous swing low and triangle support from April. ₹19,550: Major demand zone and base of the rally. Resistance Levels: ₹22,250: Flat resistance line and breakout trigger. ₹23,000: Psychological level and intermediate resistance. ₹23,604: Prior major high—final supply zone before fresh highs. Sustained trading above ₹22,250 would suggest breakout confirmation, while repeated failures may extend the consolidation. 3. Strategic Trade Scenarios 🔹 Bullish Breakout Setup: A breakout above ₹22,250 with strong follow-through would complete the ascending triangle pattern, potentially targeting ₹23,000 initially, followed by ₹23,600 as the next key resistance zone. 🔸 Range Continuation / Breakdown Setup: If the index fails to break out and instead breaches ₹21,500, price may drift lower to retest the ₹20,900 or even ₹19,550 supports. Such action would delay the breakout and reset bullish momentum.
Price Action
- ■Price action is structurally positive.
- ■Forming higher highs and higher lows.
Volume Profile
- ■Volume is supportive of the price action.
- ■Wait for volume expansion on breakout.
Key Levels
No zones specified
No zones specified
Invalidation Scenario
A weekly close below the support level invalidates this structure.
Nifty IT Index
charts to-watchDouble Bottom Breakout
Daily Chart
Thesis & Analysis
No detailed thesis provided for this setup.
Price Action
- ■Price action is structurally positive.
- ■Forming higher highs and higher lows.
Volume Profile
- ■Volume is supportive of the price action.
- ■Wait for volume expansion on breakout.
Key Levels
No zones specified
No zones specified
Invalidation Scenario
A weekly close below the support level invalidates this structure.
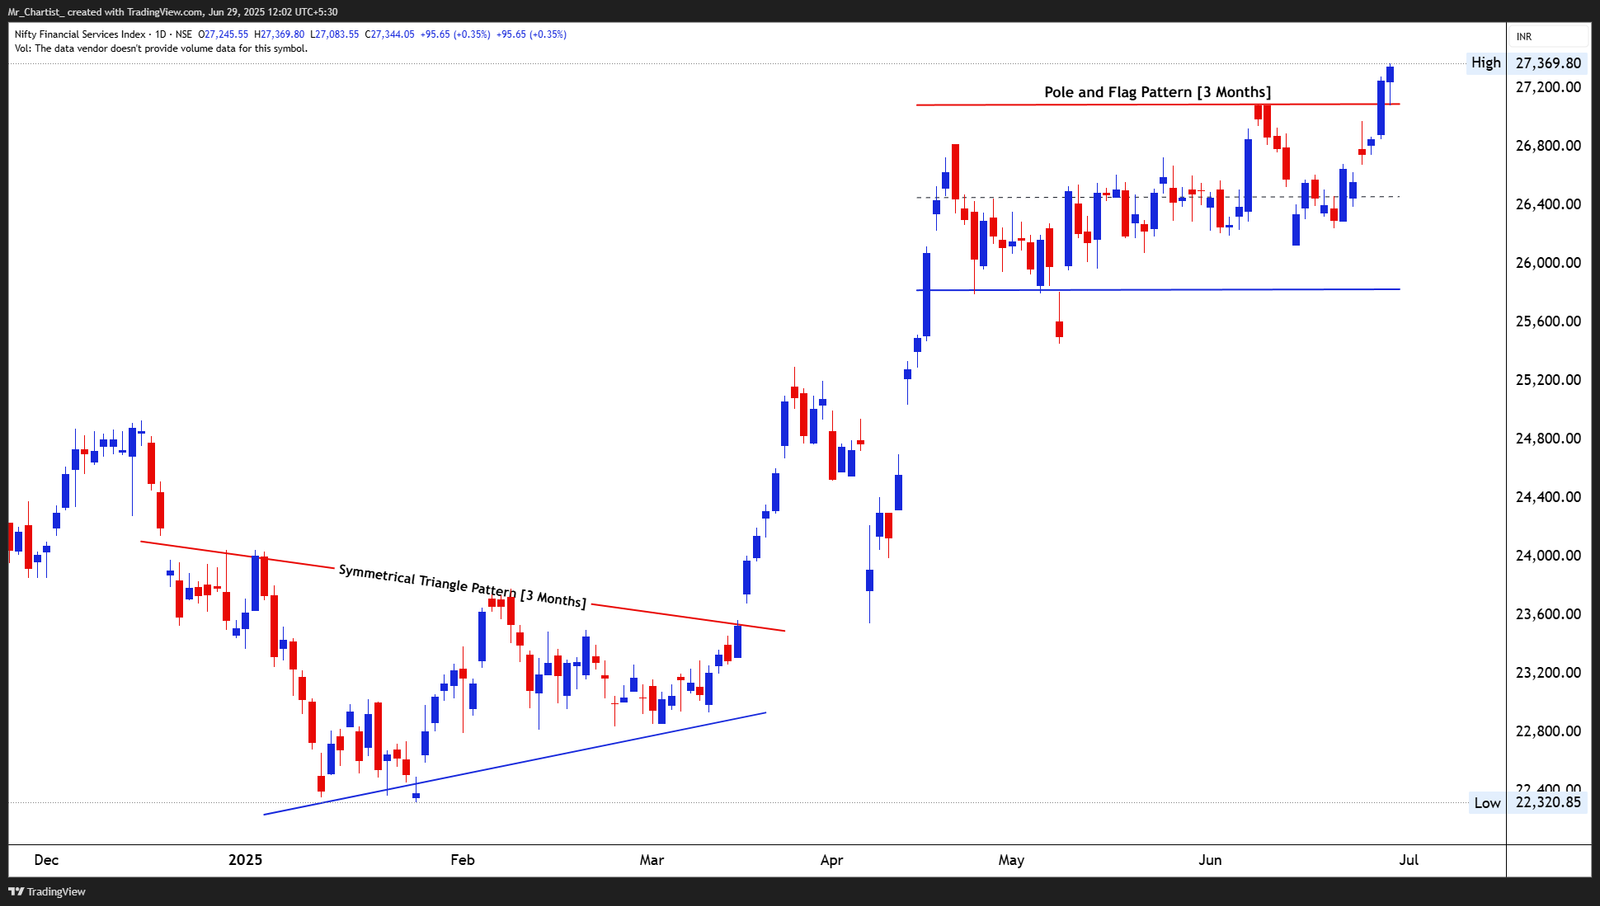
NIFTY IT INDEX
charts to-watchRecent candles are small-bodied with minor wicks, suggesting indecision but also
~5 Months Consolidation Phase
Thesis & Analysis
Price Action Overview: The Nifty IT index has been forming a steady ascending triangle since February 2025, with flat resistance near ₹39,000 and rising trendline support from April lows. Price has made a sequence of higher lows, showing gradual accumulation and reduced selling pressure at each dip. The recent candles are clustering just below the resistance line, indicating tightening range and building pressure for a directional move. Candlestick Pattern: Recent candles are small-bodied with minor wicks, suggesting indecision but also low volatility compression typical ahead of breakouts. A breakout candle above ₹39,000 would confirm the bullish structure. 2. Crucial Support and Resistance Levels Support Levels: ₹38,200–₹38,000: Rising trendline zone and short-term support. ₹36,600: Last swing low and intermediate structural support. ₹34,000: Base of the triangle and broader demand zone. Resistance Levels: ₹39,000: Key breakout point; horizontal resistance for five months. ₹41,000–₹42,000: Expected target zone post-breakout, based on measured move. ₹44,798: All-time high zone; long-term resistance. Sustaining above ₹39,000 on strong candles would be crucial for confirming breakout continuity. 3. Strategic Trade Scenarios 🔹 Bullish Breakout Setup: A decisive breakout above ₹39,000 would complete the ascending triangle, with upside potential toward ₹41,000–₹42,000 based on pattern height projection. 🔸 False Breakout / Pullback Scenario: If the index fails to sustain above ₹39,000 and slips below ₹38,000, price may retest the lower trendline support near ₹36,600. Breakdown below this would weaken the structure and delay any bullish move.
Price Action
- ■Price action is structurally positive.
- ■Forming higher highs and higher lows.
Volume Profile
- ■Volume is supportive of the price action.
- ■Wait for volume expansion on breakout.
Key Levels
No zones specified
No zones specified
Invalidation Scenario
A weekly close below the support level invalidates this structure.
Nifty Financial Services Index
charts to-watchDouble Bottom Breakout
Daily Chart
Thesis & Analysis
No detailed thesis provided for this setup.
Price Action
- ■Price action is structurally positive.
- ■Forming higher highs and higher lows.
Volume Profile
- ■Volume is supportive of the price action.
- ■Wait for volume expansion on breakout.
Key Levels
No zones specified
No zones specified
Invalidation Scenario
A weekly close below the support level invalidates this structure.
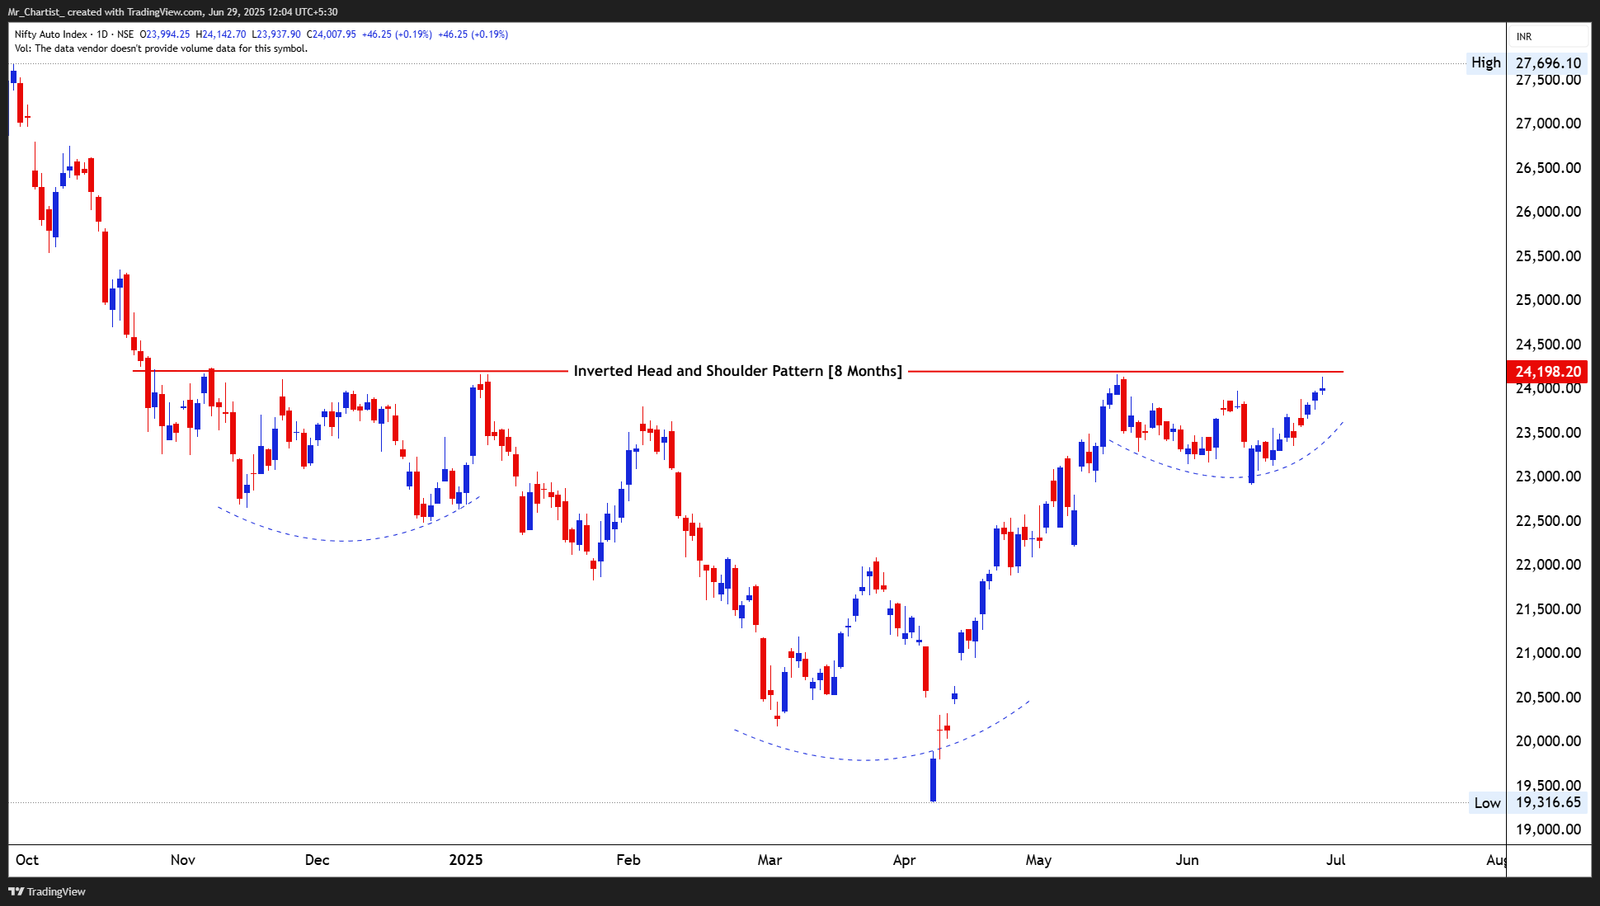
NIFTY FINANCIAL SERVICES INDEX
charts to-watchThe breakout candle is a strong bullish bar, closing near the day’s high with a wide
3 Months (Triangle) + 3 Months (Flag)
Thesis & Analysis
Price Action Overview: The index first completed a symmetrical triangle breakout in March, which transitioned into a strong vertical rally—forming the pole of the current Pole & Flag pattern. After a sharp move, the index entered a tight, sideways flag consolidation between ₹26,950 and ₹26,000, lasting over 2.5 months. The recent breakout above the ₹26,950 zone signals a bullish continuation from the flag, confirming trend resumption with renewed momentum. Candlestick Pattern: The breakout candle is a strong bullish bar, closing near the day’s high with a wide range—indicating solid buyer control. Prior candles within the flag showed consistent higher lows and reduced volatility, classic of pre-breakout behavior. 2. Crucial Support and Resistance Levels Support Levels: ₹26,950: Immediate breakout level and flag resistance turned support. ₹26,000: Flag base and lower bound of recent consolidation. ₹25,250: Pre-flag reaction low and strong demand zone. Resistance Levels: ₹27,500–₹27,600: Short-term measured move target based on pole height. ₹28,000+: Round-number psychological barrier and potential extension zone. Holding above ₹26,950 keeps the breakout valid and active. 3. Strategic Trade Scenarios 🔹 Bullish Continuation Setup: The confirmed breakout above ₹26,950 opens potential toward ₹27,500– ₹27,600, with an extension possible to ₹28,000+. Look for additional bullish candles with higher highs to support the move. 🔸 False Breakout / Pullback Scenario: If the index falls back below ₹26,950 and closes beneath the flag structure, a retest of ₹26,000 or even ₹25,250 may occur. This would suggest failed breakout strength and delay trend continuation.
Price Action
- ■Price action is structurally positive.
- ■Forming higher highs and higher lows.
Volume Profile
- ■Volume is supportive of the price action.
- ■Wait for volume expansion on breakout.
Key Levels
No zones specified
No zones specified
Invalidation Scenario
A weekly close below the support level invalidates this structure.
Nifty Auto Index
charts to-watchDouble Bottom Breakout
Daily Chart
Thesis & Analysis
No detailed thesis provided for this setup.
Price Action
- ■Price action is structurally positive.
- ■Forming higher highs and higher lows.
Volume Profile
- ■Volume is supportive of the price action.
- ■Wait for volume expansion on breakout.
Key Levels
No zones specified
No zones specified
Invalidation Scenario
A weekly close below the support level invalidates this structure.
Chart Image Not Extracted
NIFTY AUTO INDEX
charts to-watchRecent candles are mostly bullish, with the latest few sessions showing stronger
~8 Months Consolidation Base
Thesis & Analysis
Price Action Overview: The index is currently completing a classic inverted head and shoulder pattern with a neckline around ₹24,200. This structure has developed gradually over 8 months, with well-formed left and right shoulders flanking a rounded head near the April low. Price has been rising steadily through June, forming higher lows and showing strong rotational buying interest near support zones. The current price is testing the neckline, and a breakout above ₹24,200 would mark a major bullish confirmation. Candlestick Pattern: Recent candles are mostly bullish, with the latest few sessions showing stronger body candles and reduced lower wicks—indicative of sustained buying pressure near breakout level. The pattern exhibits a gradual curvature into the neckline, which enhances its breakout reliability. 2. Crucial Support and Resistance Levels Support Levels: ₹23,500: Right shoulder support and recent consolidation base. ₹22,800: Swing low within the right shoulder zone. ₹21,000: Head of the pattern and strong demand base. Resistance Levels: ₹24,200: Neckline zone and immediate breakout trigger. ₹25,000–₹25,500: Initial upside target based on pattern projection. ₹27,700: All-time high zone and long-term structural barrier. A breakout above ₹24,200 would validate the reversal pattern and suggest medium-term trend change. 3. Strategic Trade Scenarios 🔹 Bullish Breakout Setup: If the index breaks and closes above ₹24,200, it confirms the inverted H&S breakout, with immediate targets in the ₹25,000–₹25,500 range and longer-term potential toward ₹27,700. 🔸 Failure / Pullback Scenario: In case the index gets rejected from the neckline and falls below ₹23,500, a retest of lower supports around ₹22,800 or deeper toward the pattern’s midpoint may unfold before another attempt.
Price Action
- ■Price action is structurally positive.
- ■Forming higher highs and higher lows.
Volume Profile
- ■Volume is supportive of the price action.
- ■Wait for volume expansion on breakout.
Key Levels
No zones specified
No zones specified
Invalidation Scenario
A weekly close below the support level invalidates this structure.
SEBI Registered Research Analyst — INH000015297 (INVESTOLOGY). Investment in securities market are subject to market risks. Read all related documents carefully before investing. The content provided is for educational purposes only and should not be considered as financial advice. Past performance is not indicative of future results.