Coming Soon
The Weekend Visual ChartBook is currently undergoing a massive upgrade. Stay tuned for a world-class reading experience.
Return HomeWeekend Visual ChartBook
Edition #272
Extracted Edition
Market Pulse
LiveReal-time index prices above. Detailed index chart analysis below in the Indices section.
Charts to Watch
Setups forming favorable structures
Nifty 50 Index
charts to-watchDouble Bottom Breakout
Daily Chart
Thesis & Analysis
No detailed thesis provided for this setup.
Price Action
- ■Price action is structurally positive.
- ■Forming higher highs and higher lows.
Volume Profile
- ■Volume is supportive of the price action.
- ■Wait for volume expansion on breakout.
Key Levels
No zones specified
No zones specified
Invalidation Scenario
A weekly close below the support level invalidates this structure.
NIFTY 50 INDEX
charts to-watchDouble Bottom Breakout
2.5 Months (Daily Chart – Short-Term Continuation Setup)
Thesis & Analysis
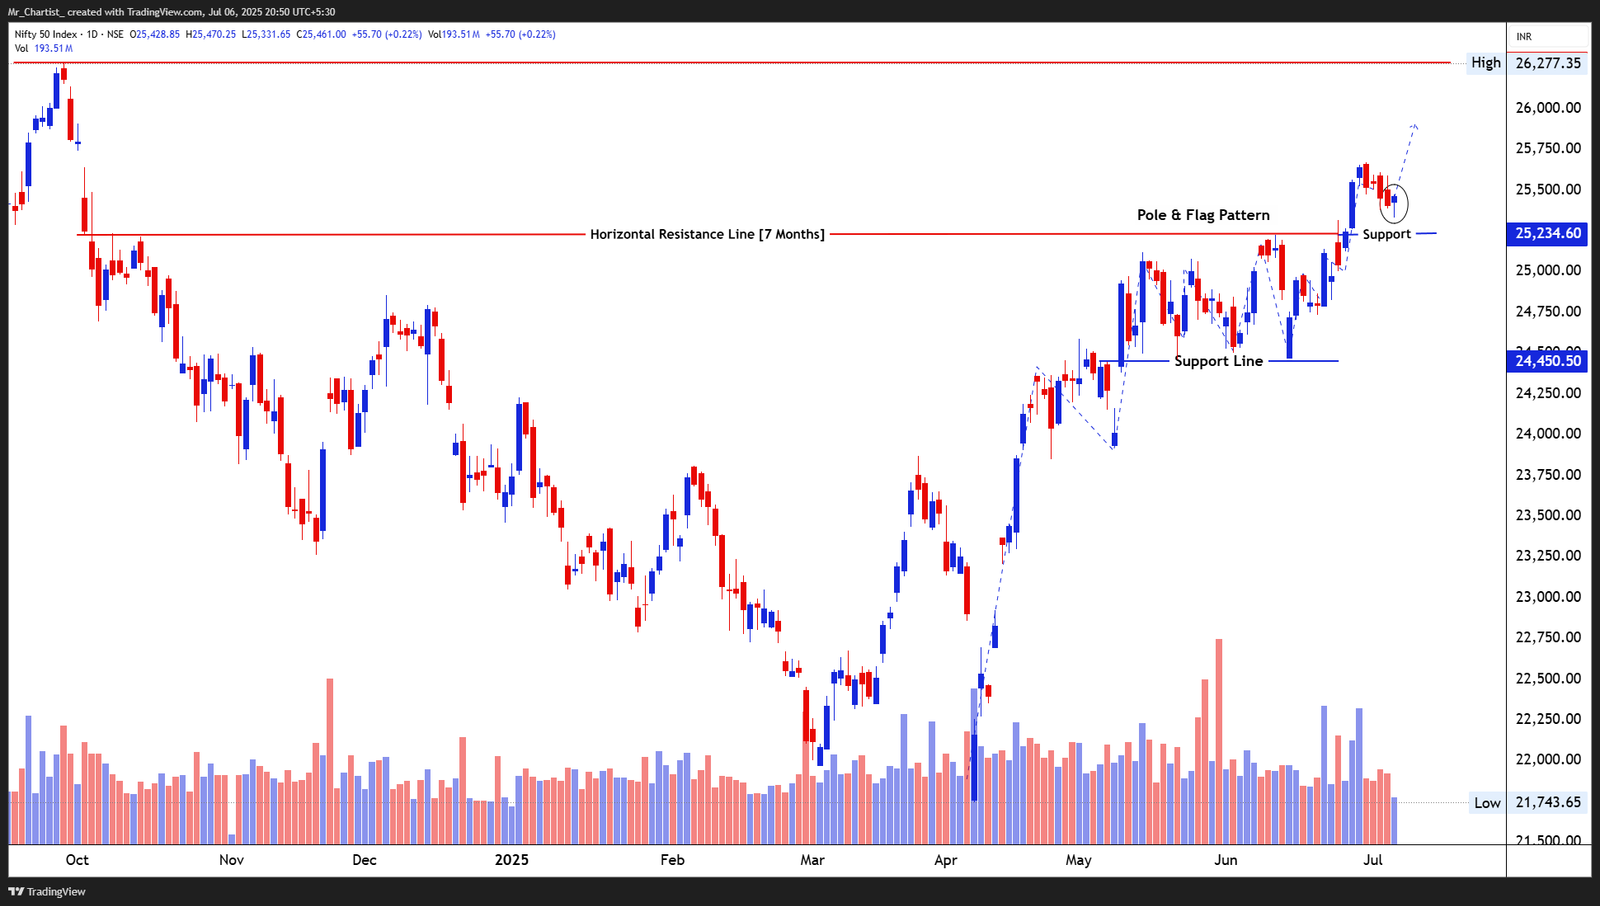
Price Action Overview: After a strong vertical rally, Nifty 50 entered a short-term flag consolidation, forming a well-defined rectangular drift post up-move. The pattern resembles a classic bullish continuation structure. A decisive breakout from the flag last week propelled the index toward new short-term highs. Currently, the index is retracing modestly and hovering just above the breakout level (~25,234), testing it as fresh support. The minor red candle inside the circle reflects temporary hesitation near the upper channel, which is normal in post-breakout digestion phases. Candlestick Behavior: Recent candles show reduced range and minor upper wicks—suggesting supply emergence —but the structure remains constructive as long as the index sustains above prior resistance. Volume Analysis: Volumes increased sharply during the breakout from the flag pattern—indicative of genuine buying participation. Recent dip is accompanied by relatively lower volume, favoring the bullish continuation thesis unless volume expands on red candles. 2. Crucial Support and Resistance Levels Support Zones: 25,234: Flag breakout retest zone; key pivot for bullish validation. 24,450: Range bottom and previous consolidation support. 23,900: Anchored structural swing base from May. Resistance Zones: 26,277: All-time high; psychological resistance and pattern target. 26,450–26,600: Measured extension zone of the pole projection. Any close above 26,277 with rising volume would confirm trend extension. 3. Strategic Trade Scenarios 🔸 Bullish Continuation Setup: If price sustains above 25,234 with narrowing candles followed by a strong daily close, it may resume its rally toward 26,277, eventually extending to 26,600 if momentum continues. Watch for follow-through candles supported by a volume surge. 🔹 Failed Breakout Scenario: A breakdown below 25,234, especially with expanding red volume, could indicate a failed flag breakout. This opens downside testing toward 24,450 first, and below that to 23,900, where structural trend support exists.
Price Action
- ■Price action is structurally positive.
- ■Forming higher highs and higher lows.
Volume Profile
- ■Volume is supportive of the price action.
- ■Wait for volume expansion on breakout.
Key Levels
No zones specified
No zones specified
Invalidation Scenario
A weekly close below the support level invalidates this structure.
Nifty SmallCap 100 Index
charts to-watchDouble Bottom Breakout
Daily Chart
Thesis & Analysis
No detailed thesis provided for this setup.
Price Action
- ■Price action is structurally positive.
- ■Forming higher highs and higher lows.
Volume Profile
- ■Volume is supportive of the price action.
- ■Wait for volume expansion on breakout.
Key Levels
No zones specified
No zones specified
Invalidation Scenario
A weekly close below the support level invalidates this structure.
NIFTY SMALLCAP 100 INDEX
charts to-watchDouble Bottom Breakout
6 Months (Daily Chart – Medium-Term Reversal)
Thesis & Analysis
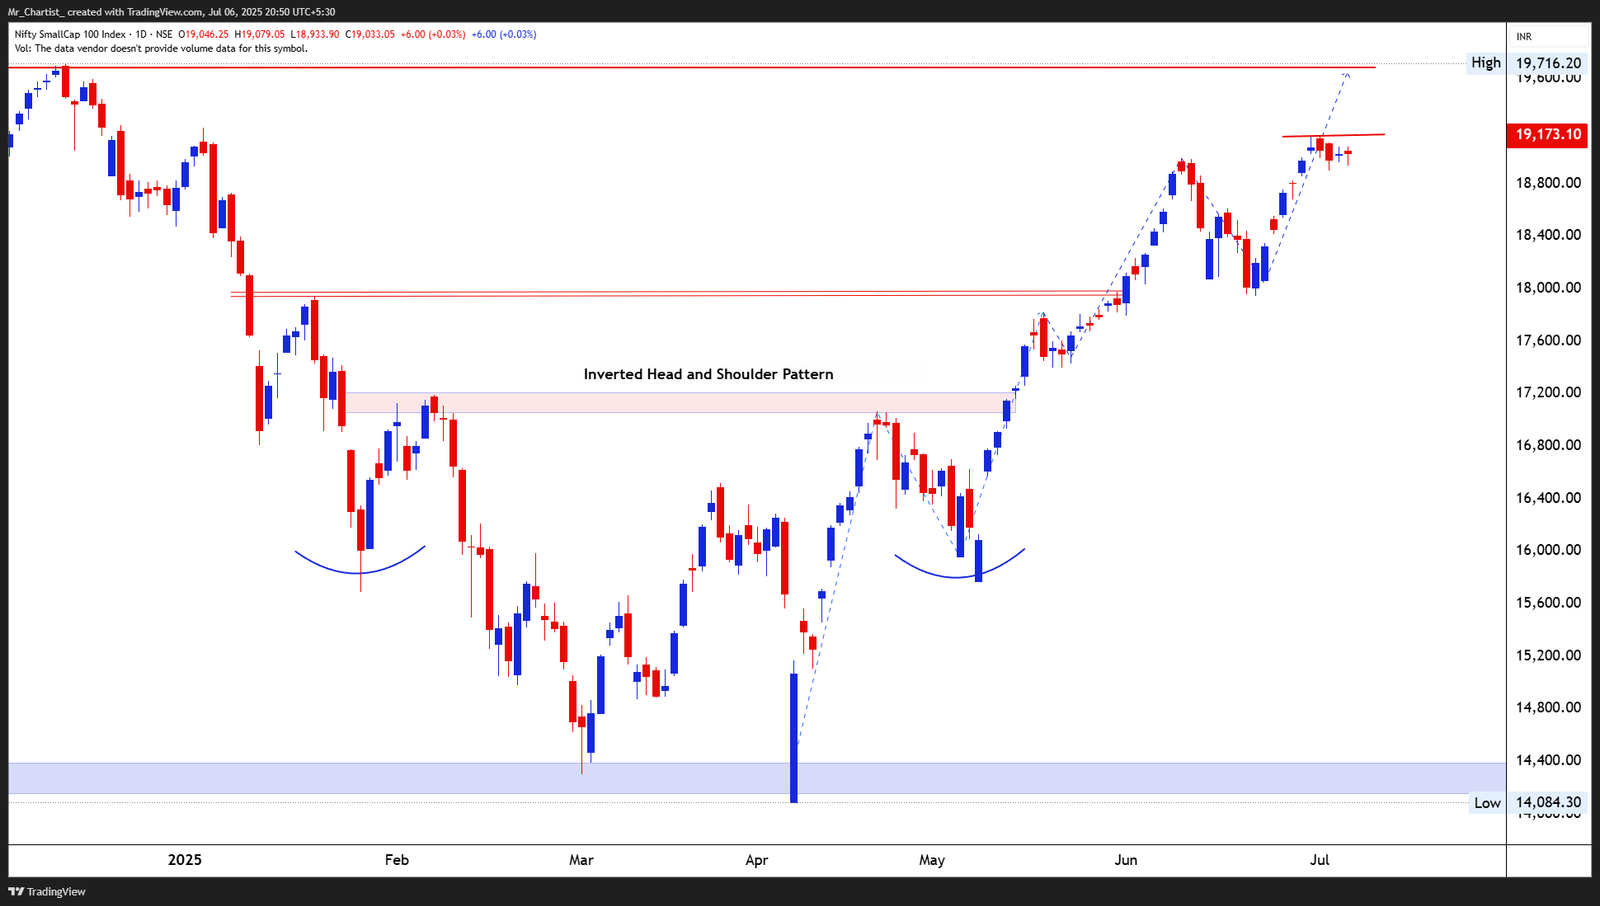
Price Action Overview: The index completed a classic inverted head and shoulders formation, marking a medium-term trend reversal from its prior downtrend. The pattern’s neckline (~17,200) was convincingly breached in late May, triggering a vertical rally that extended toward 19,173, where it is currently pausing. Post-breakout price action has shifted into a small consolidation, forming a tight range near the top, often seen as a bullish flag or base-on-base structure—indicative of digestion rather than rejection. Candlestick Behavior: The recent candles are tight-bodied with minimal upper shadows—signaling reduced volatility and balanced participation near highs. This behavior leans neutral-positive unless a sharp rejection appears. 2. Crucial Support and Resistance Levels Support Zones: 18,850–18,730: Consolidation range support; pivotal for short-term control. 18,000–17,800: Neckline zone of the IHS pattern; serves as major trend validation. 16,850: Shoulder base; critical if deep pullback emerges. Resistance Zones: 19,173: Immediate ceiling; range top and minor double-top risk if not surpassed. 19,716: Pattern-measured move projection. 19,900–20,000: Psychological round number and swing extension zone. 3. Strategic Trade Scenarios 🔸 Breakout Continuation Setup: A close above 19,173 with bullish candles (preferably marubozu or wide-range bars) would confirm strength resumption toward 19,716 and potentially 20,000. Continuity depends on narrow-range pause followed by breakout volume. 🔹 Reversal Failure Setup: Breakdown below 18,730 on large red candles could weaken momentum and invite mean reversion toward 18,000. This would place the breakout under threat and raise caution if accompanied by lower-high rejection setups.
Price Action
- ■Price action is structurally positive.
- ■Forming higher highs and higher lows.
Volume Profile
- ■Volume is supportive of the price action.
- ■Wait for volume expansion on breakout.
Key Levels
No zones specified
No zones specified
Invalidation Scenario
A weekly close below the support level invalidates this structure.
Nifty Realty Index
charts to-watchDouble Bottom Breakout
Daily Chart
Thesis & Analysis
No detailed thesis provided for this setup.
Price Action
- ■Price action is structurally positive.
- ■Forming higher highs and higher lows.
Volume Profile
- ■Volume is supportive of the price action.
- ■Wait for volume expansion on breakout.
Key Levels
No zones specified
No zones specified
Invalidation Scenario
A weekly close below the support level invalidates this structure.
NIFTY REALTY INDEX
charts to-watchDouble Bottom Breakout
3 Months (Daily Chart – Mid-Term Bullish Reversal)
Thesis & Analysis
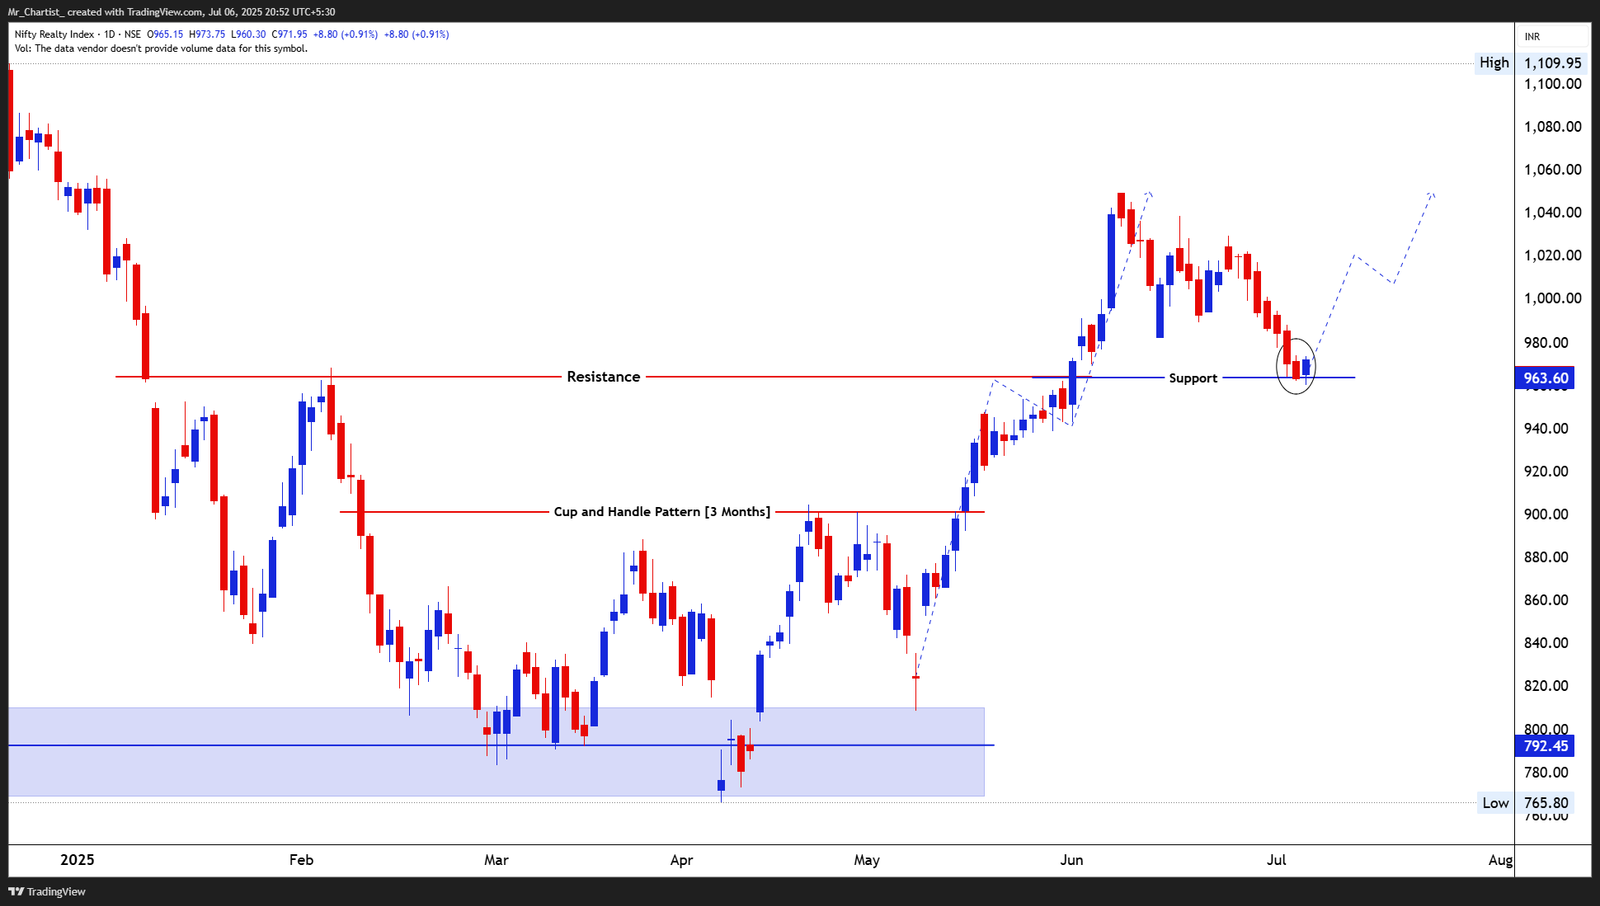
Price Action Overview: The index completed a well-formed cup and handle breakout, confirming mid- term bullish intent. Following a sharp breakout rally, prices entered a corrective phase, forming a pullback that recently tested the breakout level (~963)—a classic retest of prior resistance turned support. The most recent candle shows a potential rejection wick at support, suggesting early signs of dip buying. The structure overall respects breakout-retest dynamics, hinting at a possible continuation leg. Candlestick Behavior: A small-bodied candle with lower shadow at key support suggests buyers defending this level. No aggressive reversal yet, but stabilizing signs are emerging. 2. Crucial Support and Resistance Levels Support Zones: 963–960: Breakout retest level; immediate support under watch. 920: Handle base; mid-term pivot for trend integrity. 800–790: Pattern origin zone; deeper correction floor if sentiment shifts. Resistance Zones: 1,000–1,020: Minor resistance band formed during pause. 1,050: Recent swing high; confirmation zone for trend extension. 1,110: Pattern measured target zone based on prior cup depth. 3. Strategic Trade Scenarios 🔸 Pullback Reversal Setup: If price holds above 960 and prints a bullish confirmation candle (e.g., bullish engulfing, hammer), it would validate the breakout-retest-bounce sequence. Upside targets lie at 1,020 and 1,050 with potential follow-through to 1,110. 🔹 Breakdown Caution Setup: Failure to hold 960 with a breakdown candle may drag price to 920, invalidating the short-term setup and pushing it into a broader consolidation phase.
Price Action
- ■Price action is structurally positive.
- ■Forming higher highs and higher lows.
Volume Profile
- ■Volume is supportive of the price action.
- ■Wait for volume expansion on breakout.
Key Levels
No zones specified
No zones specified
Invalidation Scenario
A weekly close below the support level invalidates this structure.
Nifty Pharma Index
charts to-watchDouble Bottom Breakout
Daily Chart
Thesis & Analysis
No detailed thesis provided for this setup.
Price Action
- ■Price action is structurally positive.
- ■Forming higher highs and higher lows.
Volume Profile
- ■Volume is supportive of the price action.
- ■Wait for volume expansion on breakout.
Key Levels
No zones specified
No zones specified
Invalidation Scenario
A weekly close below the support level invalidates this structure.
NIFTY PHARMA INDEX
charts to-watchDouble Bottom Breakout
6 Months (Daily Chart – Medium-Term Bullish Bias)
Thesis & Analysis
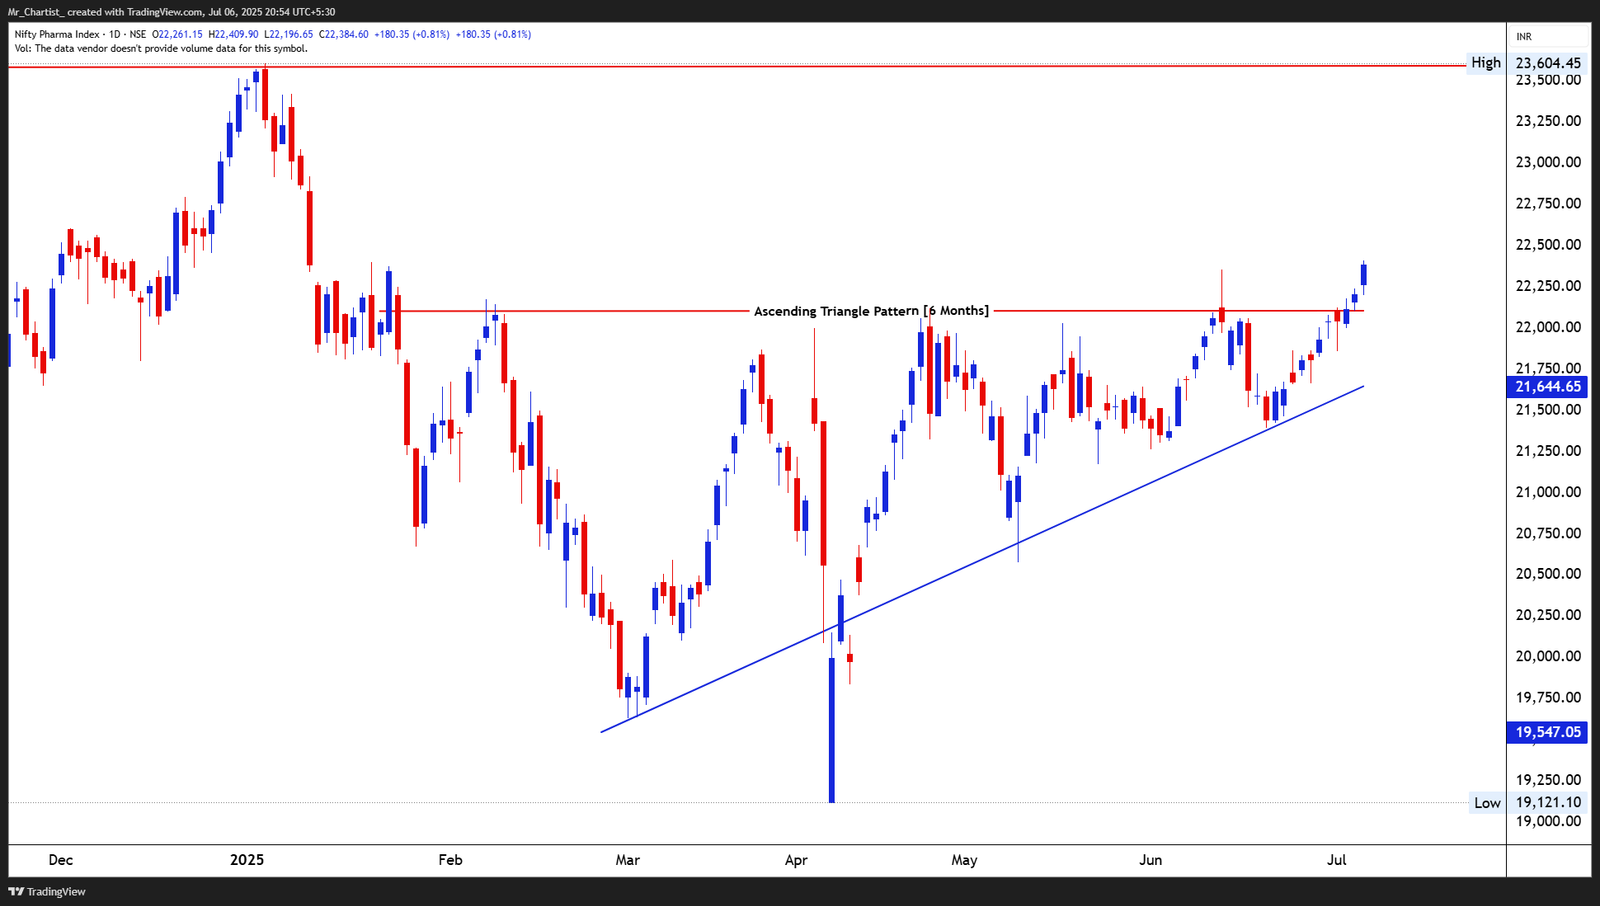
Price Action Overview: The index is currently in the midst of a confirmed ascending triangle breakout, a pattern that typically suggests accumulation and strength. The horizontal resistance near 22,200 acted as a ceiling for several months, while price formed higher lows, compressing into the resistance zone. Price has now closed above this resistance, indicating potential range expansion. The move is coming after multiple rejections at the top, and the latest breakout attempt seems cleaner with less overhead congestion. Candlestick Observations: The breakout bar was followed by another strong candle with a higher close, indicating follow-through. The price is now sustaining above the prior breakout zone. 2. Crucial Support and Resistance Levels Support Zones: 22,200: Immediate breakout level – now acting as short-term support. 21,750–21,600: Rising trendline zone formed by previous swing lows. 19,550: Base support from prior large impulse—critical if momentum fades. Resistance Zones: 23,000–23,100: Minor hurdle from past reversal clusters. 23,600: Pattern projected target and historical supply zone. 24,000+: Psychological round number and potential breakout extension zone. 3. Strategic Trade Scenarios 🔸 Breakout Continuation Setup: Sustained move above 22,200 confirms breakout structure. If price continues to hold above this level with intraday dips being bought, potential upside toward 23,100 and 23,600 exists. This setup remains valid as long as the rising trendline stays intact. 🔹 Pullback Retest Setup: If price retests 22,200 and shows bullish price action (hammer, bullish engulfing) with tight-range candles, it could offer a fresh entry confirmation for a higher move. Breakdown below 21,600 would weaken the setup and suggest a failed breakout trap.
Price Action
- ■Price action is structurally positive.
- ■Forming higher highs and higher lows.
Volume Profile
- ■Volume is supportive of the price action.
- ■Wait for volume expansion on breakout.
Key Levels
No zones specified
No zones specified
Invalidation Scenario
A weekly close below the support level invalidates this structure.
Nifty Midcap 100 Index
charts to-watchDouble Bottom Breakout
Daily Chart
Thesis & Analysis
No detailed thesis provided for this setup.
Price Action
- ■Price action is structurally positive.
- ■Forming higher highs and higher lows.
Volume Profile
- ■Volume is supportive of the price action.
- ■Wait for volume expansion on breakout.
Key Levels
No zones specified
No zones specified
Invalidation Scenario
A weekly close below the support level invalidates this structure.
NIFTY MIDCAP 100 INDEX
charts to-watchDouble Bottom Breakout
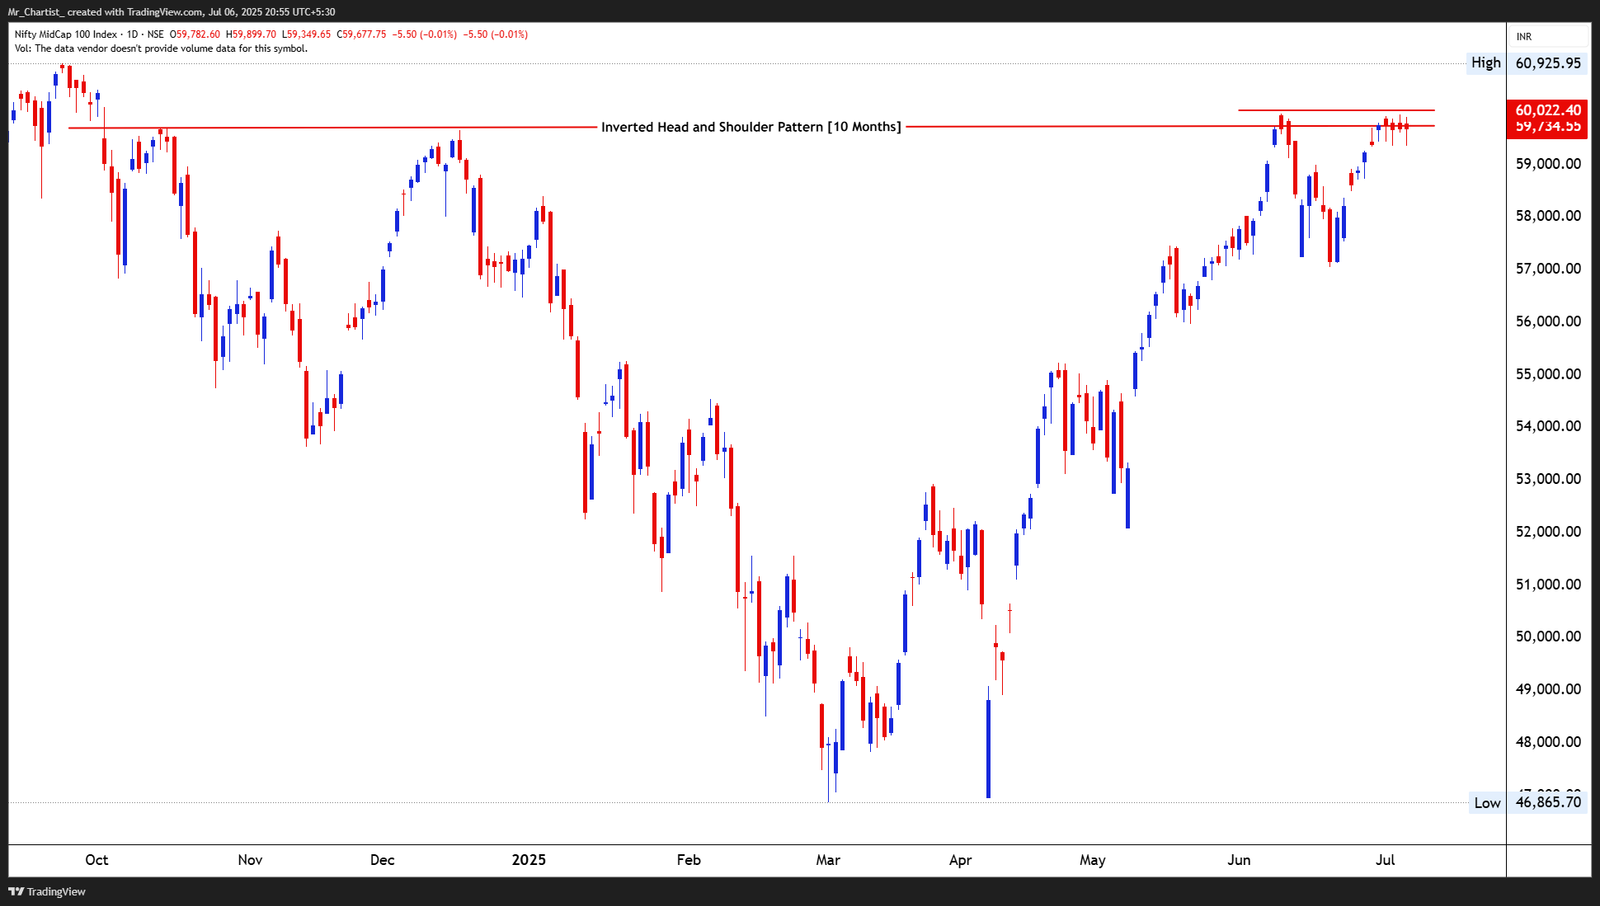
10 Months (Daily Chart – Long Base Reversal)
Thesis & Analysis
Price Action Overview: The index has developed a well-defined Inverted Head and Shoulder pattern with nearly symmetrical shoulders and a horizontal neckline near 60,020. This formation is typically considered a strong trend reversal signal, especially when appearing after a prolonged decline like the one witnessed from late 2023 to early 2024. Recent price action shows a tight consolidation just beneath the neckline, indicating reduced volatility and potential energy build-up for a breakout. The structure has matured over several months, increasing reliability. Candlestick Observations: Price has printed a string of narrow-bodied candles at the neckline, lacking upper shadows. This points to a controlled consolidation rather than aggressive supply, increasing breakout probability. 2. Crucial Support and Resistance Levels Support Zones: 59,300–59,400: Consolidation shelf and right shoulder low. 57,700: Left shoulder reaction low – structure fails if breached. 55,000: Deep support aligning with neckline base zone. Resistance Zones: 60,020–60,100: Key neckline and breakout trigger zone. 60,925: All-time high zone—acts as a potential target/resistance. 62,000+: Projected move based on pattern depth extension. 3. Strategic Trade Scenarios 🔸 Breakout Acceleration Setup: A daily close above 60,100 would confirm pattern breakout. If accompanied by range expansion and preferably volume, the upside could extend toward 61,000– 62,000. Breakout gains credibility if sustained for 2–3 sessions. 🔹 False Breakout or Retest Setup: If the index fails to sustain above 60,100 and drops back under 59,400, it suggests a failed breakout attempt. In such a case, price may revisit 57,700 zone for support retest before another rally attempt.
Price Action
- ■Price action is structurally positive.
- ■Forming higher highs and higher lows.
Volume Profile
- ■Volume is supportive of the price action.
- ■Wait for volume expansion on breakout.
Key Levels
No zones specified
No zones specified
Invalidation Scenario
A weekly close below the support level invalidates this structure.
Nifty IT Index
charts to-watchDouble Bottom Breakout
Daily Chart
Thesis & Analysis
No detailed thesis provided for this setup.
Price Action
- ■Price action is structurally positive.
- ■Forming higher highs and higher lows.
Volume Profile
- ■Volume is supportive of the price action.
- ■Wait for volume expansion on breakout.
Key Levels
No zones specified
No zones specified
Invalidation Scenario
A weekly close below the support level invalidates this structure.
NIFTY IT INDEX
charts to-watchDouble Bottom Breakout
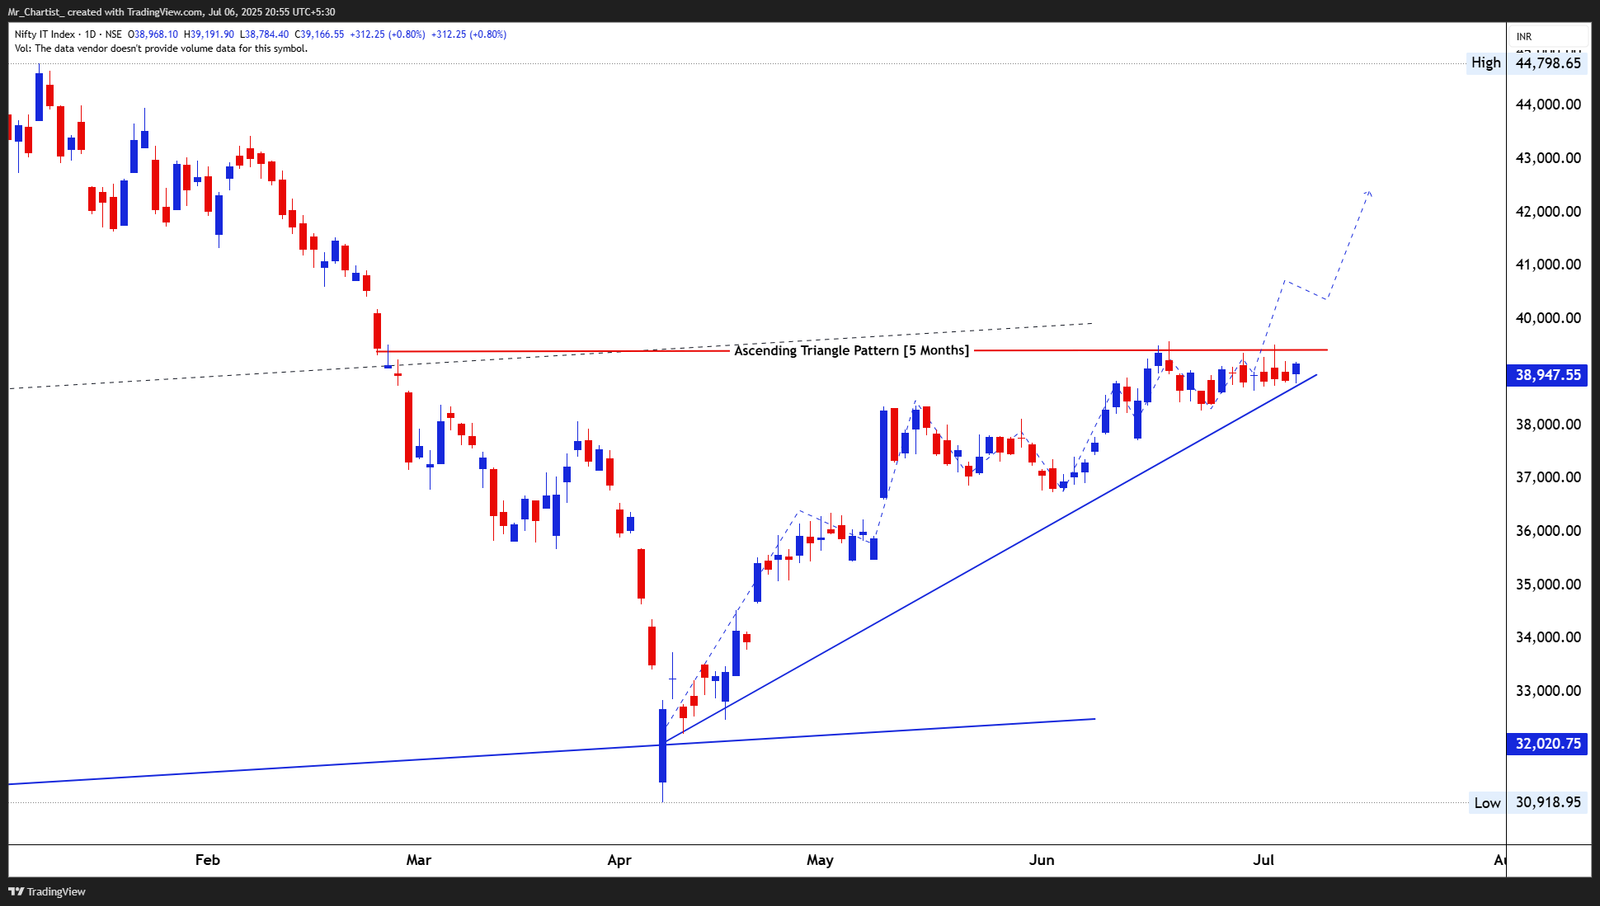
5 Months (Daily Chart – Continuation Formation)
Thesis & Analysis
Price Action Overview: The index has formed a 5-month Ascending Triangle, marked by a flat resistance near the 39,900–40,000 zone and higher swing lows, denoting rising demand on every dip. The price is currently coiling tightly between the resistance ceiling and the rising support line—signaling compression and energy build-up typical before a breakout. This structure follows a prior advance, making it a classic continuation setup. The price is hugging the apex with increasing tightness, a sign of potential imminent expansion. Candlestick Observations: Recent candles show small-bodied formations with reduced wick activity and minor bearish shadows, reflecting low volatility and control. No decisive bearish rejection so far. 2. Crucial Support and Resistance Levels Support Zones: 38,700: Rising trendline support—holding since April. 37,250: Swing low and structural support below the pattern. 35,600–36,000: Trend base and previous gap zone; critical breakdown level. Resistance Zones: 39,900–40,000: Horizontal resistance and pattern breakout level. 42,000: Projected breakout target based on pattern height. 44,800: Previous high from early 2024—long-term resistance. 3. Strategic Trade Scenarios 🔸 Breakout Rally Setup: A strong daily close above 40,000 with range expansion and ideally above-average volume would confirm an ascending triangle breakout. Price could then target 42,000–42,500 in the short term, with a potential extended move toward 44,800. 🔹 Retest or Breakdown Setup: If the index breaks below 38,700 and closes beneath the trendline, this would negate the ascending triangle. In that case, a drift back to 37,250 or lower cannot be ruled out, especially if accompanied by broad market weakness.
Price Action
- ■Price action is structurally positive.
- ■Forming higher highs and higher lows.
Volume Profile
- ■Volume is supportive of the price action.
- ■Wait for volume expansion on breakout.
Key Levels
No zones specified
No zones specified
Invalidation Scenario
A weekly close below the support level invalidates this structure.
Nifty Energy Index
charts to-watchDouble Bottom Breakout
Daily Chart
Thesis & Analysis
No detailed thesis provided for this setup.
Price Action
- ■Price action is structurally positive.
- ■Forming higher highs and higher lows.
Volume Profile
- ■Volume is supportive of the price action.
- ■Wait for volume expansion on breakout.
Key Levels
No zones specified
No zones specified
Invalidation Scenario
A weekly close below the support level invalidates this structure.
NIFTY ENERGY INDEX
charts to-watchDouble Bottom Breakout
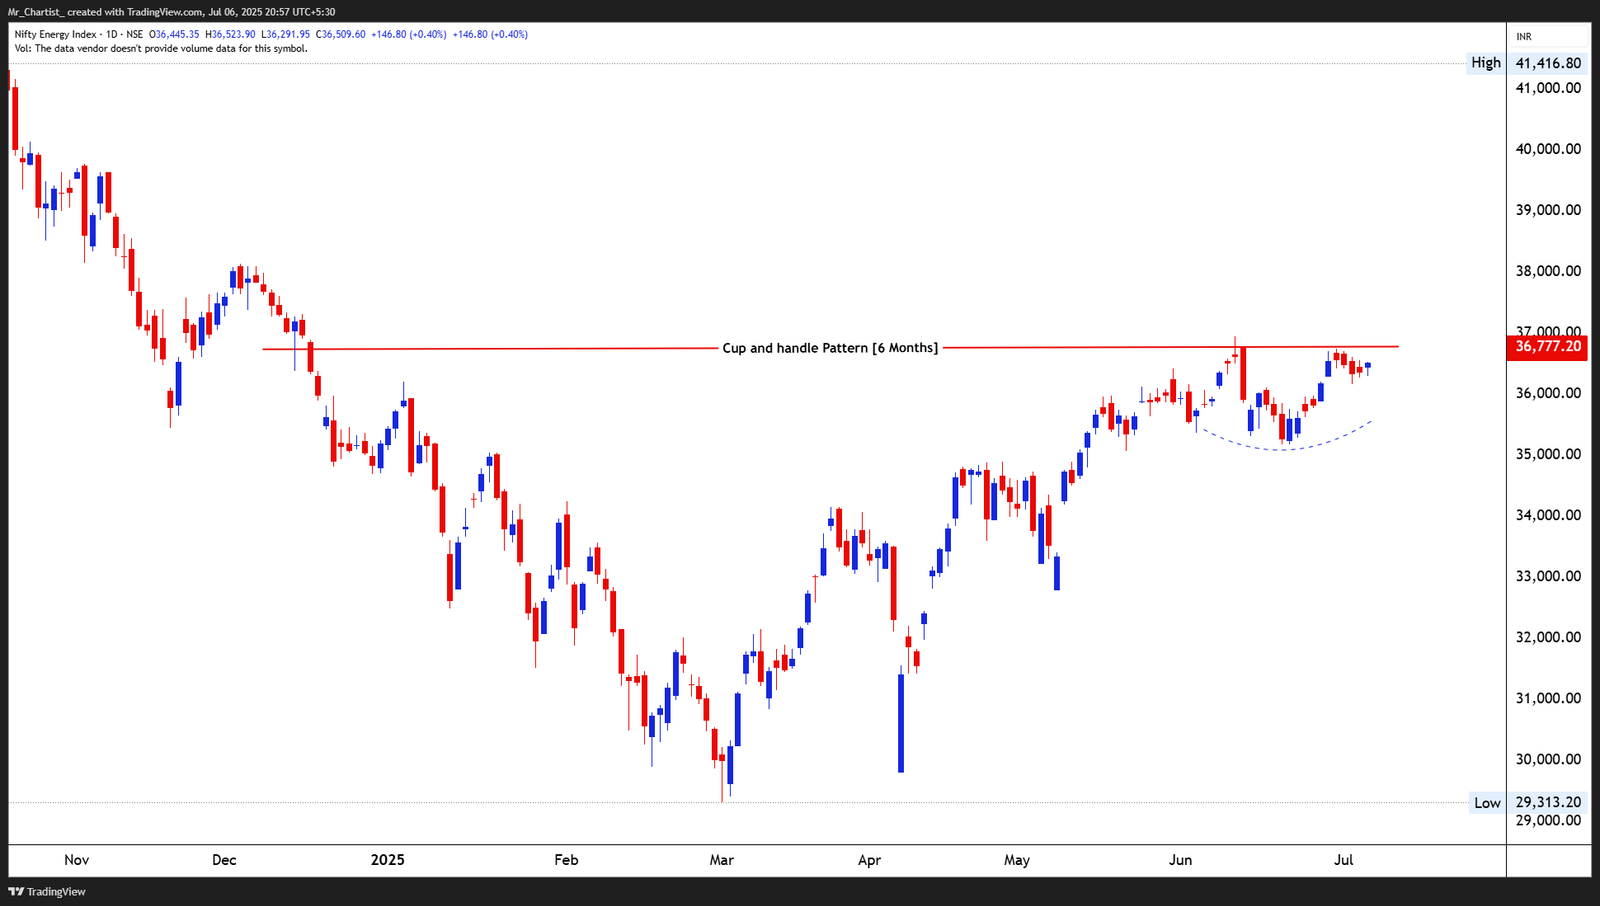
6 Months (Daily Chart – Medium-Term Base Formation)
Thesis & Analysis
Price Action Overview: The index has been constructing a classic Cup and Handle pattern over the last 6 months. The rounded bottom formation from January to May shows steady accumulation, followed by a shallow handle forming through June–July, marked by sideways drift near the neckline. The handle portion reflects controlled consolidation rather than a deep retracement—indicating latent bullish momentum. Currently, the price is pressing against the neckline resistance around 36,800– 37,000, which has been tested multiple times but not yet breached. The coiling beneath resistance with higher lows is typical behavior before a bullish breakout. Candlestick Observations: Recent candles are narrow-bodied, indicating indecision but also contraction. There's an absence of strong rejection wicks or aggressive selling, suggesting the bulls remain in control. 2. Crucial Support and Resistance Levels Support Levels: 36,000–36,100: Handle base support and immediate reaction zone. 35,300: Swing low of the handle; violation here weakens bullish structure. 34,000: Cup base—last stronghold of structural integrity. Resistance Levels: 36,800–37,000: Pattern neckline and breakout trigger zone. 38,800–39,000: Measured target zone post breakout. 41,400: Multi-month high; long-term resistance. 3. Strategic Trade Scenarios 🔸 Breakout Continuation Setup: A decisive close above 37,000 with rising volume would validate the Cup and Handle breakout. This could initiate a swift move toward 38,800–39,000, with continuation potential toward 41,400 if broader market momentum supports. 🔹 Handle Breakdown Scenario: Failure to hold 36,000 could lead to a drop toward 35,300. A daily close below that level may invalidate the pattern and indicate a deeper correction or range reset.
Price Action
- ■Price action is structurally positive.
- ■Forming higher highs and higher lows.
Volume Profile
- ■Volume is supportive of the price action.
- ■Wait for volume expansion on breakout.
Key Levels
No zones specified
No zones specified
Invalidation Scenario
A weekly close below the support level invalidates this structure.
Nifty Auto Index
charts to-watchDouble Bottom Breakout
Daily Chart
Thesis & Analysis
No detailed thesis provided for this setup.
Price Action
- ■Price action is structurally positive.
- ■Forming higher highs and higher lows.
Volume Profile
- ■Volume is supportive of the price action.
- ■Wait for volume expansion on breakout.
Key Levels
No zones specified
No zones specified
Invalidation Scenario
A weekly close below the support level invalidates this structure.
Chart Image Not Extracted
NIFTY AUTO INDEX
charts to-watchDouble Bottom Breakout
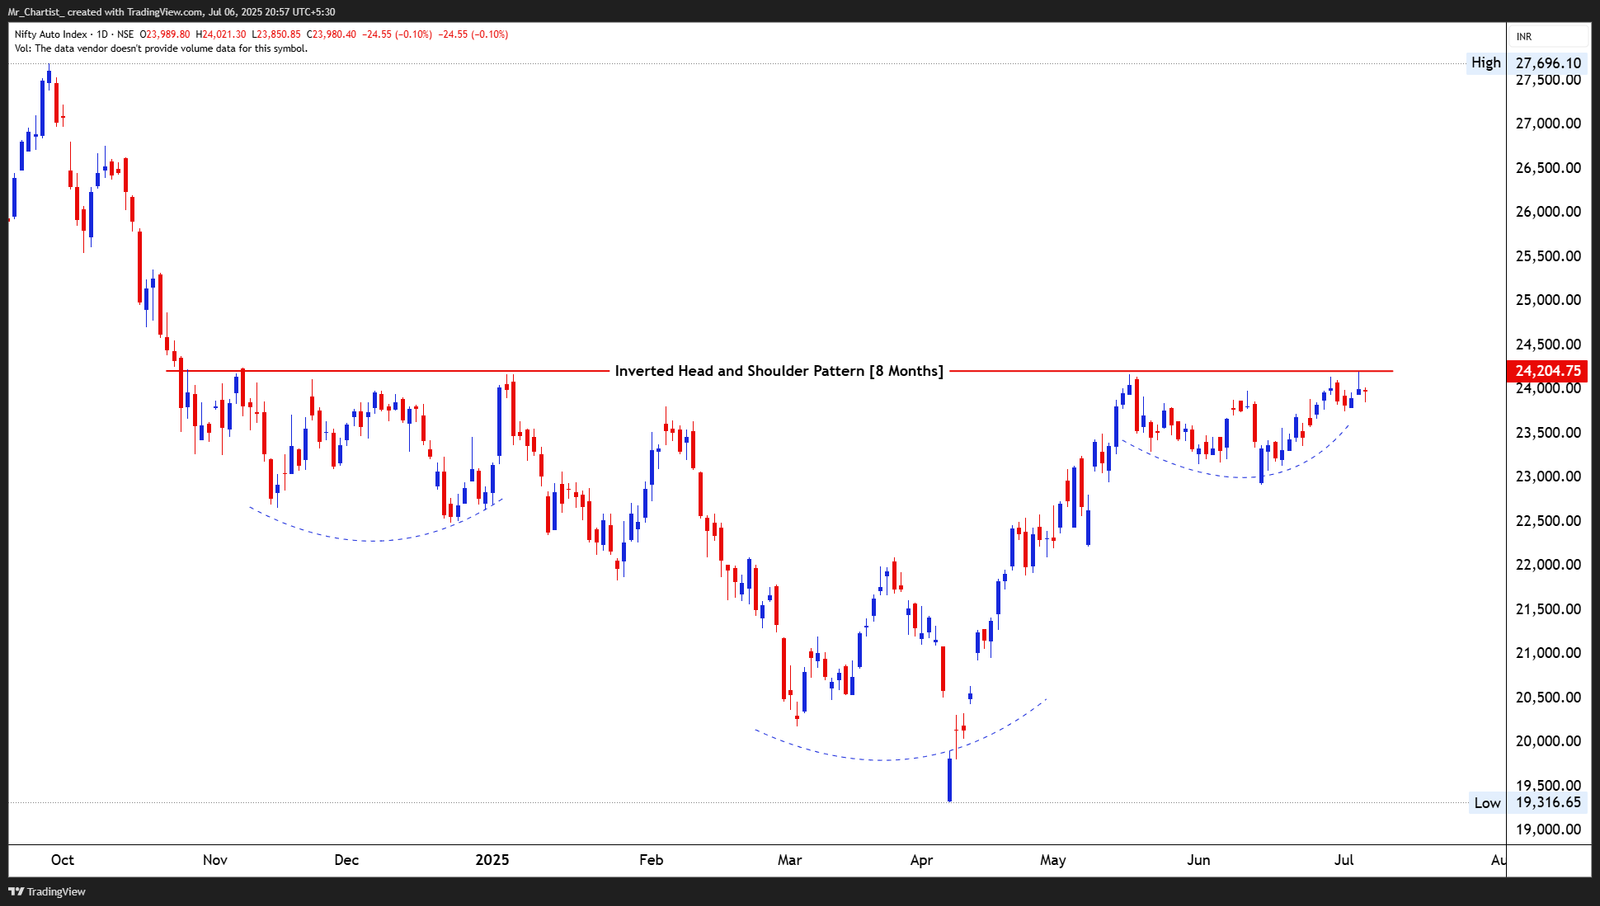
8 Months (Daily Chart – Medium-Term Reversal Base)
Thesis & Analysis
Price Action Overview: The index is completing an Inverted Head and Shoulder (IH&S) pattern, a classic bullish reversal structure. The left shoulder formed in Nov–Dec 2024, the head formed in Feb–Apr 2025, and the right shoulder is still finalizing with higher lows. The neckline resistance at ~24,200 is being tested again, marking the third touch since the formation began—a strong indicator of potential breakout energy. Candlestick Behavior: Recent candles show reduced body sizes near the neckline, indicating tension and potential energy build-up. Lack of long upper wicks suggests sellers are not dominating. 2. Crucial Support and Resistance Levels Support Zones: 23,500: Immediate swing low, also forming the right shoulder base. 22,600–22,800: Key horizontal support. 21,400–21,600: Head base and multi-month bottom. Resistance Zones: 24,200–24,300: Neckline breakout level; confirmation on strong daily close. 25,500–25,800: Projected pattern target zone post-breakout. 27,600: Major multi-month high and long-term cap. 3. Strategic Trade Scenarios 🔸 Primary Bullish Setup: A daily close above 24,300 with expansion in volume confirms the breakout from the IH&S. This setup carries a potential upside toward 25,500, with longer-term projection up to 27,600. 🔹 Alternate Weakness Setup: Failure to break above the neckline and sustained rejection could pull the index back toward 23,500. A break below 22,800 would invalidate the IH&S structure and suggest short-term weakness.
Price Action
- ■Price action is structurally positive.
- ■Forming higher highs and higher lows.
Volume Profile
- ■Volume is supportive of the price action.
- ■Wait for volume expansion on breakout.
Key Levels
No zones specified
No zones specified
Invalidation Scenario
A weekly close below the support level invalidates this structure.
SEBI Registered Research Analyst — INH000015297 (INVESTOLOGY). Investment in securities market are subject to market risks. Read all related documents carefully before investing. The content provided is for educational purposes only and should not be considered as financial advice. Past performance is not indicative of future results.