Coming Soon
The Weekend Visual ChartBook is currently undergoing a massive upgrade. Stay tuned for a world-class reading experience.
Return HomeWeekend Visual ChartBook
Edition #273
Extracted Edition
Market Pulse
LiveReal-time index prices above. Detailed index chart analysis below in the Indices section.
Bearish Charts [F&O]
Short setups indicating weakness
KARNIKA INDUSTRIES LTD
bearish fnoDouble Bottom Breakout
Daily Chart
Thesis & Analysis
No detailed thesis provided for this setup.
Price Action
- ■Price action is structurally positive.
- ■Forming higher highs and higher lows.
Volume Profile
- ■Volume is supportive of the price action.
- ■Wait for volume expansion on breakout.
Key Levels
No zones specified
No zones specified
Invalidation Scenario
A weekly close below the support level invalidates this structure.
KARNIKA INDUSTRIES LTD
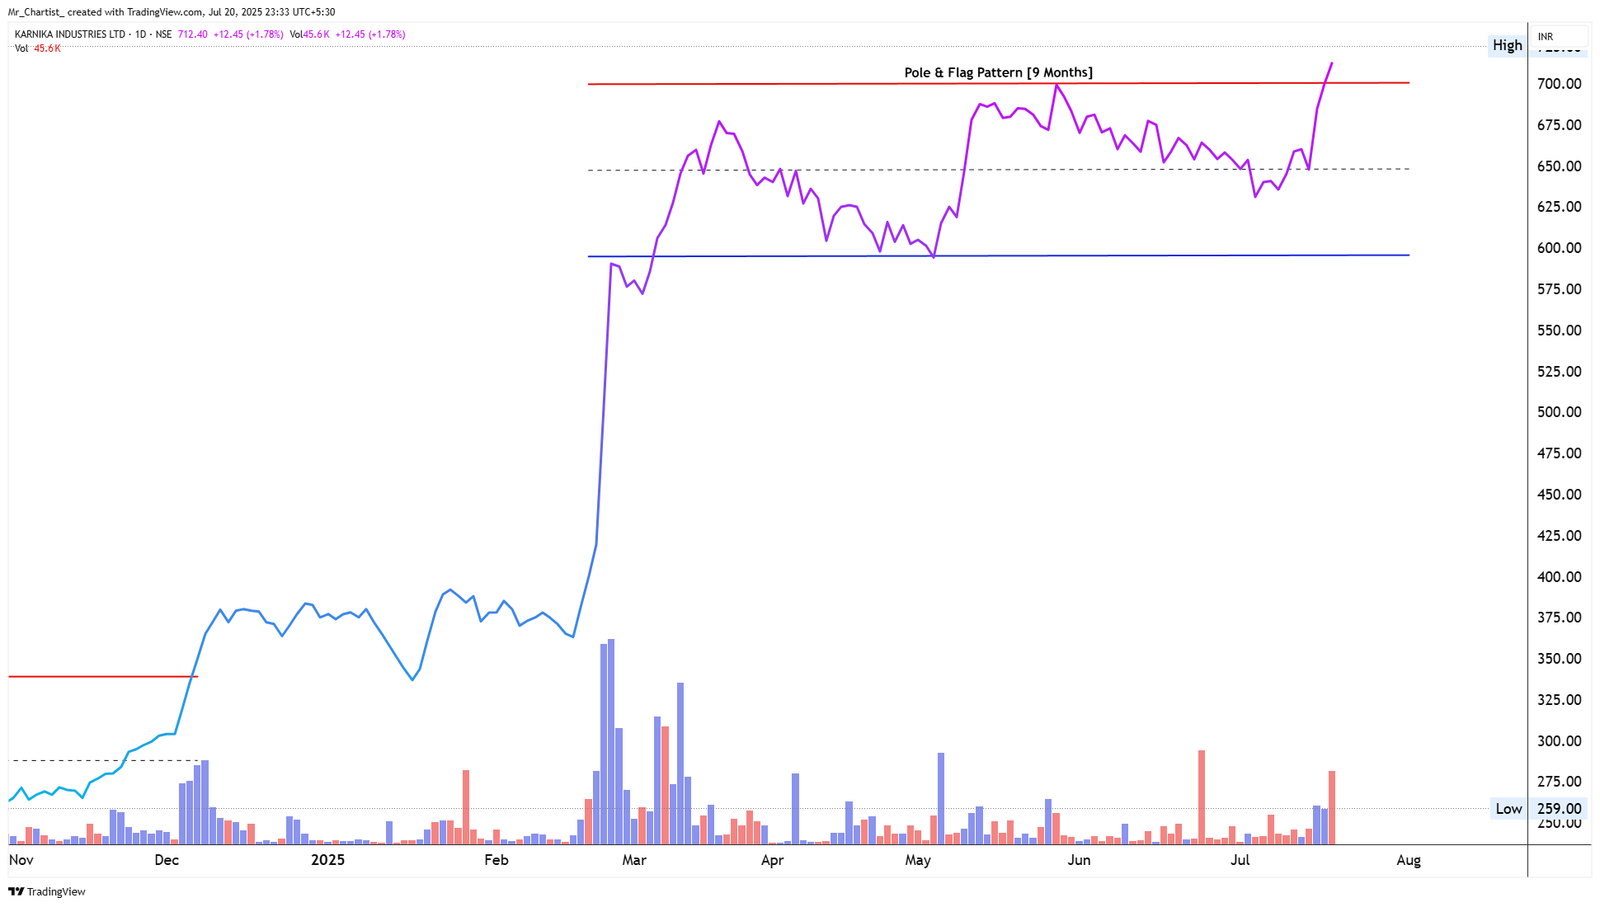
bearish fnoPole & Flag
9 Months (Daily Chart – Long-Term Bullish Continuation Setup)
Thesis & Analysis
Karnika Industries has been forming a Pole and Flag pattern, which began with a strong vertical rally (the pole) from late February to March. Since then, the stock has been consolidating sideways in a tight range for about 8 months, creating a classic flag formation. Now, price has just broken out above the flag resistance, suggesting the start of a new bullish leg. This move is backed by increasing momentum, and the long consolidation prior adds strength to the breakout signal. Candlestick Behavior: The recent candles show strong upward push with sharp momentum, confirming that buyers are now active after a long range. There’s no sign of supply or resistance in the breakout zone yet. Volume View: Volume has also picked up slightly on the breakout day, which supports the bullish breakout from the flag. Sustained volume above average would further validate the move. 2. Crucial Support and Resistance Levels Support Zones: 675–680: Immediate breakout zone; now acting as short-term support. 640: Mid-flag support level from previous range. 600–610: Base of the flag and major support zone. Resistance Zones: No major resistance ahead, as the stock is trading at fresh highs. 800+: Can be considered as an eventual measured move target based on flagpole height. 3. Strategic Trade Scenarios 🔸 Primary Setup – Breakout Continuation With the price clearly breaking above 675, the Pole & Flag breakout is active. As long as price stays above 675, the setup remains valid. Next leg could push toward 800+ in the coming weeks if momentum sustains. 🔹 Alternate Setup – Retest & Hold Scenario If price pulls back slightly toward 675–680 and holds firmly, it may offer a healthy retest before continuing higher. A fall below 640 would weaken the breakout and suggest false strength. At the moment, the stock is breaking out from a long pause, and the pattern is favoring bulls after a clean 9-month consolidation.
Price Action
- ■Price action is structurally positive.
- ■Forming higher highs and higher lows.
Volume Profile
- ■Volume is supportive of the price action.
- ■Wait for volume expansion on breakout.
Key Levels
No zones specified
No zones specified
Invalidation Scenario
A weekly close below the support level invalidates this structure.
CREATIVE GRAPHICS LTD
bearish fnoDouble Bottom Breakout
Daily Chart
Thesis & Analysis
No detailed thesis provided for this setup.
Price Action
- ■Price action is structurally positive.
- ■Forming higher highs and higher lows.
Volume Profile
- ■Volume is supportive of the price action.
- ■Wait for volume expansion on breakout.
Key Levels
No zones specified
No zones specified
Invalidation Scenario
A weekly close below the support level invalidates this structure.
CREATIVE GRAPHICS LTD
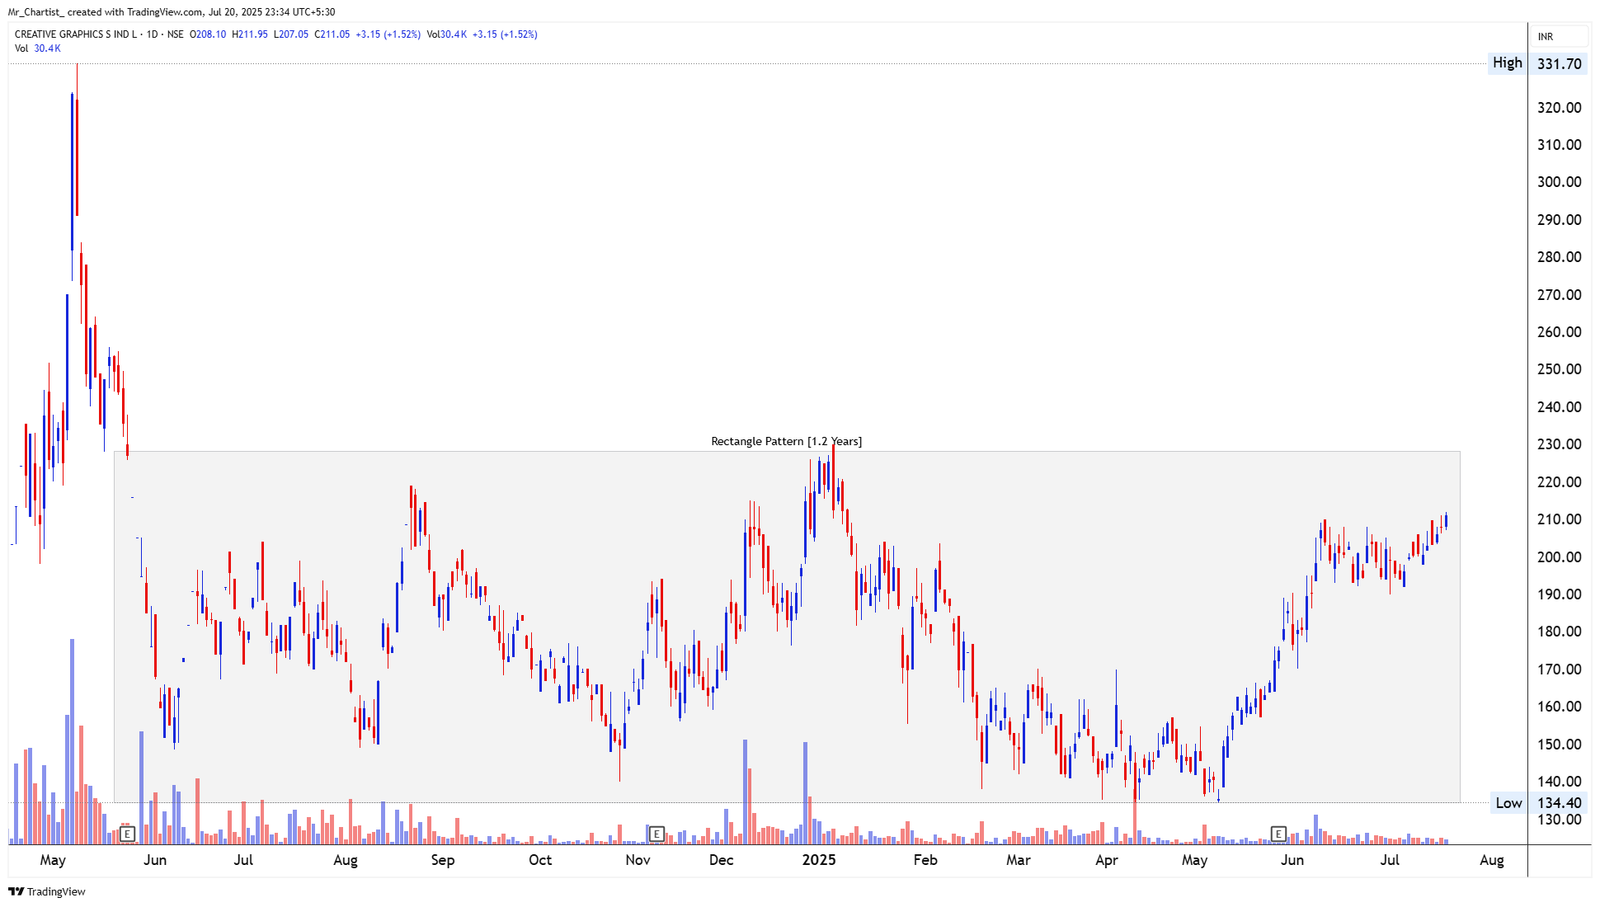
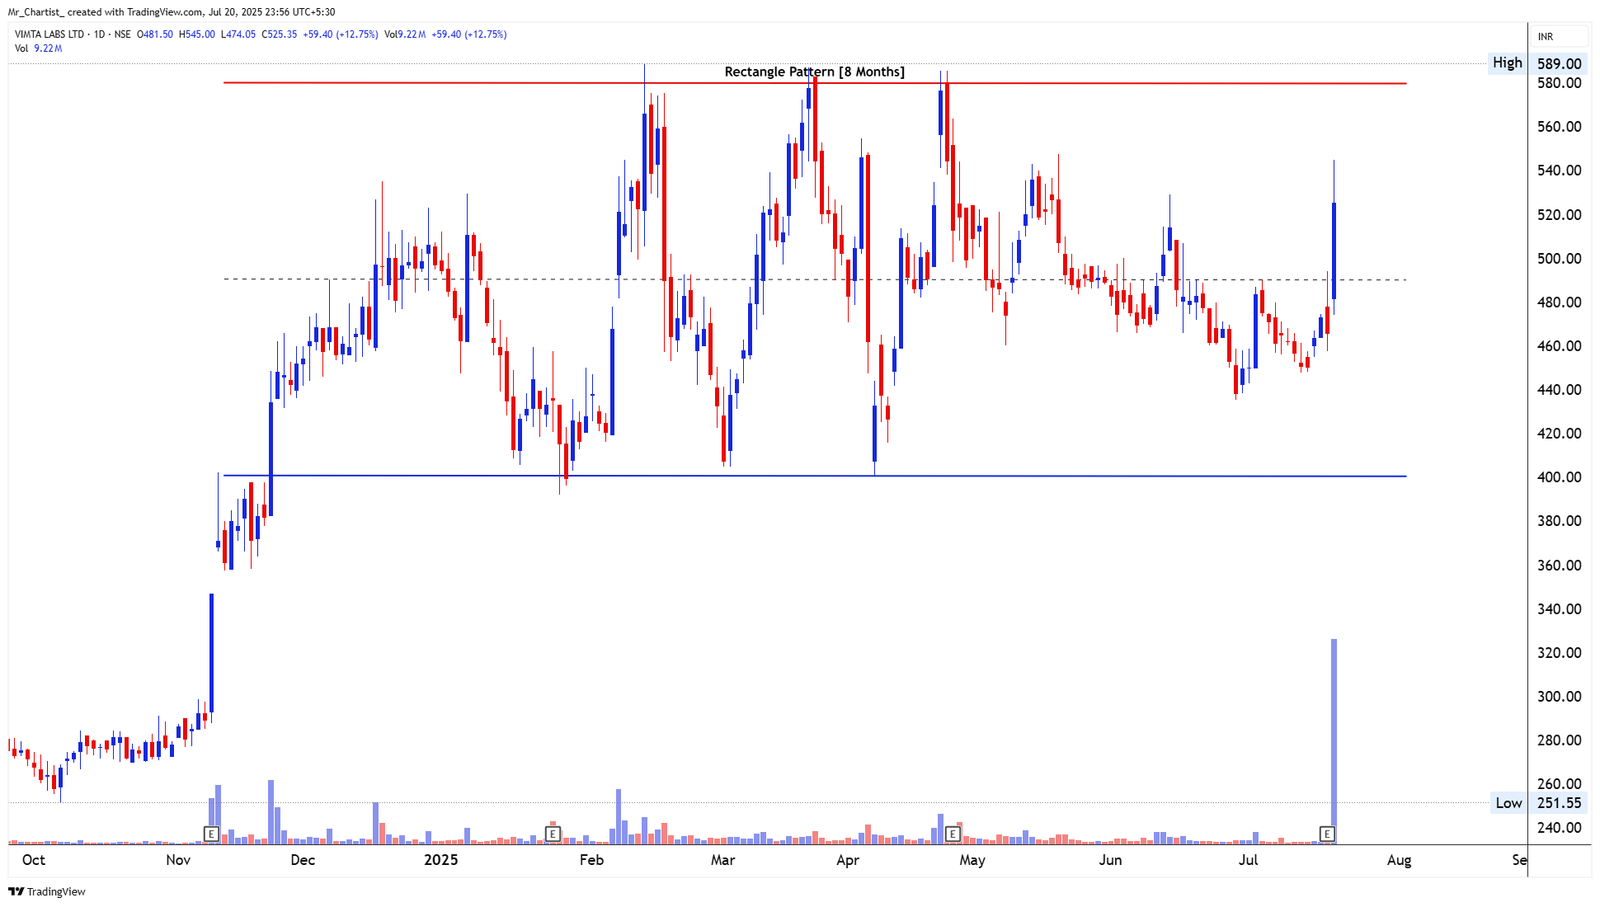
bearish fnoRectangle Pattern
1.2 Years (Weekly-to-Daily Chart – Long-Term Base Formation)
Thesis & Analysis
Creative Graphics has been moving inside a large rectangle range for over a year, with price oscillating between the lower support zone near ₹135 and upper resistance near ₹230. After multiple failed attempts and long sideways price action, the stock is now approaching the upper boundary once again. The recent rally from ₹135 to above ₹210 has come with a clean, trending structure, and price is now within striking distance of a potential breakout. This type of long- range consolidation often leads to powerful moves when resolved. Candlestick Behavior: Recent candles show strong trend and healthy body formations, with no major selling at highs yet. Price action is firm and following through after each small consolidation. Volume View: Volume is gradually increasing with the upmove—an early sign that accumulation is active and market participants are positioning for a possible breakout. 2. Crucial Support and Resistance Levels Resistance Zones: ₹225–₹230: Rectangle top; the most important resistance to clear. ₹255–₹270: Next possible move if breakout confirms. ₹300+: Open zone above the rectangle; historical swing point. Support Zones: ₹190–₹195: Short-term support from recent consolidation zone. ₹165: Previous breakout level from June rally. ₹134–₹140: Long-term range bottom; pattern invalidation level. 3. Strategic Trade Scenarios 🔸 Primary Setup – Breakout in Focus If price breaks and closes above ₹230, the 1.2-year rectangle will be resolved on the upside. This could unlock potential toward ₹255–₹270 in the near term, with even higher levels possible later. 🔹 Alternate Setup – Pullback Before Breakout If price faces minor resistance at ₹225–₹230, it may retest ₹190–₹195 before making another breakout attempt. The structure remains bullish as long as it stays above ₹165. Right now, the stock is near the top of a major base, and a breakout would signal a major shift in trend.
Price Action
- ■Price action is structurally positive.
- ■Forming higher highs and higher lows.
Volume Profile
- ■Volume is supportive of the price action.
- ■Wait for volume expansion on breakout.
Key Levels
No zones specified
No zones specified
Invalidation Scenario
A weekly close below the support level invalidates this structure.
TRANSTEEL SEATING TECH LTD
bearish fnoDouble Bottom Breakout
Daily Chart
Thesis & Analysis
No detailed thesis provided for this setup.
Price Action
- ■Price action is structurally positive.
- ■Forming higher highs and higher lows.
Volume Profile
- ■Volume is supportive of the price action.
- ■Wait for volume expansion on breakout.
Key Levels
No zones specified
No zones specified
Invalidation Scenario
A weekly close below the support level invalidates this structure.
Chart Image Not Extracted
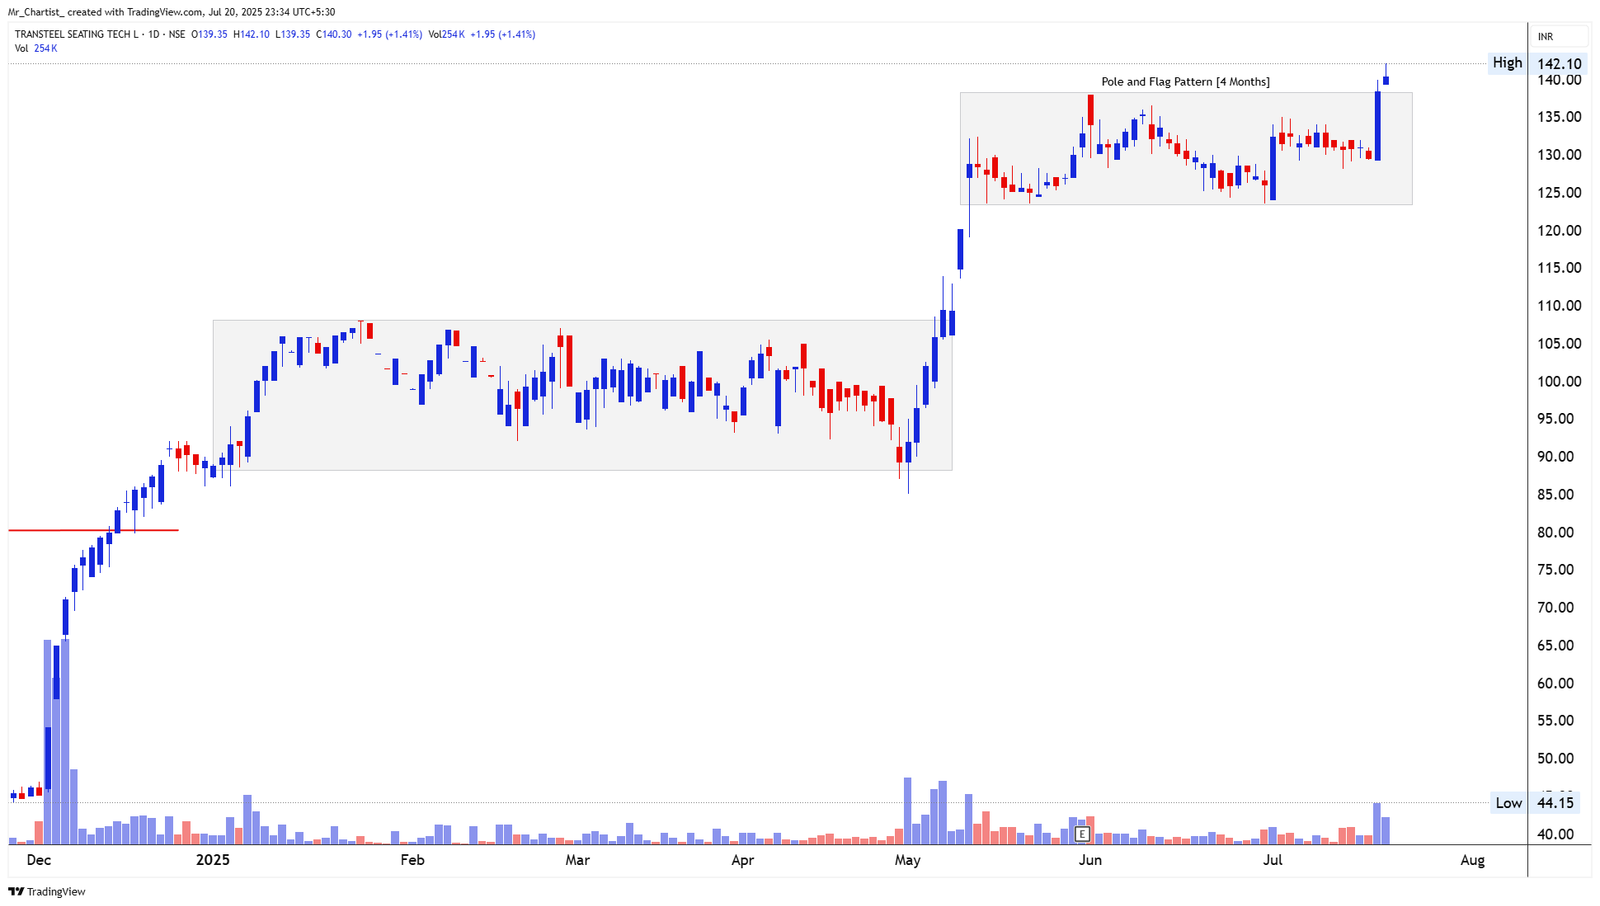
TRANSTEEL SEATING TECH LTD
bearish fnoPole and Flag
4 Months (Daily Chart – Continuation Setup)
Thesis & Analysis
Transteel has formed a clean Pole and Flag pattern, with a sharp vertical move in May (the pole), followed by a tight sideways range over the last 3–4 months. This consolidation has now been broken on the upside with a strong candle and rising volume—signaling the start of a fresh breakout leg. The pattern is well-formed and shows a classic bullish continuation setup, especially with the fresh breakout happening right at the upper end of the flag. Candlestick Behavior: Today’s candle is a strong bullish breakout bar, closing above all recent highs and confirming that buyers have taken control after a long pause. Volume View: Volume surged during the breakout, which adds confirmation and strength to the breakout from the flag zone. This volume behavior fits perfectly with a textbook breakout. 2. Crucial Support and Resistance Levels Support Zones: ₹132–₹134: Immediate breakout zone; now expected to act as short-term support. ₹122: Mid-flag range base. ₹110: Structural support below the flag. Resistance Zones: ₹150: Near-term psychological resistance. ₹165–₹175: Potential pattern-based target zone. ₹200: Round number target if momentum continues strongly. 3. Strategic Trade Scenarios 🔸 Primary Setup – Breakout Continuation Active As long as price holds above ₹132, the flag breakout remains valid. The stock may head toward ₹150, followed by ₹165+ based on the pattern projection. 🔹 Alternate Setup – Retest Possibility If price dips back toward ₹132–₹134, it could act as a healthy retest zone before another leg higher. Only a breakdown below ₹122 would weaken this structure. The breakout looks strong and supported by volume, suggesting buyers are in control after months of consolidation.
Price Action
- ■Price action is structurally positive.
- ■Forming higher highs and higher lows.
Volume Profile
- ■Volume is supportive of the price action.
- ■Wait for volume expansion on breakout.
Key Levels
No zones specified
No zones specified
Invalidation Scenario
A weekly close below the support level invalidates this structure.
ASHAPURA MINECHEM LTD
bearish fnoDouble Bottom Breakout
Daily Chart
Thesis & Analysis
No detailed thesis provided for this setup.
Price Action
- ■Price action is structurally positive.
- ■Forming higher highs and higher lows.
Volume Profile
- ■Volume is supportive of the price action.
- ■Wait for volume expansion on breakout.
Key Levels
No zones specified
No zones specified
Invalidation Scenario
A weekly close below the support level invalidates this structure.
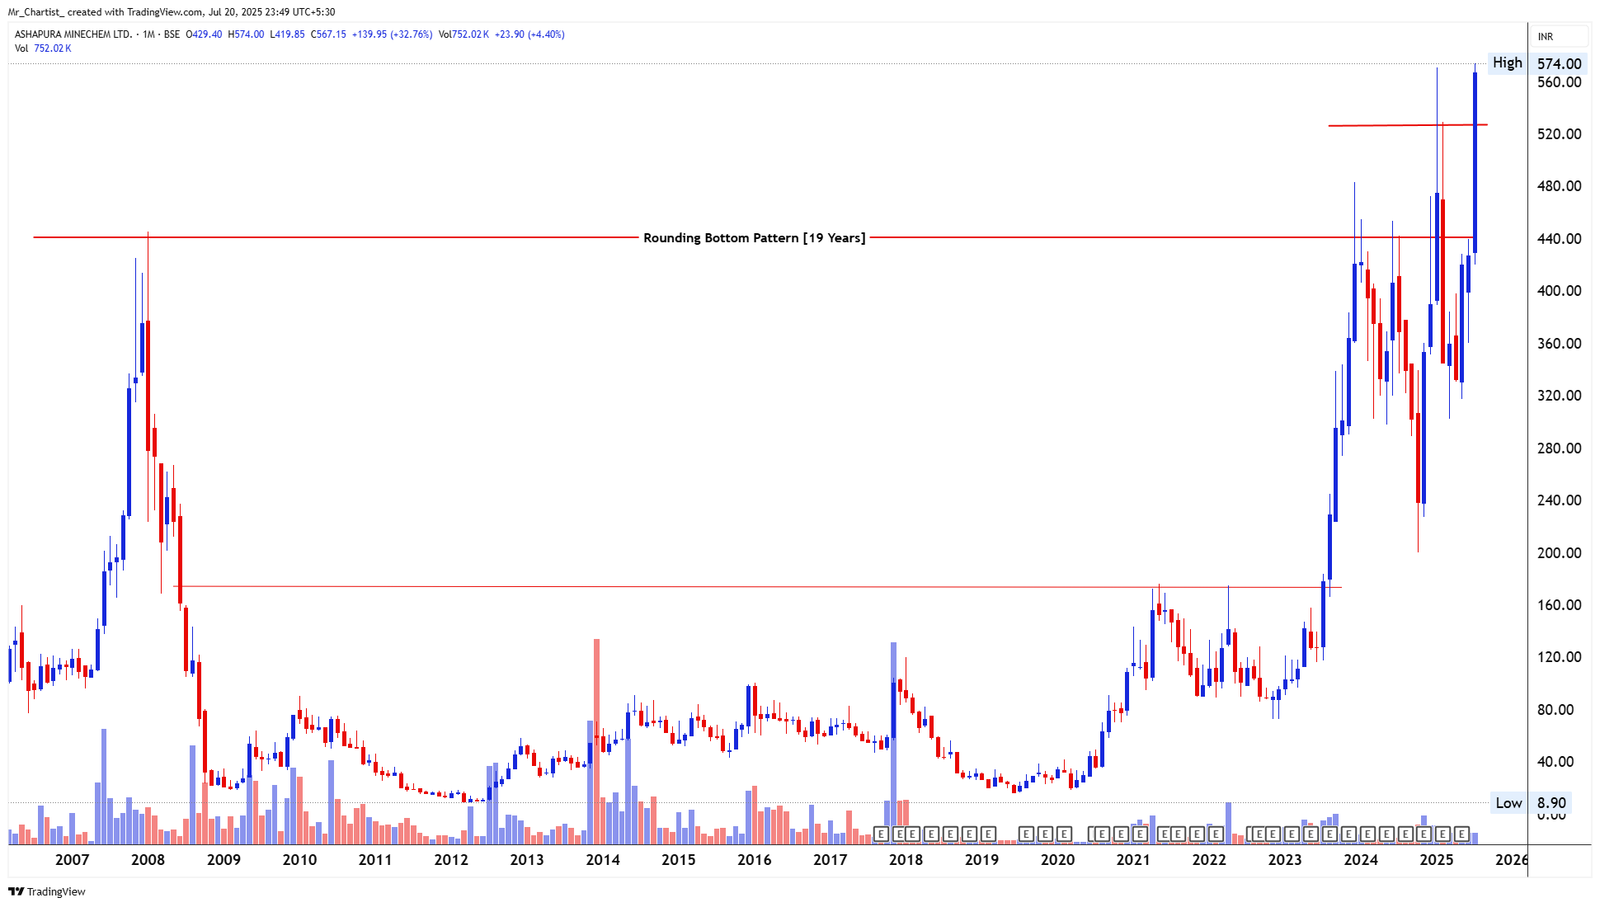
ASHAPURA MINECHEM LTD
bearish fnoRounding Bottom
19 Years (Monthly Chart – Super Long-Term Base Breakout)
Thesis & Analysis
Ashapura Minechem has completed a massive 19-year rounding bottom, making this one of the most structurally significant long-term reversals on the charts. The base began post- 2007 peak and saw a prolonged sideways/downward drift that gradually curved into a rounding base over two decades. After years of base-building, the stock decisively broke above the multi-year neckline resistance, confirming the breakout. The sharp vertical move in recent months suggests post-breakout momentum is now in play, with clear structural follow-through. Candlestick Behavior: The latest monthly bar is a large bullish engulfing candle, extending significantly above the neckline zone. It closes at the high, suggesting strong institutional participation and conviction. Volume View: There’s a major spike in monthly volume, which confirms the breakout strength. Prior to the breakout, volume steadily built up during the base, a textbook precursor to powerful moves. Current breakout volume is highest in years. 2. Crucial Support and Resistance Levels Resistance Zones: ₹575–₹590: Immediate zone around current highs; near-term resistance. ₹700+: Uncharted zone with momentum potential. Support Zones: ₹440: Breakout neckline zone (major long-term support now). ₹360–₹370: Intermediate consolidation zone during breakout journey. ₹240–₹260: Historical horizontal level from 2008–2010 range. The ₹440 zone now becomes critical for structural validation, while upside zones are wide open given the multi-decade compression. 3. Strategic Trade Scenarios 🔸 Primary Setup – Multi-Decade Breakout Continuation If price sustains above ₹575 with continued volume support, the multi-decade rounding bottom target opens up toward ₹700+ over the long term. The breakout is confirmed; now the structure looks ready for measured expansion. 🔹 Alternate Setup – Pullback Retest Post Breakout If price sees profit booking, a pullback toward ₹440–₹460 zone would serve as a healthy retest. As long as it holds above this region, the rounding bottom structure remains firmly intact. Ashapura has just activated a rare 19-year structural breakout, with implications for a long- term trend continuation.
Price Action
- ■Price action is structurally positive.
- ■Forming higher highs and higher lows.
Volume Profile
- ■Volume is supportive of the price action.
- ■Wait for volume expansion on breakout.
Key Levels
No zones specified
No zones specified
Invalidation Scenario
A weekly close below the support level invalidates this structure.
BANDHAN BANK LTD
bearish fnoDouble Bottom Breakout
Daily Chart
Thesis & Analysis
No detailed thesis provided for this setup.
Price Action
- ■Price action is structurally positive.
- ■Forming higher highs and higher lows.
Volume Profile
- ■Volume is supportive of the price action.
- ■Wait for volume expansion on breakout.
Key Levels
No zones specified
No zones specified
Invalidation Scenario
A weekly close below the support level invalidates this structure.
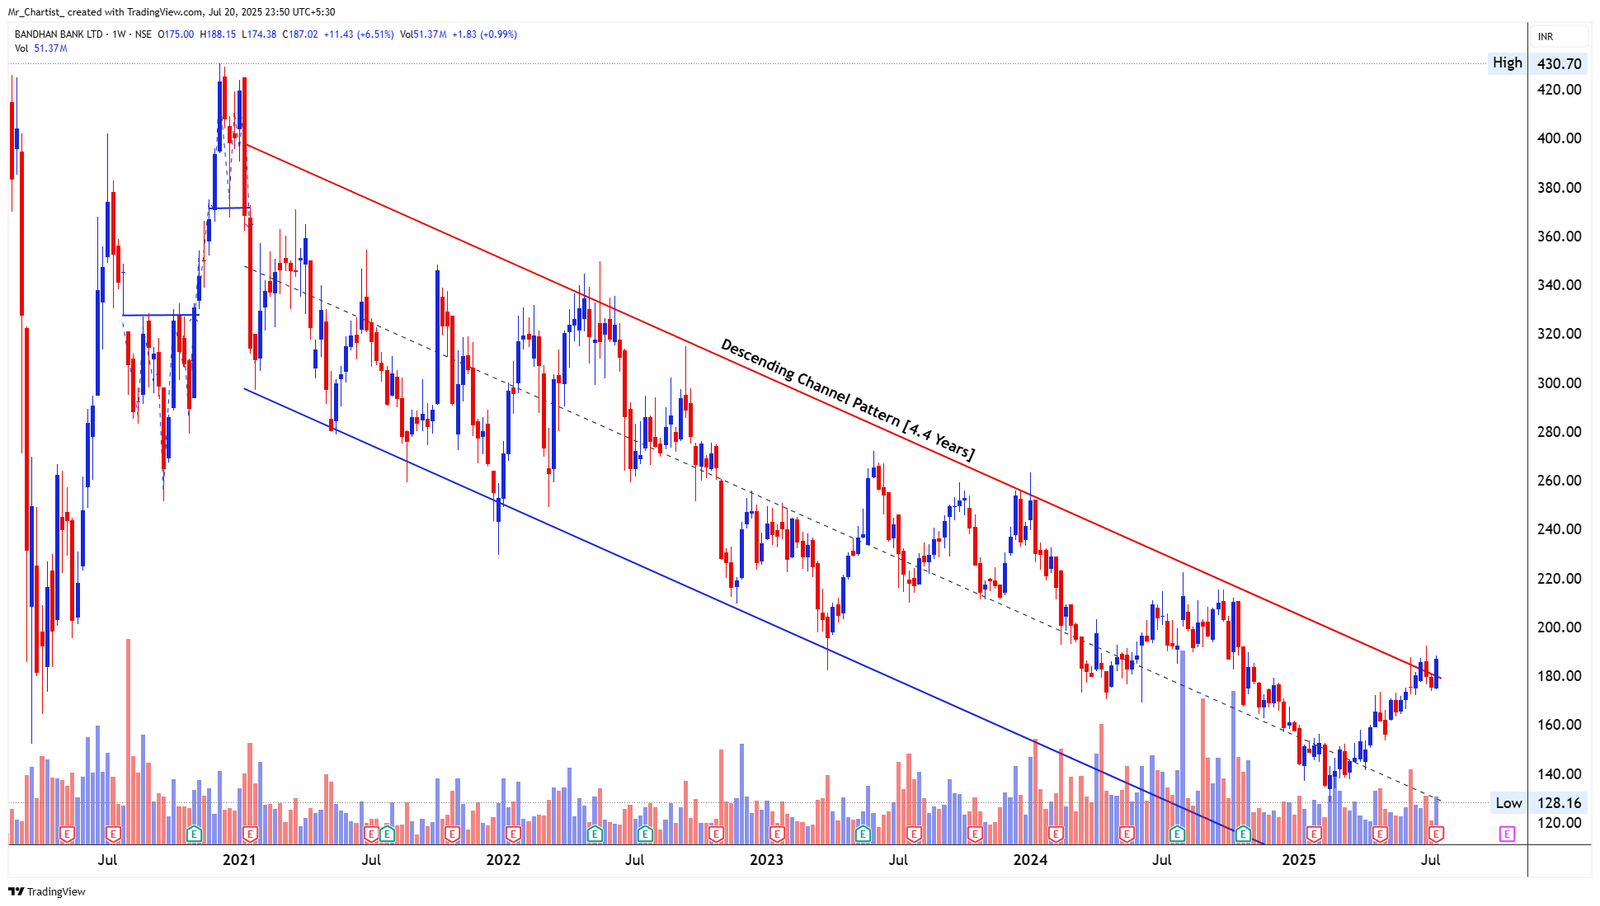
BANDHAN BANK LTD
bearish fnoDescending Channel
4.4 Years (Weekly Chart – Medium-Term Trend Reversal Watch)
Thesis & Analysis
Bandhan Bank has been in a persistent downtrend, contained within a well-defined descending channel for over 4 years. The price has consistently respected both the upper and lower trendlines, confirming the pattern’s reliability. Recently, the stock has moved from the lower boundary of the channel and is now testing the upper resistance line, indicating a potential channel breakout attempt in progress. Candlestick Behavior: The recent weekly candles are bullish with consecutive higher closes. The latest candle is a strong-bodied bar, testing the upper channel boundary—a crucial inflection point for the stock. Prior candles showed consistent demand absorption around ₹130. Volume View: Volumes have notably expanded over the last few weeks, especially on bullish candles. This rise in participation suggests accumulation and growing bullish interest as the stock approaches the trendline resistance. 2. Crucial Support and Resistance Levels Resistance Zones: ₹190–₹195: Channel resistance zone (critical breakout level). ₹220–₹225: Previous swing high (Feb 2024) and potential post-breakout hurdle. ₹260–₹280: Long-term resistance zone; former breakdown levels. Support Zones: ₹168–₹170: Minor support from last week's low. ₹150–₹155: Mid-channel congestion zone. ₹128–₹130: Multi-year channel bottom and recent swing low (strong base). Sustaining above ₹190 will mark a structural shift, breaking the multi-year bearish channel. 3. Strategic Trade Scenarios 🔸 Primary Setup – Channel Breakout Watch A breakout above ₹195 with strong volume will signal a clean exit from the descending channel. Sustained momentum could lead to follow-through targets of ₹220, followed by ₹260+ over the medium term. 🔹 Alternate Setup – Rejection at Resistance If price faces rejection and slips below ₹168, a retest toward ₹150 or even the channel base at ₹130 is possible. However, the pattern remains valid unless the lower trendline is decisively breached. Bandhan Bank is approaching a make-or-break technical juncture after years of compression within a falling structure—monitor for a high-probability breakout or sharp reversal from current levels.
Price Action
- ■Price action is structurally positive.
- ■Forming higher highs and higher lows.
Volume Profile
- ■Volume is supportive of the price action.
- ■Wait for volume expansion on breakout.
Key Levels
No zones specified
No zones specified
Invalidation Scenario
A weekly close below the support level invalidates this structure.
CHENNAI PETROLEUM CORP LTD
bearish fnoDouble Bottom Breakout
Daily Chart
Thesis & Analysis
No detailed thesis provided for this setup.
Price Action
- ■Price action is structurally positive.
- ■Forming higher highs and higher lows.
Volume Profile
- ■Volume is supportive of the price action.
- ■Wait for volume expansion on breakout.
Key Levels
No zones specified
No zones specified
Invalidation Scenario
A weekly close below the support level invalidates this structure.
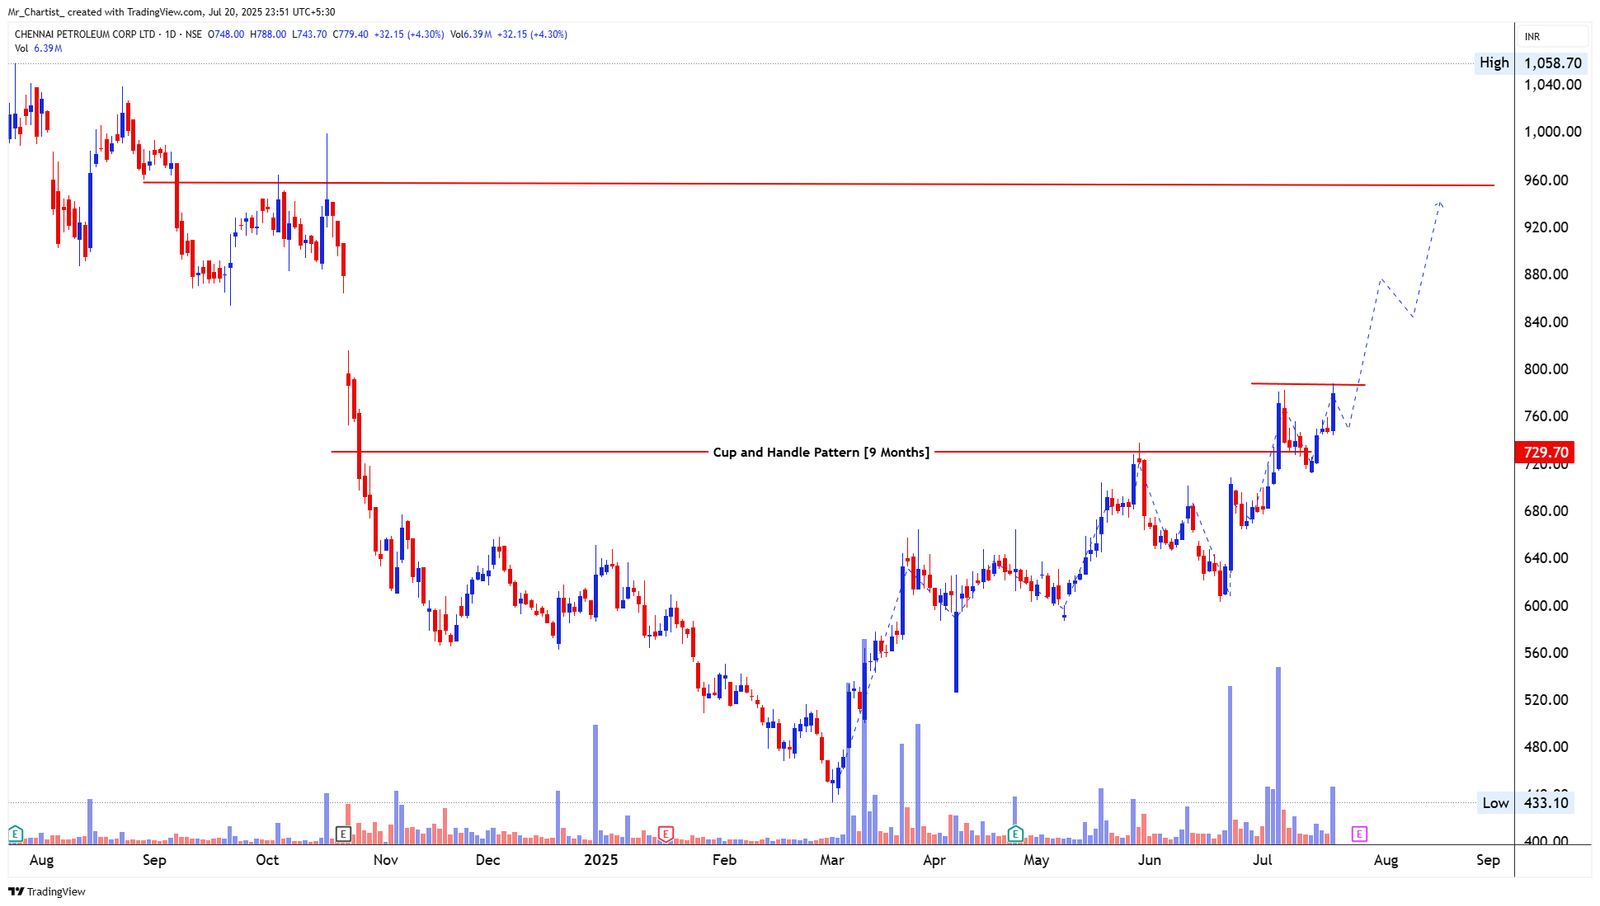
CHENNAI PETROLEUM CORP LTD
bearish fnoCup and Handle
9 Months (Daily Chart – Bullish Continuation Setup)
Thesis & Analysis
Chennai Petro has developed a classic cup and handle formation over the past 9 months. The left side of the cup formed between Oct 2024 and Feb 2025, followed by a smooth base, and now a handle structure is visible in the last several weeks. The stock has attempted to break out above the handle’s resistance but is currently facing minor pullback. This corrective dip could form the final leg of the handle before a clean breakout unfolds. Candlestick Behavior: The recent candles show healthy demand absorption despite the broader market weakness. The pullback is controlled, with short-bodied candles indicating consolidation rather than panic selling. Volume View: There has been strong volume buildup during the recent rally, especially during the mid-June to early July leg. Though today’s candle is red, volume remains moderate, suggesting a pause rather than reversal. 2. Crucial Support and Resistance Levels Resistance Zones: ₹760–₹770: Handle resistance zone and breakout confirmation level. ₹840–₹860: Interim supply zone and prior reaction high. ₹960–₹980: Long-term supply zone; historical breakdown point (Aug 2024). Support Zones: ₹700–₹710: Handle base and recent breakout retest zone. ₹660: Rising support zone from the March 2025 base. ₹600: Structural bottom of the cup. A decisive breakout above ₹770 will open upside potential toward ₹840+ in the short term. 3. Strategic Trade Scenarios 🔸 Primary Setup – Cup and Handle Breakout Watch If price clears and closes above ₹770 with rising volume, it would confirm the pattern breakout. This can trigger an advance toward ₹840, followed by ₹960 in subsequent legs. 🔹 Alternate Setup – Handle Retest Dip If the breakout attempt fails and price dips below ₹700, the stock may revisit the ₹660 zone. A breakdown below ₹600 would negate the pattern and imply deeper correction. This pattern is maturing and the handle is nearly complete, setting up a high-probability breakout opportunity with defined structure.
Price Action
- ■Price action is structurally positive.
- ■Forming higher highs and higher lows.
Volume Profile
- ■Volume is supportive of the price action.
- ■Wait for volume expansion on breakout.
Key Levels
No zones specified
No zones specified
Invalidation Scenario
A weekly close below the support level invalidates this structure.
DATAMATICS GLOBAL SERVICES LTD
bearish fnoDouble Bottom Breakout
Daily Chart
Thesis & Analysis
No detailed thesis provided for this setup.
Price Action
- ■Price action is structurally positive.
- ■Forming higher highs and higher lows.
Volume Profile
- ■Volume is supportive of the price action.
- ■Wait for volume expansion on breakout.
Key Levels
No zones specified
No zones specified
Invalidation Scenario
A weekly close below the support level invalidates this structure.
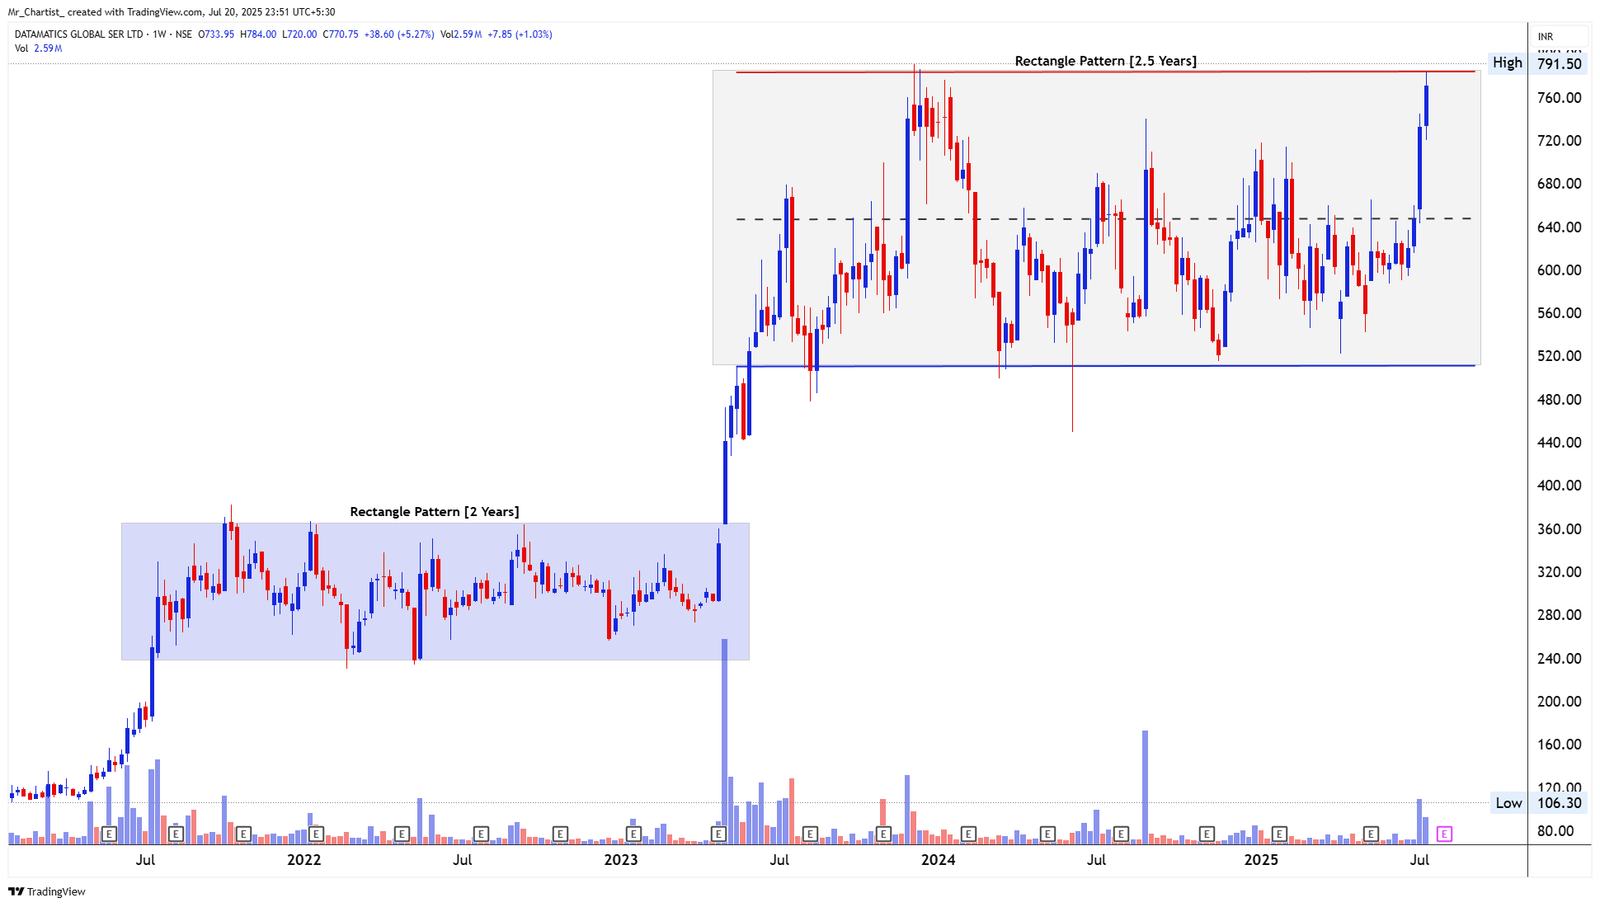
DATAMATICS GLOBAL SERVICES LTD
bearish fnoRectangle Pattern
2.5 Years (Weekly Chart – Consolidation Breakout Attempt)
Thesis & Analysis
Datamatics has spent the last 2.5 years inside a broad rectangle consolidation range, oscillating between the ₹520–₹790 levels. The latest weekly candle marks a significant attempt to close above the upper range for the first time since early 2024. This breakout effort comes after a previous 2-year rectangle (₹180–₹300 zone) breakout in early 2023, which led to a strong vertical rally. The current pattern signals potential continuation of that larger trend if confirmed. Candlestick Behavior: The current weekly candle is large-bodied and bullish, breaching the prior upper band. However, the upper wick reflects some profit-taking at the breakout level, warranting confirmation in upcoming sessions. Volume View: Volume has expanded notably in recent weeks. The surge during this week’s attempted breakout shows rising institutional participation, validating the breakout setup. 2. Crucial Support and Resistance Levels Resistance Zones: ₹790–₹800: Rectangle breakout zone; needs strong weekly close above. ₹850–₹880: Measured move resistance (post-breakout target projection). ₹980–₹1,000: Psychological and Fibonacci extension zone. Support Zones: ₹700–₹720: Mid-range pivot; short-term buyer base. ₹640: Breakdown cushion and key demand zone. ₹520: Rectangle base and major long-term support. The setup suggests major trend resumption if price sustains above ₹790. 3. Strategic Trade Scenarios 🔸 Primary Setup – Rectangle Breakout Continuation If price sustains above ₹790 with follow-through volume and strong close, the breakout from this 2.5-year structure could project upside toward ₹880 initially and possibly ₹1,000 in the medium term. 🔹 Alternate Setup – False Breakout Risk If price slips back below ₹720 and closes under ₹700, it would indicate a failed breakout. In this case, price may re-enter the rectangle, and a retest of ₹640 or even ₹520 cannot be ruled out. This is a textbook consolidation structure nearing resolution, and the coming weeks are crucial for confirmation of directional intent.
Price Action
- ■Price action is structurally positive.
- ■Forming higher highs and higher lows.
Volume Profile
- ■Volume is supportive of the price action.
- ■Wait for volume expansion on breakout.
Key Levels
No zones specified
No zones specified
Invalidation Scenario
A weekly close below the support level invalidates this structure.
HEG LTD
bearish fnoDouble Bottom Breakout
Daily Chart
Thesis & Analysis
No detailed thesis provided for this setup.
Price Action
- ■Price action is structurally positive.
- ■Forming higher highs and higher lows.
Volume Profile
- ■Volume is supportive of the price action.
- ■Wait for volume expansion on breakout.
Key Levels
No zones specified
No zones specified
Invalidation Scenario
A weekly close below the support level invalidates this structure.
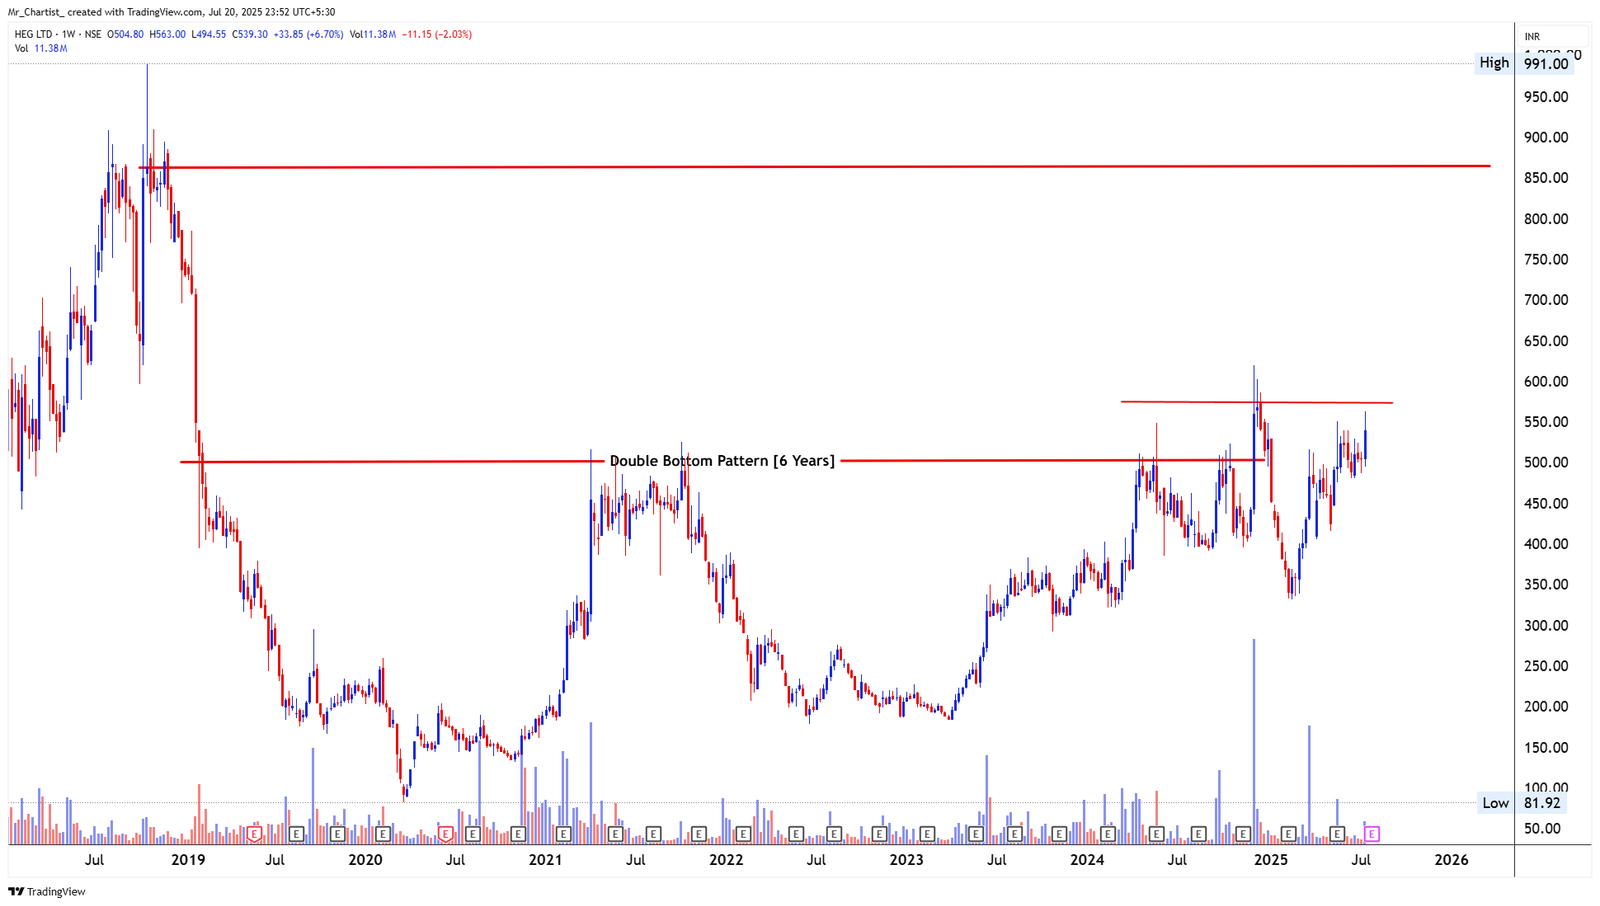
HEG LTD
bearish fnoDouble Bottom Pattern
6 Years (Weekly Chart – Long-Term Base Reversal Attempt)
Thesis & Analysis
HEG has formed a classic long-term double bottom over a 6-year period, with significant lows in 2019 and 2022. The pattern neckline lies in the ₹585–₹600 zone, which the stock is currently approaching after a multi-month upward structure from the ₹400 base. The setup reflects a broader reversal structure after extended underperformance. Current price action is consolidating just below the neckline—signaling a potential breakout inflection point. Candlestick Behavior: This week’s candle shows upper wick rejection near ₹560, indicating resistance pressure. Despite that, higher lows continue to build, keeping upward momentum intact. Volume View: Volume has remained elevated in recent weeks, reflecting steady accumulation. A breakout above ₹600 with expanding volume could confirm the pattern’s resolution to the upside. 2. Crucial Support and Resistance Levels Resistance Zones: ₹585–₹600: Double bottom neckline; critical breakout zone. ₹640: Post-breakout validation level and 2022 swing high. ₹850–₹880: Full pattern target aligned with 2018 supply zone. Support Zones: ₹510–₹495: Short-term swing support from recent structure. ₹455: Prior base breakout region; major demand level. ₹400: Double bottom trough and strong structural support. HEG is pressing into a multi-year resistance zone with bullish structural support from below. 3. Strategic Trade Scenarios 🔸 Primary Setup – Double Bottom Breakout Setup If the stock breaks above ₹600 on strong volume and sustains, the long-term base breakout would confirm. This could initiate a measured move toward ₹640 initially, and eventually ₹850+ in the coming months. 🔹 Alternate Setup – Resistance Rejection If price fails to cross ₹600 and drops below ₹495, a corrective pullback to ₹455 may unfold. A fall below ₹400 would invalidate the pattern entirely and shift momentum bearish. HEG is at a decisive inflection zone with a strong long-term base building behind its current move.
Price Action
- ■Price action is structurally positive.
- ■Forming higher highs and higher lows.
Volume Profile
- ■Volume is supportive of the price action.
- ■Wait for volume expansion on breakout.
Key Levels
No zones specified
No zones specified
Invalidation Scenario
A weekly close below the support level invalidates this structure.
KRBL LTD
bearish fnoDouble Bottom Breakout
Daily Chart
Thesis & Analysis
No detailed thesis provided for this setup.
Price Action
- ■Price action is structurally positive.
- ■Forming higher highs and higher lows.
Volume Profile
- ■Volume is supportive of the price action.
- ■Wait for volume expansion on breakout.
Key Levels
No zones specified
No zones specified
Invalidation Scenario
A weekly close below the support level invalidates this structure.
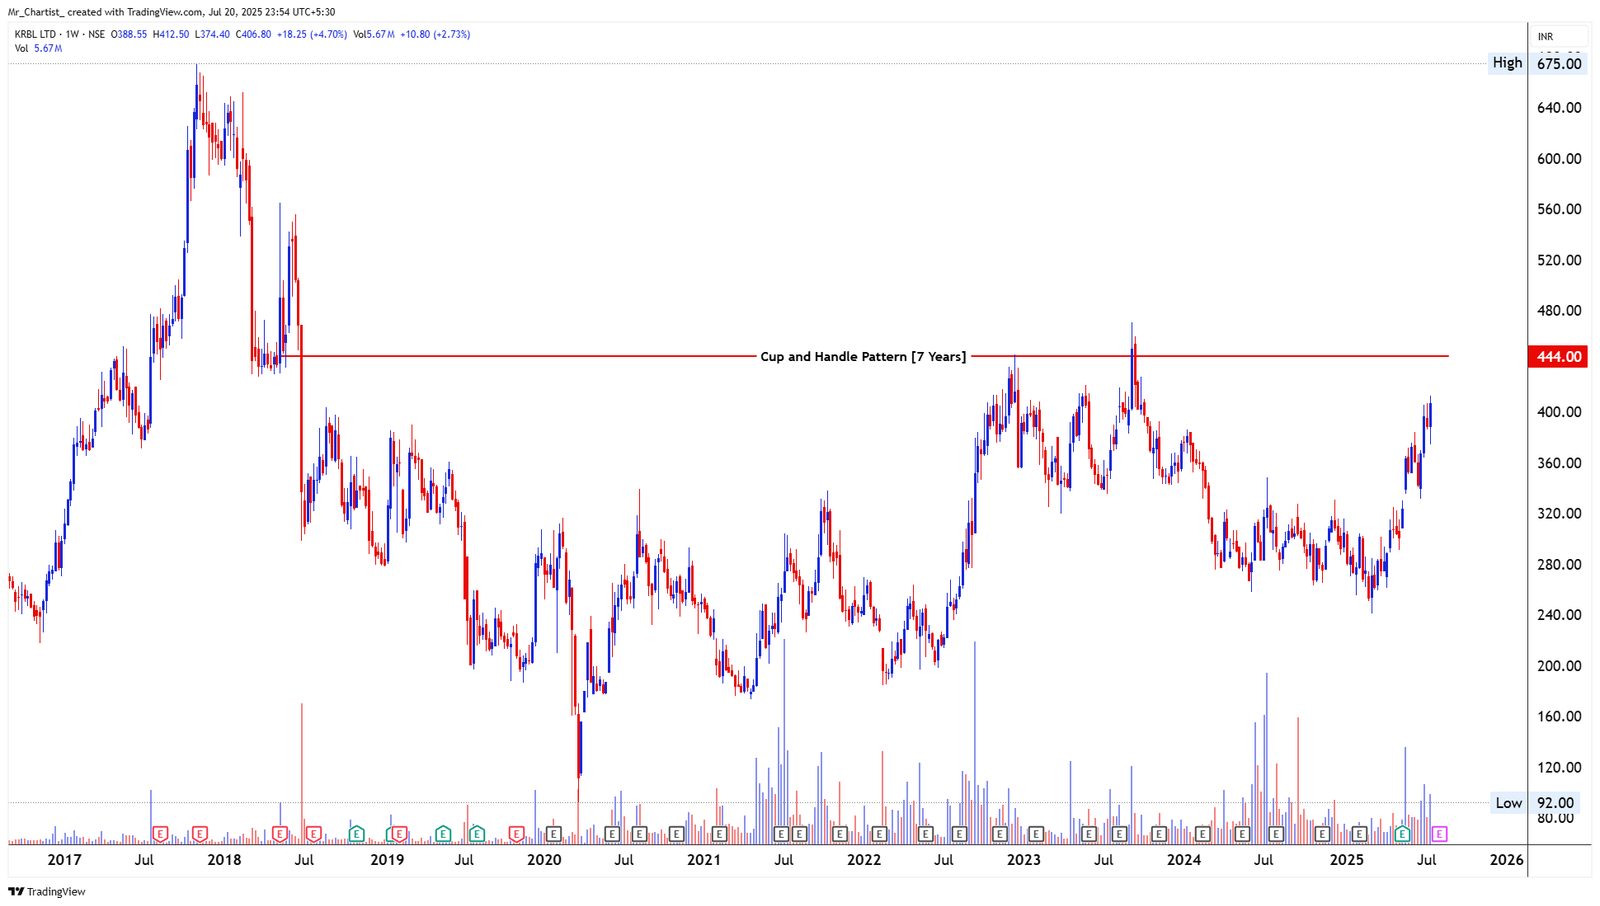
KRBL LTD
bearish fnoCup and Handle Pattern
7 Years (Weekly Chart – Multi-Year Reversal Base)
Thesis & Analysis
KRBL has been forming a 7-year cup and handle pattern, starting from its 2017 peak followed by a prolonged decline, a broad rounding base, and now a developing handle. The pattern has matured with price now rising towards the neckline resistance at ₹444. This setup represents a classic long-term accumulation phase, with higher lows forming since late 2023, indicating growing bullish interest as the handle formation nears completion. Candlestick Behavior: The recent weekly candles are bullish and steadily climbing, showing improving sentiment. However, the latest candle has a modest upper wick, suggesting mild supply absorption near ₹410–₹420. Volume View: Volume has increased gradually during the handle formation. Though not yet explosive, it reflects steady participation. A volume breakout above ₹444 would be a strong confirmation of pattern completion. 2. Crucial Support and Resistance Levels Resistance Zones: ₹444–₹450: Cup and handle neckline; breakout confirmation zone. ₹485–₹500: Minor hurdle post-breakout from historical supply zone. ₹600–₹675: Measured move targets from the pattern projection. Support Zones: ₹385: Near-term handle base; immediate swing support. ₹350: Recent breakout level and pullback cushion. ₹310: Handle low and structural reversal pivot. This 7-year structure is approaching a key decision point with bullish buildup intensifying. 3. Strategic Trade Scenarios 🔸 Primary Setup – Cup and Handle Breakout Watch If price breaks above ₹444 with solid volume and closes higher, the breakout could project a long-term upmove toward ₹500 and potentially ₹675 in extended rally phases. 🔹 Alternate Setup – Resistance Rejection Near Neckline If the price fails to clear ₹444 and dips below ₹385, a pullback to ₹350–₹310 is possible. As long as it holds ₹310, the broader pattern remains valid, with the handle still forming. KRBL is nearing the apex of a long-term bullish structure that could lead to a trend shift upon breakout.
Price Action
- ■Price action is structurally positive.
- ■Forming higher highs and higher lows.
Volume Profile
- ■Volume is supportive of the price action.
- ■Wait for volume expansion on breakout.
Key Levels
No zones specified
No zones specified
Invalidation Scenario
A weekly close below the support level invalidates this structure.
PARAG MILK FOODS LTD
bearish fnoDouble Bottom Breakout
Daily Chart
Thesis & Analysis
No detailed thesis provided for this setup.
Price Action
- ■Price action is structurally positive.
- ■Forming higher highs and higher lows.
Volume Profile
- ■Volume is supportive of the price action.
- ■Wait for volume expansion on breakout.
Key Levels
No zones specified
No zones specified
Invalidation Scenario
A weekly close below the support level invalidates this structure.
Chart Image Not Extracted
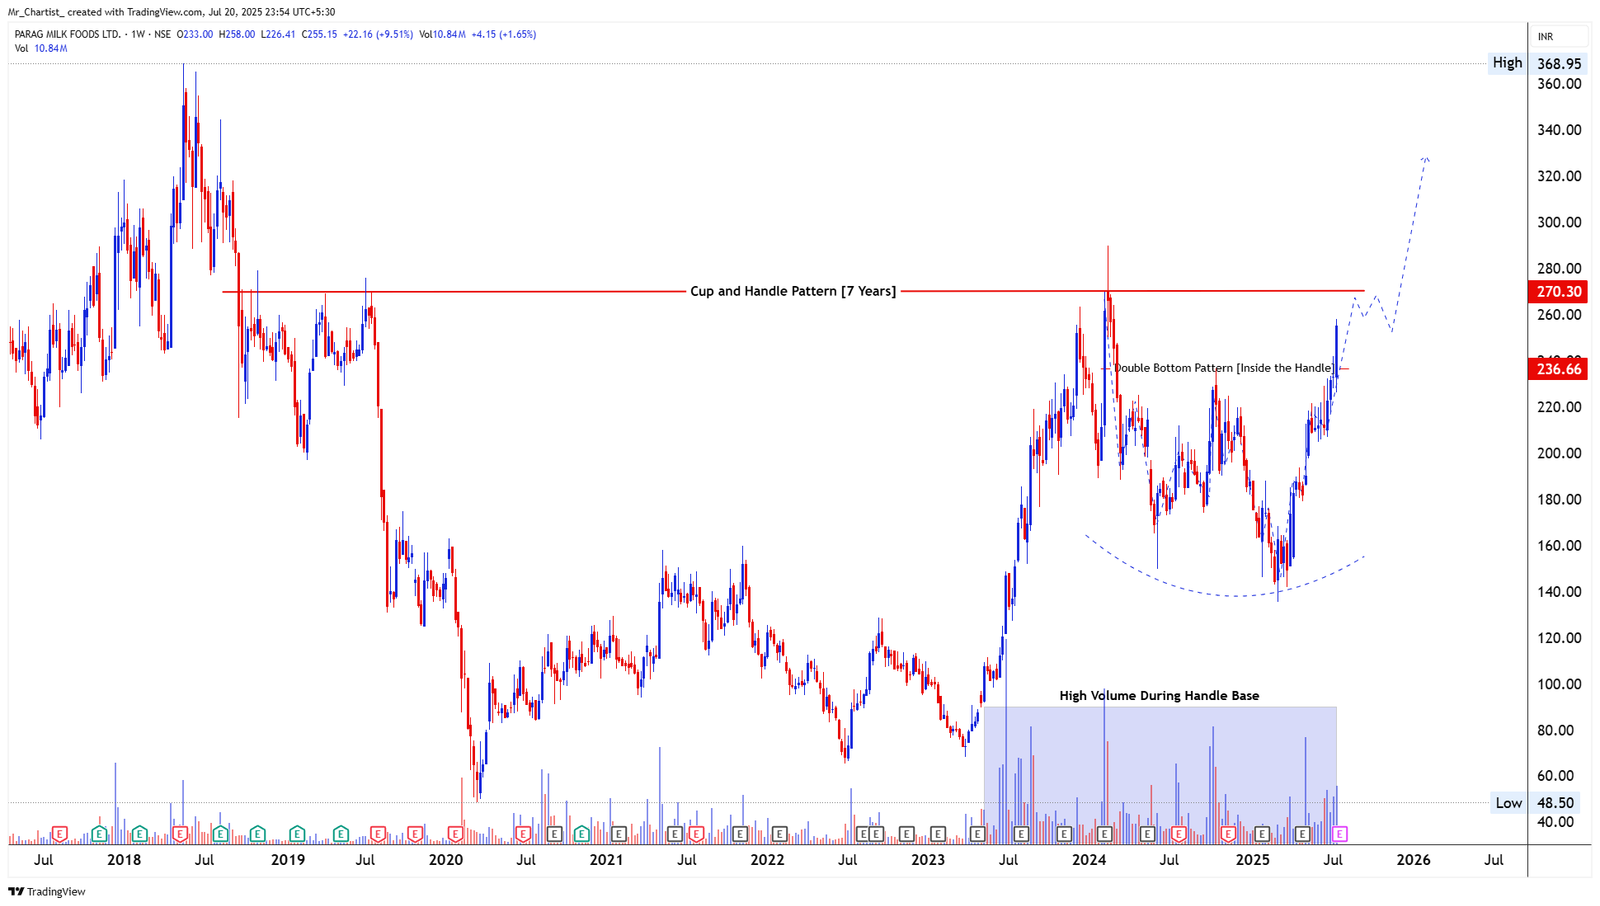
PARAG MILK FOODS LTD
bearish fnoCup and Handle Pattern (with a Double Bottom inside the Handle)
7 Years (Weekly Chart – Long-Term Base Breakout Watch)
Thesis & Analysis
Parag Milk is nearing the final phase of a 7-year cup and handle formation. After a deep decline from its 2018 highs, the stock carved out a wide rounding base. More recently, a double bottom within the handle structure has provided additional confirmation of accumulation. The handle formation has been accompanied by high volume around the base of the handle —a bullish accumulation signal pointing toward institutional interest prior to a breakout. Candlestick Behavior: Recent candles are bullish and consistent, with rising closes and narrowing wicks, indicating follow-through buying pressure. The current price action is pressing against the ₹270 neckline. Volume View: Volume has been well above average through the handle phase, particularly during the bottoming structure. This points to smart money entry and lends weight to the breakout thesis if price confirms above resistance. 2. Crucial Support and Resistance Levels Resistance Zones: ₹270–₹275: Handle neckline and long-term horizontal resistance. ₹305–₹320: Measured move from the double bottom breakout. ₹360–₹368: All-time high zone from early 2018. Support Zones: ₹220–₹230: Handle midpoint and recent breakout retest area. ₹190: Double bottom support base. ₹160: Lower boundary of the long handle range. This confluence of patterns with supportive volume suggests a structural breakout may be forming. 3. Strategic Trade Scenarios 🔸 Primary Setup – Cup and Handle Breakout Confirmation If price closes strongly above ₹270 with volume expansion, it would confirm the breakout from the 7-year base. The breakout could potentially project moves toward ₹320 and higher toward ₹360 over time. 🔹 Alternate Setup – False Breakout or Rejection If price faces supply and closes back below ₹230, a retest of ₹190 is possible. However, as long as the stock stays above ₹160, the handle remains valid structurally. This is a classic long-term breakout structure nearing resolution, reinforced by high-volume accumulation and nested bullish formations.
Price Action
- ■Price action is structurally positive.
- ■Forming higher highs and higher lows.
Volume Profile
- ■Volume is supportive of the price action.
- ■Wait for volume expansion on breakout.
Key Levels
No zones specified
No zones specified
Invalidation Scenario
A weekly close below the support level invalidates this structure.
BALMER LAWRIE INVESTMENTS LTD
bearish fnoDouble Bottom Breakout
Daily Chart
Thesis & Analysis
No detailed thesis provided for this setup.
Price Action
- ■Price action is structurally positive.
- ■Forming higher highs and higher lows.
Volume Profile
- ■Volume is supportive of the price action.
- ■Wait for volume expansion on breakout.
Key Levels
No zones specified
No zones specified
Invalidation Scenario
A weekly close below the support level invalidates this structure.
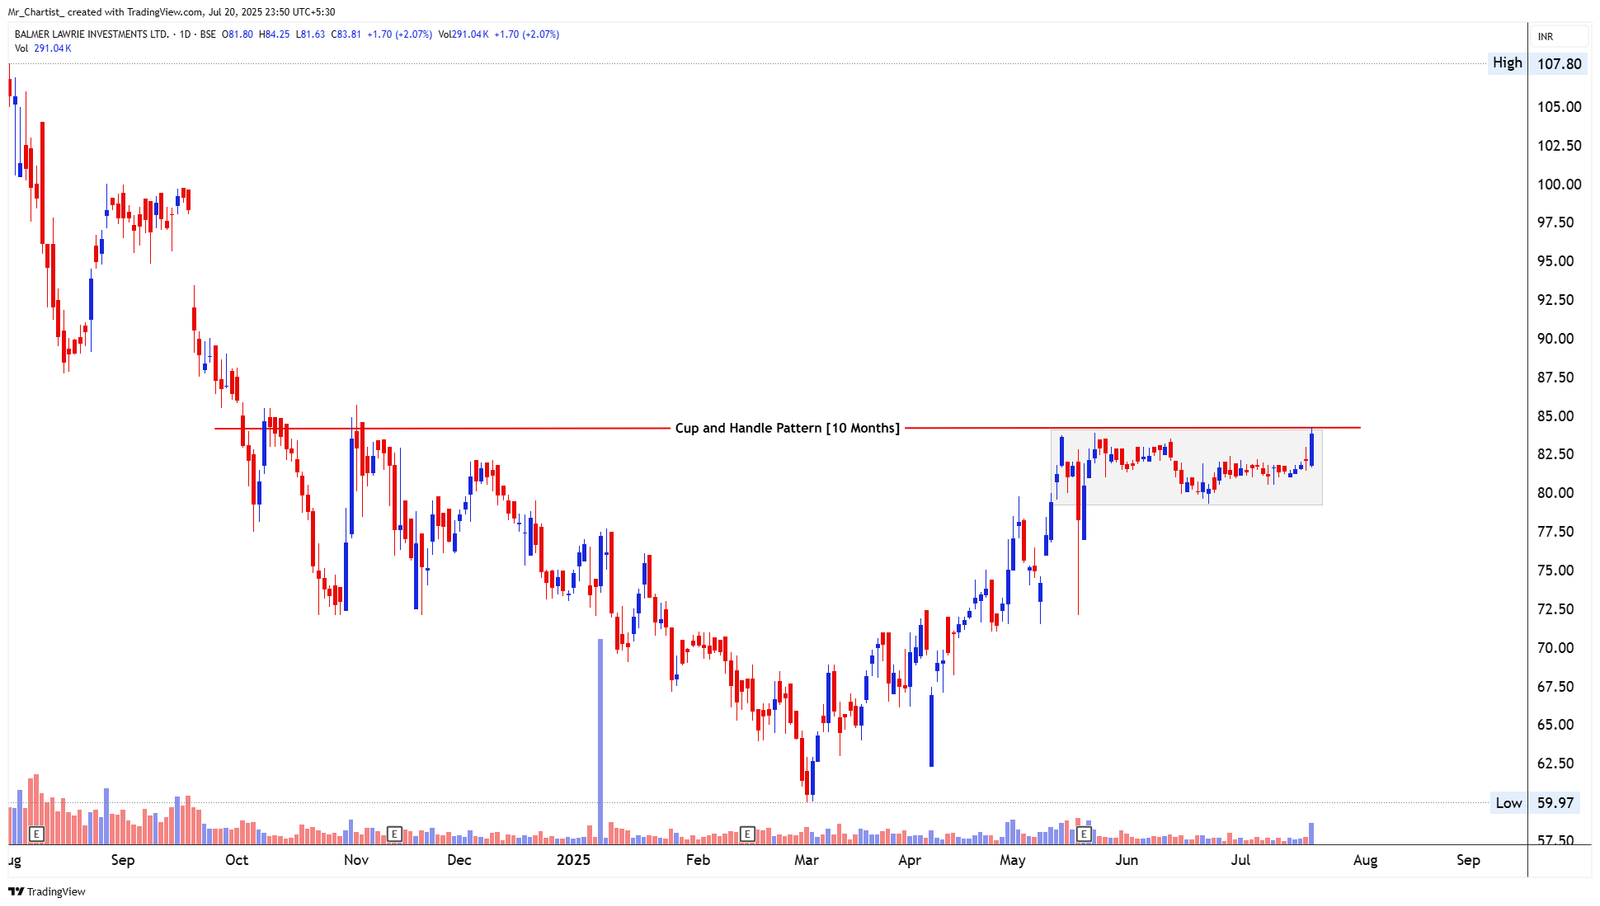
BALMER LAWRIE INVESTMENTS LTD
bearish fnoCup and Handle
10 Months (Daily Chart – Classic Reversal Setup)
Thesis & Analysis
Balmer Lawrie Investments has completed a Cup and Handle pattern, forming over the last 10 months. The rounded cup base developed from Sept 2024 to May 2025, followed by a tight handle range through June and July. The stock has now moved sharply toward the breakout level near ₹84, and today's candle shows a bullish thrust right at the neckline, signaling increased buying strength. Candlestick Behavior: The breakout candle is strong and clean, with price closing near the high of the day— indicating momentum. The handle had no major selling pressure, which keeps the setup healthy. Volume View: Today’s move was backed by strong volume, which adds confirmation to the handle breakout. Previous volume spikes during the base formation show that accumulation has been ongoing. 2. Crucial Support and Resistance Levels Resistance Zones: ₹84–₹85: Neckline zone; breakout level being tested now. ₹95–₹98: Cup height projection zone. ₹107+: 52-week high and extended target if trend strengthens. Support Zones: ₹80: Handle support and immediate demand zone. ₹75: Lower consolidation support inside handle. ₹70: Cup mid-base support and long-term invalidation. 3. Strategic Trade Scenarios 🔸 Primary Setup – Cup and Handle Breakout Trigger A daily close above ₹85 would confirm the Cup and Handle breakout, targeting ₹95– ₹98 in the near term. Sustained move above this could stretch toward ₹105–₹107. 🔹 Alternate Setup – Handle Rejection Risk If the breakout attempt fails and price dips back below ₹80, the move could pause or consolidate again. A fall below ₹75 would weaken the structure but not fully invalidate it unless ₹70 breaks. Currently, the stock is right at the neckline, and momentum looks positive with volume support—making this a high-alert breakout zone.
Price Action
- ■Price action is structurally positive.
- ■Forming higher highs and higher lows.
Volume Profile
- ■Volume is supportive of the price action.
- ■Wait for volume expansion on breakout.
Key Levels
No zones specified
No zones specified
Invalidation Scenario
A weekly close below the support level invalidates this structure.
CHEMCON SPECIALITY CHEMICALS LTD
bearish fnoDouble Bottom Breakout
Daily Chart
Thesis & Analysis
No detailed thesis provided for this setup.
Price Action
- ■Price action is structurally positive.
- ■Forming higher highs and higher lows.
Volume Profile
- ■Volume is supportive of the price action.
- ■Wait for volume expansion on breakout.
Key Levels
No zones specified
No zones specified
Invalidation Scenario
A weekly close below the support level invalidates this structure.
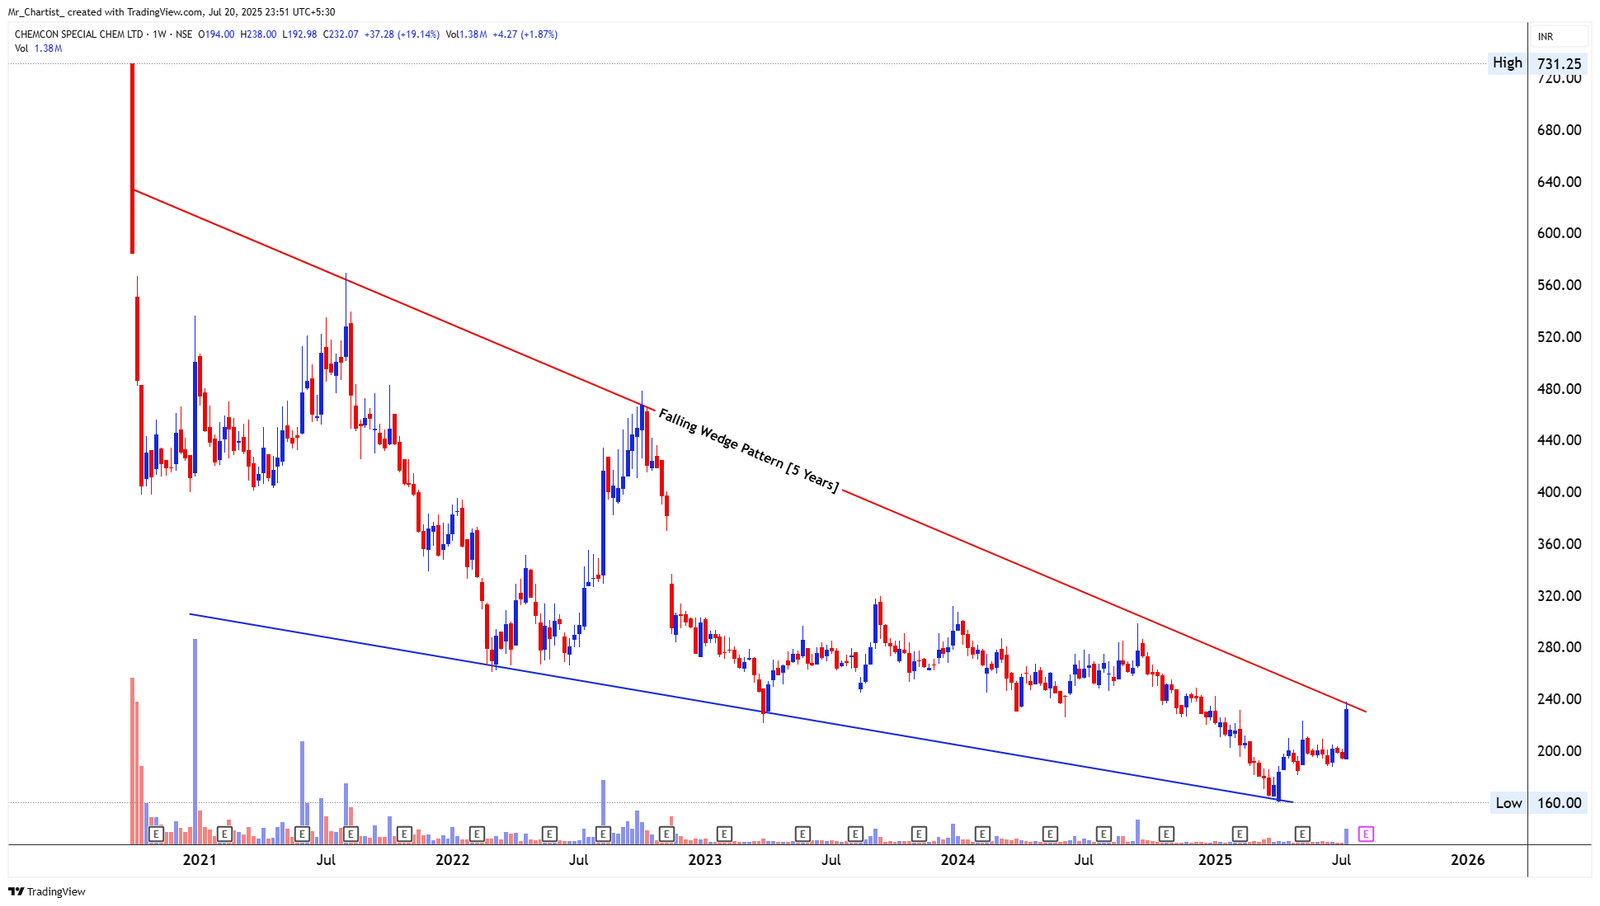
CHEMCON SPECIALITY CHEMICALS LTD
bearish fnoFalling Wedge
5 Years (Weekly Chart – Long-Term Reversal Setup)
Thesis & Analysis
Chemcon has been in a long-term falling wedge pattern for the past 5 years. The stock has been making lower highs and lower lows within this wedge, slowly tightening its range over time. Recently, the price has shown a sharp upward move, pushing right up to the wedge's upper boundary—signaling a possible breakout attempt. This long wedge is a classic bullish reversal structure, especially after prolonged underperformance. The latest weekly candle shows strong momentum and increasing activity. Candlestick Behavior: This week’s candle is a wide-ranged bullish bar, closing near the week’s high, with a clear breakout attempt in sight. Previous candles were stable, indicating a build-up before this move. Volume View: Volume has increased significantly, confirming that buyers have stepped in with conviction. The current volume surge adds strength to the move. 2. Crucial Support and Resistance Levels Resistance Zones: ₹240–₹250: Wedge resistance; needs to break and close above. ₹285–₹300: Mid-2022 swing zone. ₹360–₹400: Major levels if wedge breakout extends. Support Zones: ₹210–₹215: Immediate support from breakout attempt. ₹190: Base of the recent rally. ₹160: Long-term wedge support and structure bottom. 3. Strategic Trade Scenarios 🔸 Primary Setup – Breakout Watch from 5-Year Wedge If price breaks above ₹240 and sustains with volume, the wedge breakout would confirm. This could trigger a multi-leg rally toward ₹285, followed by ₹360+ over the medium term. 🔹 Alternate Setup – Rejection Near Resistance If the price faces resistance and pulls back below ₹210, a retest of ₹190 could occur. As long as it stays above ₹160, the wedge remains valid and the pattern holds. Currently, the stock is at a major technical level after years of compression, and the breakout setup is building strongly.
Price Action
- ■Price action is structurally positive.
- ■Forming higher highs and higher lows.
Volume Profile
- ■Volume is supportive of the price action.
- ■Wait for volume expansion on breakout.
Key Levels
No zones specified
No zones specified
Invalidation Scenario
A weekly close below the support level invalidates this structure.
GUJARAT APOLLO INDUSTRIES LTD
bearish fnoDouble Bottom Breakout
Daily Chart
Thesis & Analysis
No detailed thesis provided for this setup.
Price Action
- ■Price action is structurally positive.
- ■Forming higher highs and higher lows.
Volume Profile
- ■Volume is supportive of the price action.
- ■Wait for volume expansion on breakout.
Key Levels
No zones specified
No zones specified
Invalidation Scenario
A weekly close below the support level invalidates this structure.
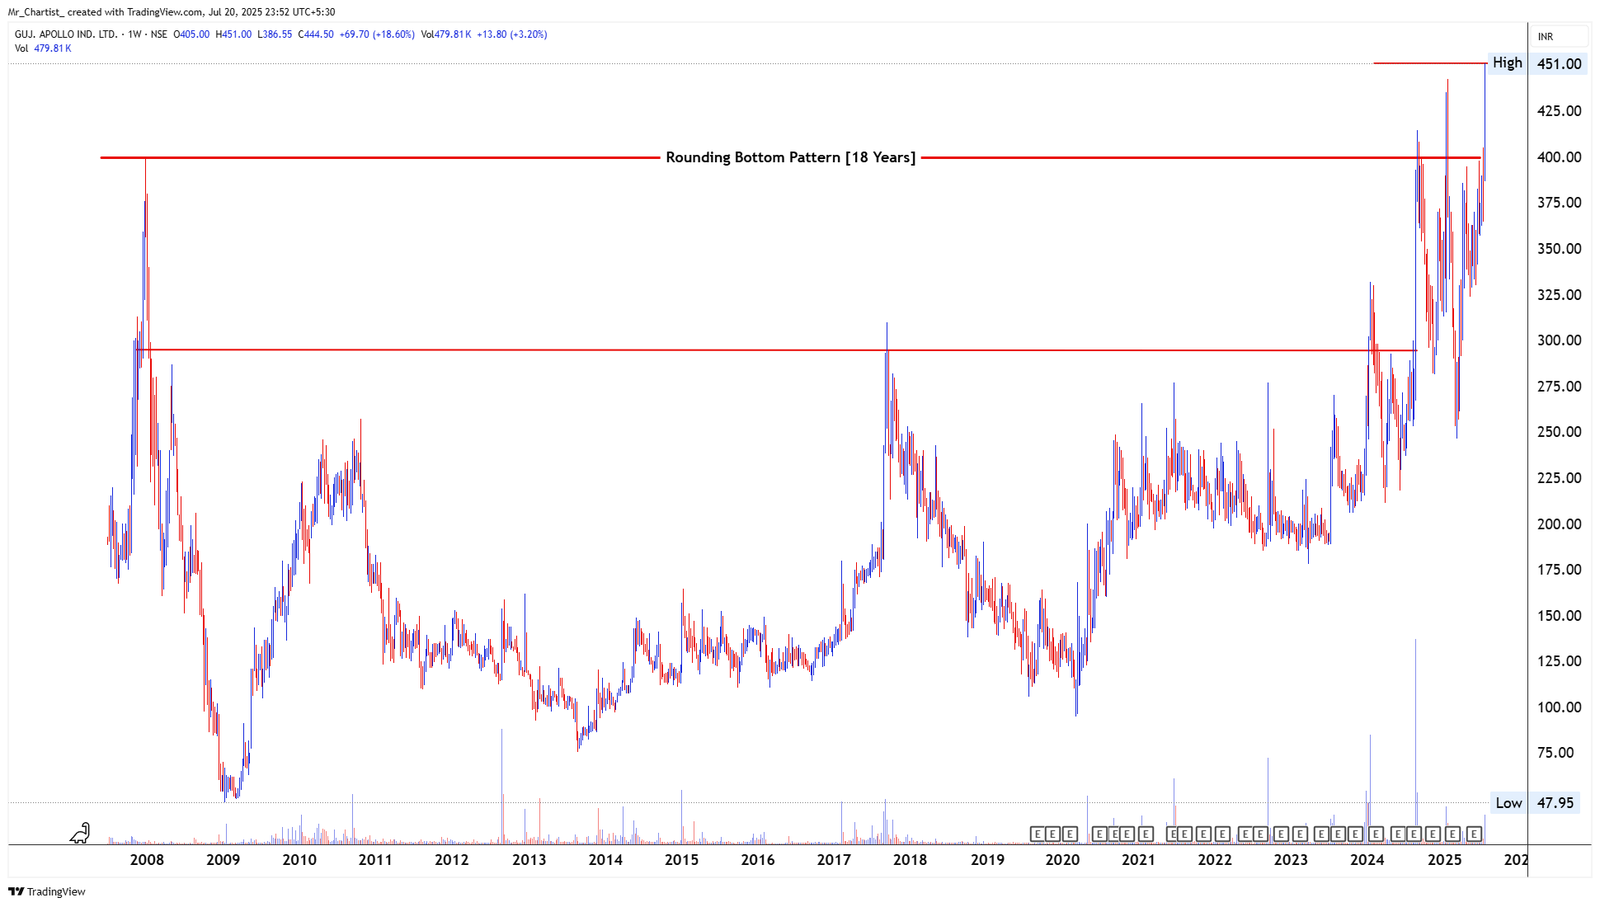
GUJARAT APOLLO INDUSTRIES LTD
bearish fnoRounding Bottom
18 Years (Weekly Chart – Major Long-Term Base)
Thesis & Analysis
Gujarat Apollo has completed a massive 18-year rounding bottom formation—a powerful long-term reversal pattern. The base started forming all the way back in 2007, with years of sideways movement and gradual accumulation. Price recently cleared the key neckline near ₹400, and today it has posted a strong breakout above the 2008 high, marking a historic breakout. This move signals a major structural shift in trend, supported by years of price compression and now strong upside resolution. Candlestick Behavior: This week’s candle is a large bullish breakout bar, clearly extending above all prior resistance. There's strong follow-through with no signs of hesitation or selling near the breakout point. Volume View: Volume has picked up significantly over the past few months, and especially during this breakout. The consistent build-up in volume supports the long-term accumulation theory and validates the breakout strength. 2. Crucial Support and Resistance Levels Resistance Zones: ₹451: Current all-time high; may act as a short-term pause level. ₹500+: Round number zone and next potential psychological target. ₹600–₹640: Projected extension levels based on pattern height. Support Zones: ₹400–₹410: Breakout zone; now acting as strong support. ₹365–₹370: Upper part of the prior range. ₹300: Multi-year support zone from the long base. 3. Strategic Trade Scenarios 🔸 Primary Setup – Breakout Rally Active With a confirmed breakout above the 18-year neckline, the stock is now in long-term uptrend mode. As long as price stays above ₹400, the move remains healthy, and targets of ₹500 and ₹600 can unfold in coming quarters. 🔹 Alternate Setup – Retest Possibility If price pulls back toward the ₹400 zone, it may serve as a classic retest of the breakout. Only a breakdown below ₹365 would weaken the structure, though the broader pattern remains valid unless ₹300 is breached. Currently, the stock is showing clear breakout strength from a rare long-term formation—a move that may unlock multi-year potential.
Price Action
- ■Price action is structurally positive.
- ■Forming higher highs and higher lows.
Volume Profile
- ■Volume is supportive of the price action.
- ■Wait for volume expansion on breakout.
Key Levels
No zones specified
No zones specified
Invalidation Scenario
A weekly close below the support level invalidates this structure.
INFOBEANS TECH LTD
bearish fnoDouble Bottom Breakout
Daily Chart
Thesis & Analysis
No detailed thesis provided for this setup.
Price Action
- ■Price action is structurally positive.
- ■Forming higher highs and higher lows.
Volume Profile
- ■Volume is supportive of the price action.
- ■Wait for volume expansion on breakout.
Key Levels
No zones specified
No zones specified
Invalidation Scenario
A weekly close below the support level invalidates this structure.
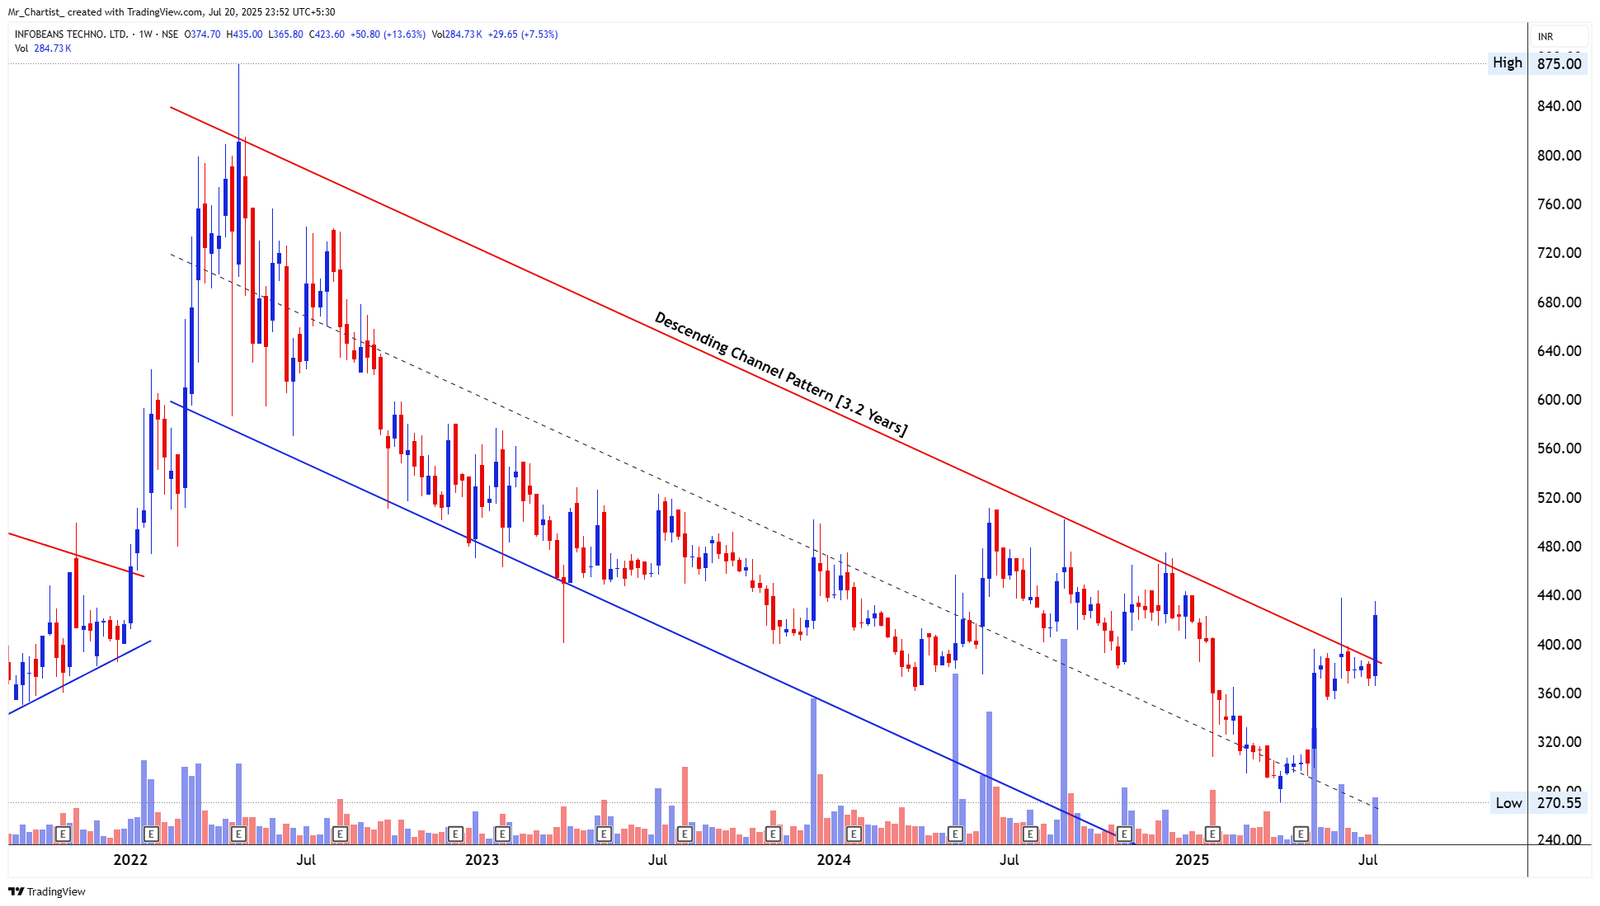
INFOBEANS TECH LTD
bearish fnoDescending Channel
3.2 Years (Weekly Chart)
Thesis & Analysis
InfoBeans has been moving inside a well-defined descending channel for over 3 years now. The price action formed lower highs and lower lows, respecting both upper and lower trendlines. After a recent sharp bounce from the lower boundary, the stock has now attempted to break above the upper red trendline, signaling an early sign of trend reversal. This breakout attempt is significant considering how long the stock remained under channel pressure. This week's red candle shows some selling at higher levels, which is natural after a quick up move. Candlestick Behavior: This week’s candle is a bearish rejection bar after touching the upper boundary, but previous candles showed strong bullish pressure, suggesting buyers are getting active. Volume Insight: Volume has steadily increased over the past few weeks, especially during the breakout attempt. This shows growing interest and validates the breakout as more than just a temporary spike. 2. Crucial Support and Resistance Levels Resistance Zones: ₹440–₹450: Immediate breakout zone; price faced selling from here. ₹480–₹500: Next hurdle; upper supply from previous highs. ₹580: Medium-term resistance area in case trend strengthens. Support Zones: ₹385–₹390: First line of support – previous breakout retest zone. ₹345–₹350: Minor support inside the channel. ₹310: Strong multi-month base inside the lower channel. 3. Strategic Trade Scenarios 🔸 Primary Setup – Breakout Attempt in Progress Stock is testing a long-term falling channel breakout, which can turn bullish on sustained strength above ₹450. For now, short-term pullbacks are healthy as long as it stays above ₹385. Watch for strength to resume with strong candle above ₹440–₹450 zone. Rising volumes will confirm buyer control. 🔹 Alternate Setup – If Breakout Fails If price breaks below ₹385 again, the breakout attempt would be delayed. In that case, price may drift back inside the channel with ₹345 and ₹310 as likely reaction zones. This setup is worth tracking closely, as a confirmed breakout from a multi-year channel often leads to multi-month trend changes.
Price Action
- ■Price action is structurally positive.
- ■Forming higher highs and higher lows.
Volume Profile
- ■Volume is supportive of the price action.
- ■Wait for volume expansion on breakout.
Key Levels
No zones specified
No zones specified
Invalidation Scenario
A weekly close below the support level invalidates this structure.
INNOVASYNTH INVESTMENTS LTD
bearish fnoDouble Bottom Breakout
Daily Chart
Thesis & Analysis
No detailed thesis provided for this setup.
Price Action
- ■Price action is structurally positive.
- ■Forming higher highs and higher lows.
Volume Profile
- ■Volume is supportive of the price action.
- ■Wait for volume expansion on breakout.
Key Levels
No zones specified
No zones specified
Invalidation Scenario
A weekly close below the support level invalidates this structure.
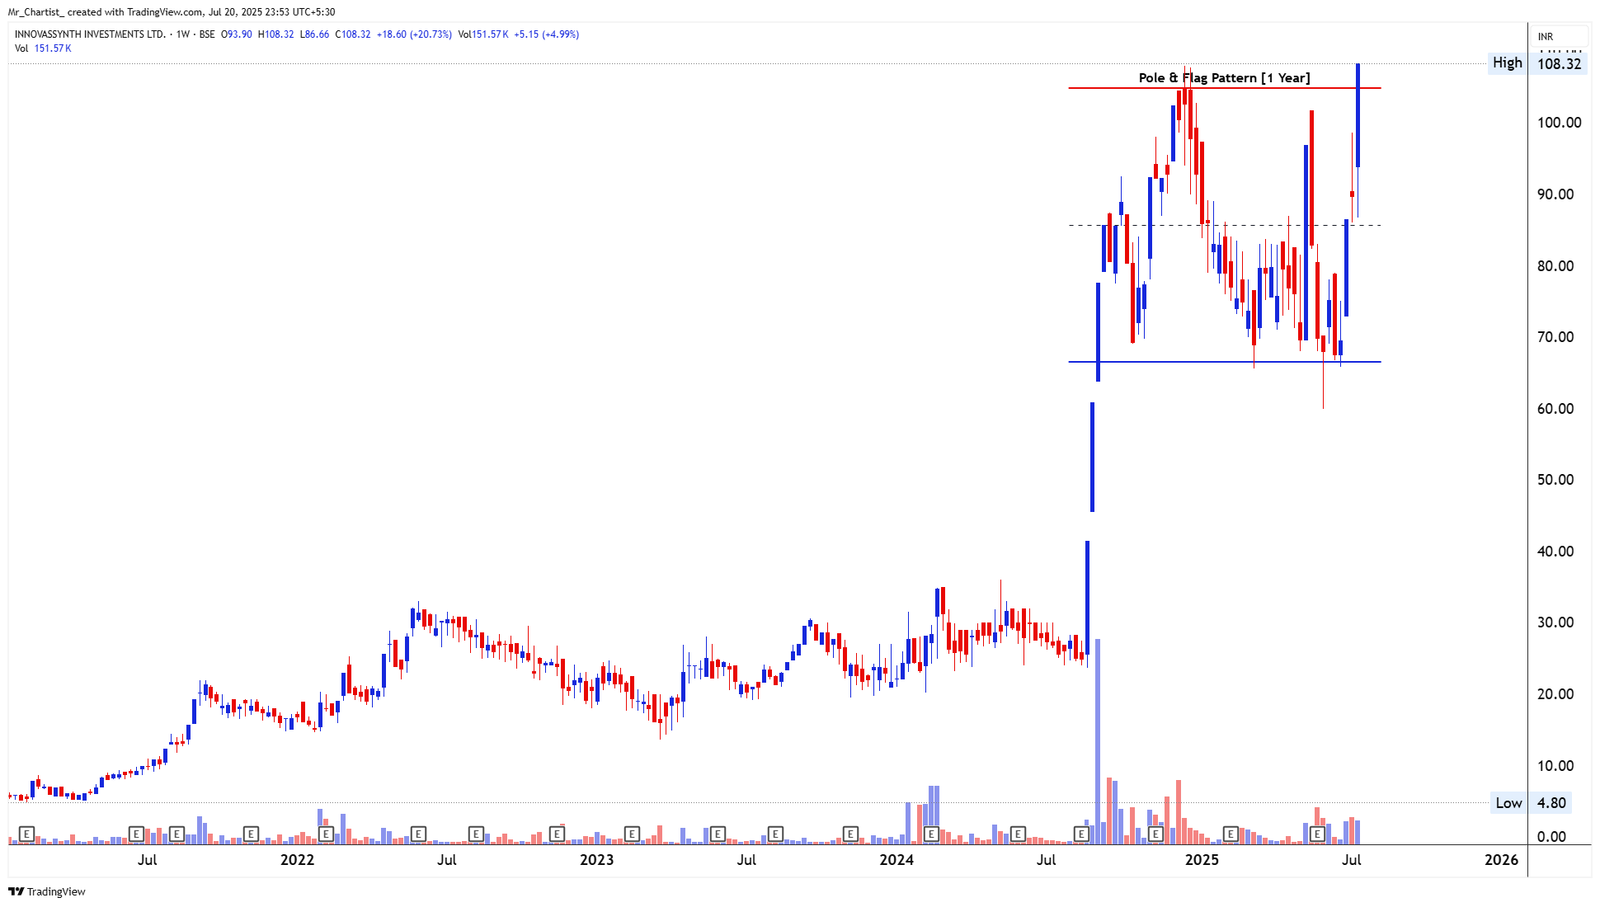
INNOVASYNTH INVESTMENTS LTD
bearish fnoPole and Flag
1 Year (Weekly Chart)
Thesis & Analysis
The stock made a massive vertical move last year, forming a clear “pole,” and since then, has moved sideways within a broad rectangular flag for nearly 12 months. This week, it broke out sharply from the flag, closing at fresh highs. This pattern indicates strong continuation potential after consolidation. The pole represents the impulsive move, and the sideways flag reflects the pause before a fresh uptrend. Candlestick Formation: This week’s large bullish candle engulfed multiple prior bars, closing above previous highs – showing strong momentum. Volume Observation: Breakout came with noticeable volume rise, a key positive sign confirming buyer conviction. 2. Crucial Support and Resistance Levels Resistance Zones: ₹108–₹110: Current breakout zone – price is attempting to hold above this level. ₹125+: No clear resistance beyond ₹110 on the visible chart; stock could enter free zone. Support Zones: ₹90: Immediate previous swing high and consolidation midpoint. ₹72–₹75: Strong horizontal base of flag. ₹60: Start of flag range, very strong support if deeper pullback happens. These levels are now important to monitor for any retest or breakout continuation. 3. Strategic Trade Scenarios 🔸 Primary Setup – Fresh Breakout from Flag The stock has broken out from a 1-year Pole & Flag continuation pattern. If the price sustains above ₹108–110 zone with momentum, we could see multi-week trending move. Watch for follow-up strength and consolidation above ₹110 for confirmation. Volume should remain above average. 🔹 Alternative Setup – Breakout Fails If the stock fails to hold ₹108 and falls back below ₹90 on volume, this would indicate a false breakout. In that case, it could revisit ₹75–₹72 base again. For now, the momentum favors bulls with a clean pattern and volume support – ideal breakout structure.
Price Action
- ■Price action is structurally positive.
- ■Forming higher highs and higher lows.
Volume Profile
- ■Volume is supportive of the price action.
- ■Wait for volume expansion on breakout.
Key Levels
No zones specified
No zones specified
Invalidation Scenario
A weekly close below the support level invalidates this structure.
INDIA STEEL WORKS LTD
bearish fnoDouble Bottom Breakout
Daily Chart
Thesis & Analysis
No detailed thesis provided for this setup.
Price Action
- ■Price action is structurally positive.
- ■Forming higher highs and higher lows.
Volume Profile
- ■Volume is supportive of the price action.
- ■Wait for volume expansion on breakout.
Key Levels
No zones specified
No zones specified
Invalidation Scenario
A weekly close below the support level invalidates this structure.
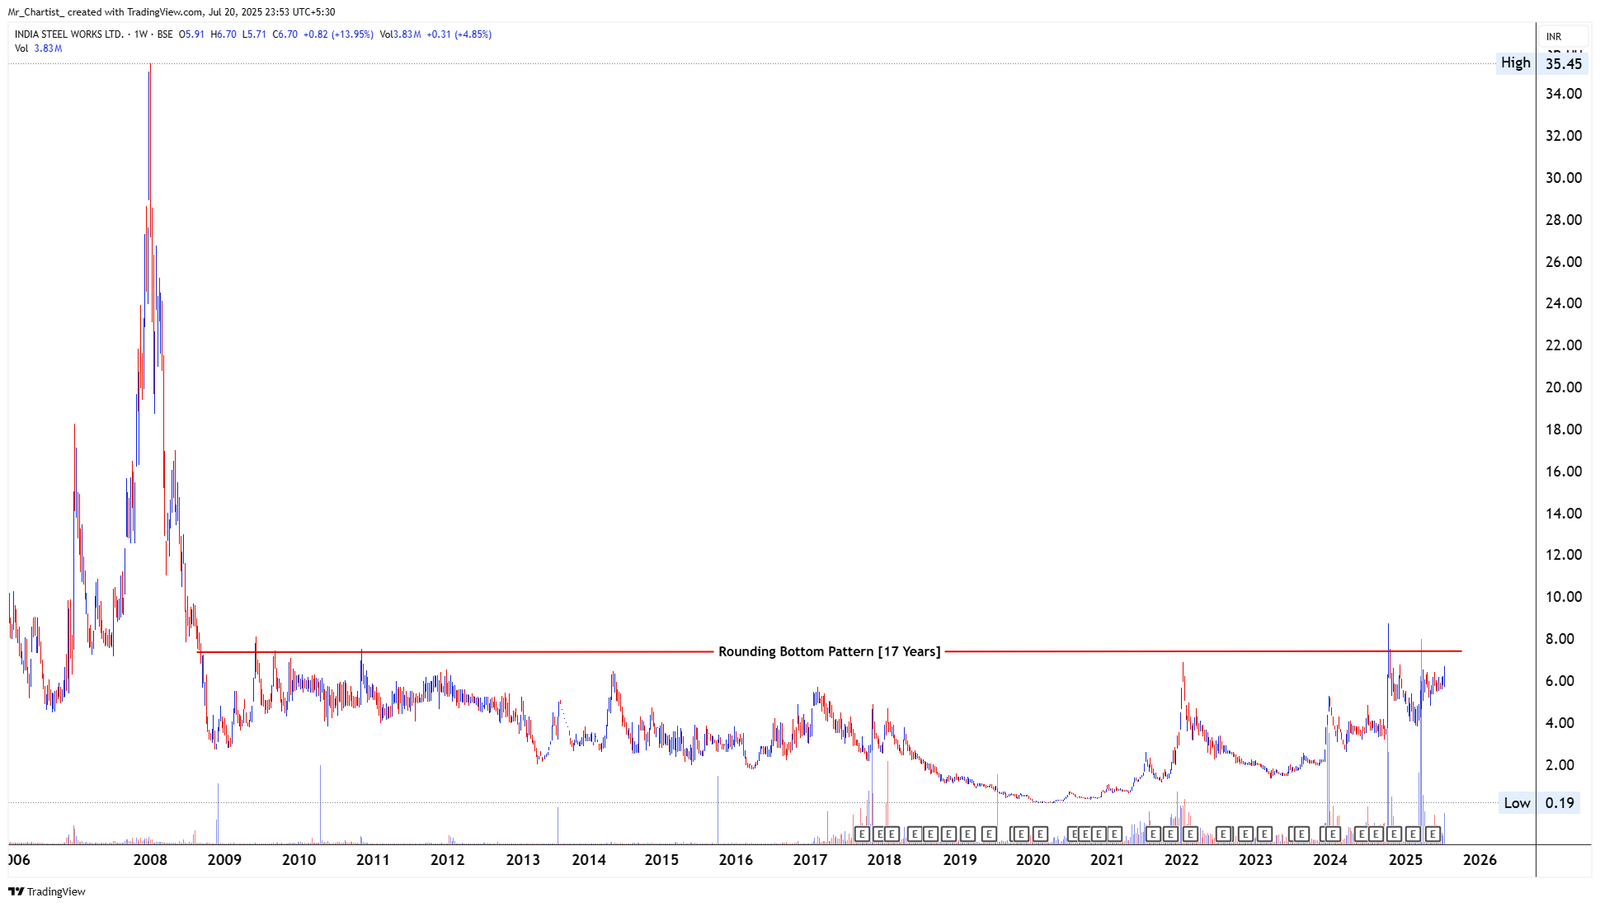
INDIA STEEL WORKS LTD
bearish fnoRounding Bottom
17 Years (Weekly Chart – Long-Term Base Formation)
Thesis & Analysis
India Steel has formed a massive rounding bottom pattern that has taken shape over the last 17 years. The stock went through a prolonged consolidation phase with very low volatility and volume, staying under a clear horizontal resistance zone for more than a decade. Recently, price has started showing signs of strength as it approaches the upper boundary of this rounding base. The structure suggests a potential breakout after years of accumulation. Candlestick Behavior: The latest weekly candle is a wide-range bullish bar with a strong close near the high. The move is backed by strong bullish momentum and consistent weekly strength. Volume View: Volume has seen a notable pickup over the last few weeks. This rising volume near the breakout level adds strong confirmation to the pattern. It’s a sign of institutional or heavy buying interest at this crucial zone. 2. Crucial Support and Resistance Levels Resistance Zones: ₹7.50: Long-term neckline resistance of the rounding bottom. ₹10.00: Psychological level and old 2011 swing highs. ₹14.00–₹15.00: Major supply zone from 2008-09 fall. Support Zones: ₹5.20: Short-term swing support. ₹4.00: Last pullback base during recent upmove. ₹2.80: Long-term accumulation base zone. The ₹7.50 level is the key breakout trigger; above this, the structure may transition into a strong long-term uptrend. 3. Strategic Trade Scenarios 🔸 Primary Setup – Breakout from 17-Year Rounding Base If price breaks and sustains above ₹7.50 with good volume, the long-term rounding bottom breakout confirms. This could open potential upside legs toward ₹10 and ₹14+ in the coming months. 🔹 Alternate Setup – Failure at Resistance Zone If the price faces rejection near ₹7.50 and slips below ₹5.20, a retest of ₹4 or even ₹2.80 could happen. As long as the price holds above ₹2.80, the structure remains bullish. This is a high-maturity base formation, and the stock is now right at the neckline, making it an important technical setup to monitor closely.
Price Action
- ■Price action is structurally positive.
- ■Forming higher highs and higher lows.
Volume Profile
- ■Volume is supportive of the price action.
- ■Wait for volume expansion on breakout.
Key Levels
No zones specified
No zones specified
Invalidation Scenario
A weekly close below the support level invalidates this structure.
MAHINDRA EPC IRRIGATION LTD
bearish fnoDouble Bottom Breakout
Daily Chart
Thesis & Analysis
No detailed thesis provided for this setup.
Price Action
- ■Price action is structurally positive.
- ■Forming higher highs and higher lows.
Volume Profile
- ■Volume is supportive of the price action.
- ■Wait for volume expansion on breakout.
Key Levels
No zones specified
No zones specified
Invalidation Scenario
A weekly close below the support level invalidates this structure.
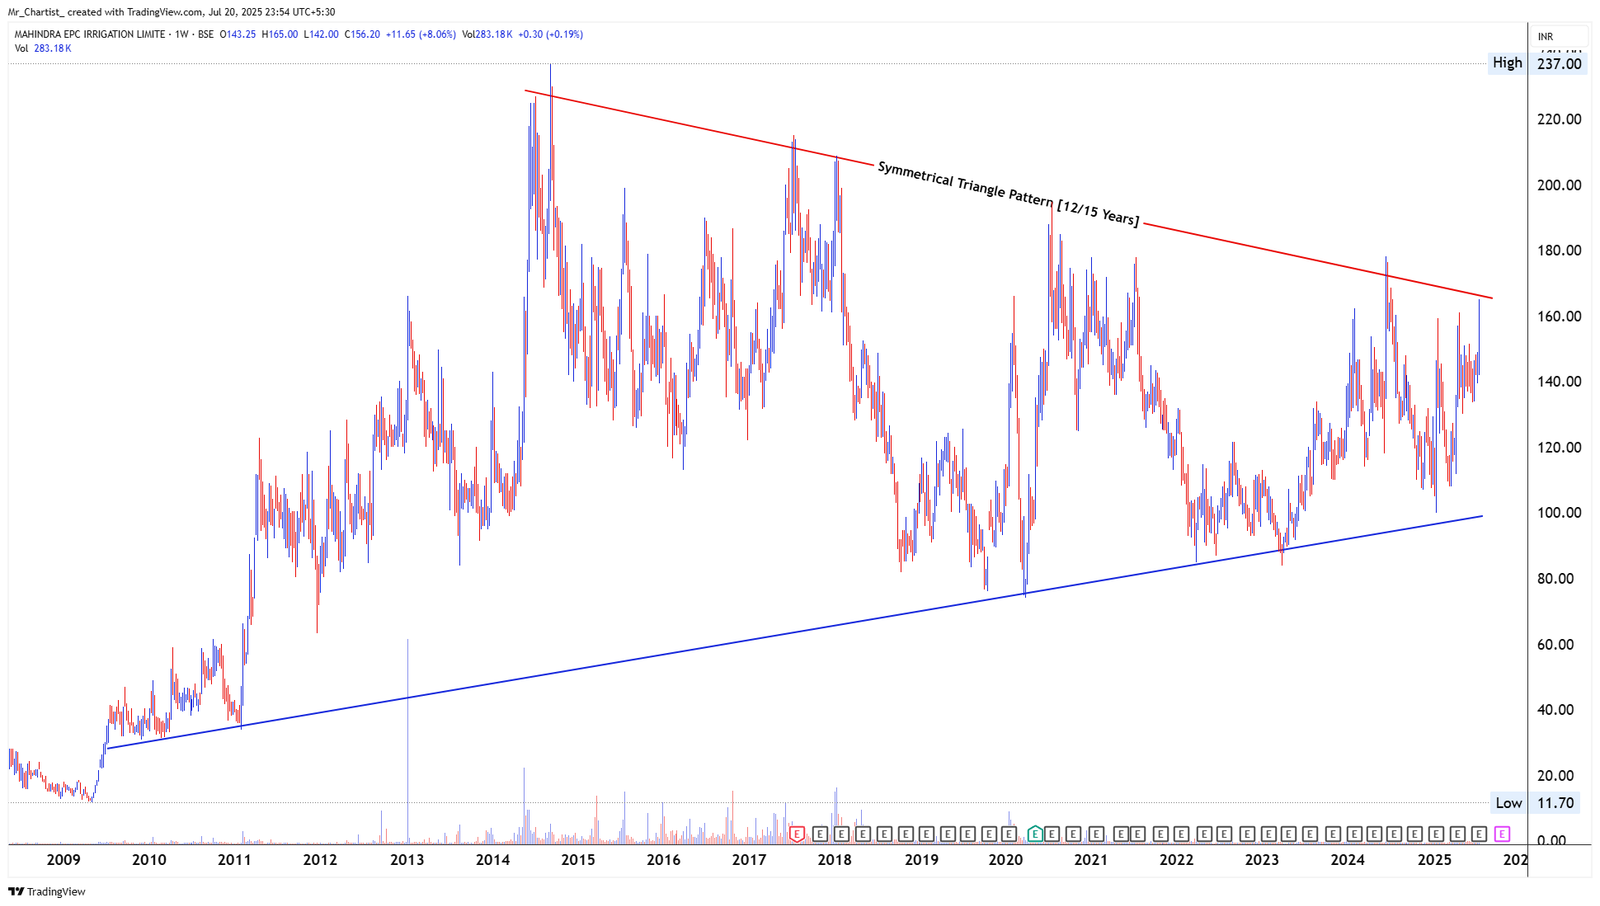
MAHINDRA EPC IRRIGATION LTD
bearish fnoSymmetrical Triangle
12–15 Years (Weekly Chart – Multi-Decade Compression Zone)
Thesis & Analysis
Mahindra EPC is currently trading within a long-term symmetrical triangle pattern that's been developing for over a decade. This setup showcases progressively lower highs and higher lows, compressing price action into a tighter range. The triangle represents a classic indecision phase, typically followed by strong directional movement. The recent uptick has pushed the stock toward the upper resistance trendline, suggesting renewed bullish interest and a potential breakout watch. Candlestick Behavior: This week’s candle is a strong bullish bar with a close near the week’s high. Price is testing a long-standing falling trendline. Prior candles showed consolidation and tight ranges— typical of pre-breakout setups. Volume View: Volume has gradually risen in the past few weeks, showing renewed accumulation. The latest volume spike aligns with bullish intent, though confirmation is pending a decisive breakout. 2. Crucial Support and Resistance Levels Resistance Zones: ₹165–₹170: Multi-year triangle resistance zone. ₹185–₹200: Historic supply zone from 2018–2020 peaks. ₹230–₹237: 2014 lifetime highs. Support Zones: ₹140: Minor support from recent base. ₹120–₹125: Key demand zone within triangle. ₹100: Long-term ascending triangle support. A confirmed breakout above ₹170 with volume could indicate a major trend shift after years of coiling. 3. Strategic Trade Scenarios 🔸 Primary Setup – Breakout from Symmetrical Triangle If price closes above ₹170 with volume expansion, it would confirm a breakout from the 12–15 year triangle. This move could target ₹200 and ₹230+ over the medium term as it escapes long-term compression. 🔹 Alternate Setup – Rejection at Resistance If the price faces rejection at ₹165–₹170, a pullback toward ₹140 or ₹125 could occur. The structure remains valid as long as the price stays above ₹100, where the long-term uptrend line holds firm. Mahindra EPC is at a critical juncture after years of tight coiling. A breakout here could set the stage for a structural trend reversal.
Price Action
- ■Price action is structurally positive.
- ■Forming higher highs and higher lows.
Volume Profile
- ■Volume is supportive of the price action.
- ■Wait for volume expansion on breakout.
Key Levels
No zones specified
No zones specified
Invalidation Scenario
A weekly close below the support level invalidates this structure.
MANALI PETROCHEMICALS LTD
bearish fnoDouble Bottom Breakout
Daily Chart
Thesis & Analysis
No detailed thesis provided for this setup.
Price Action
- ■Price action is structurally positive.
- ■Forming higher highs and higher lows.
Volume Profile
- ■Volume is supportive of the price action.
- ■Wait for volume expansion on breakout.
Key Levels
No zones specified
No zones specified
Invalidation Scenario
A weekly close below the support level invalidates this structure.
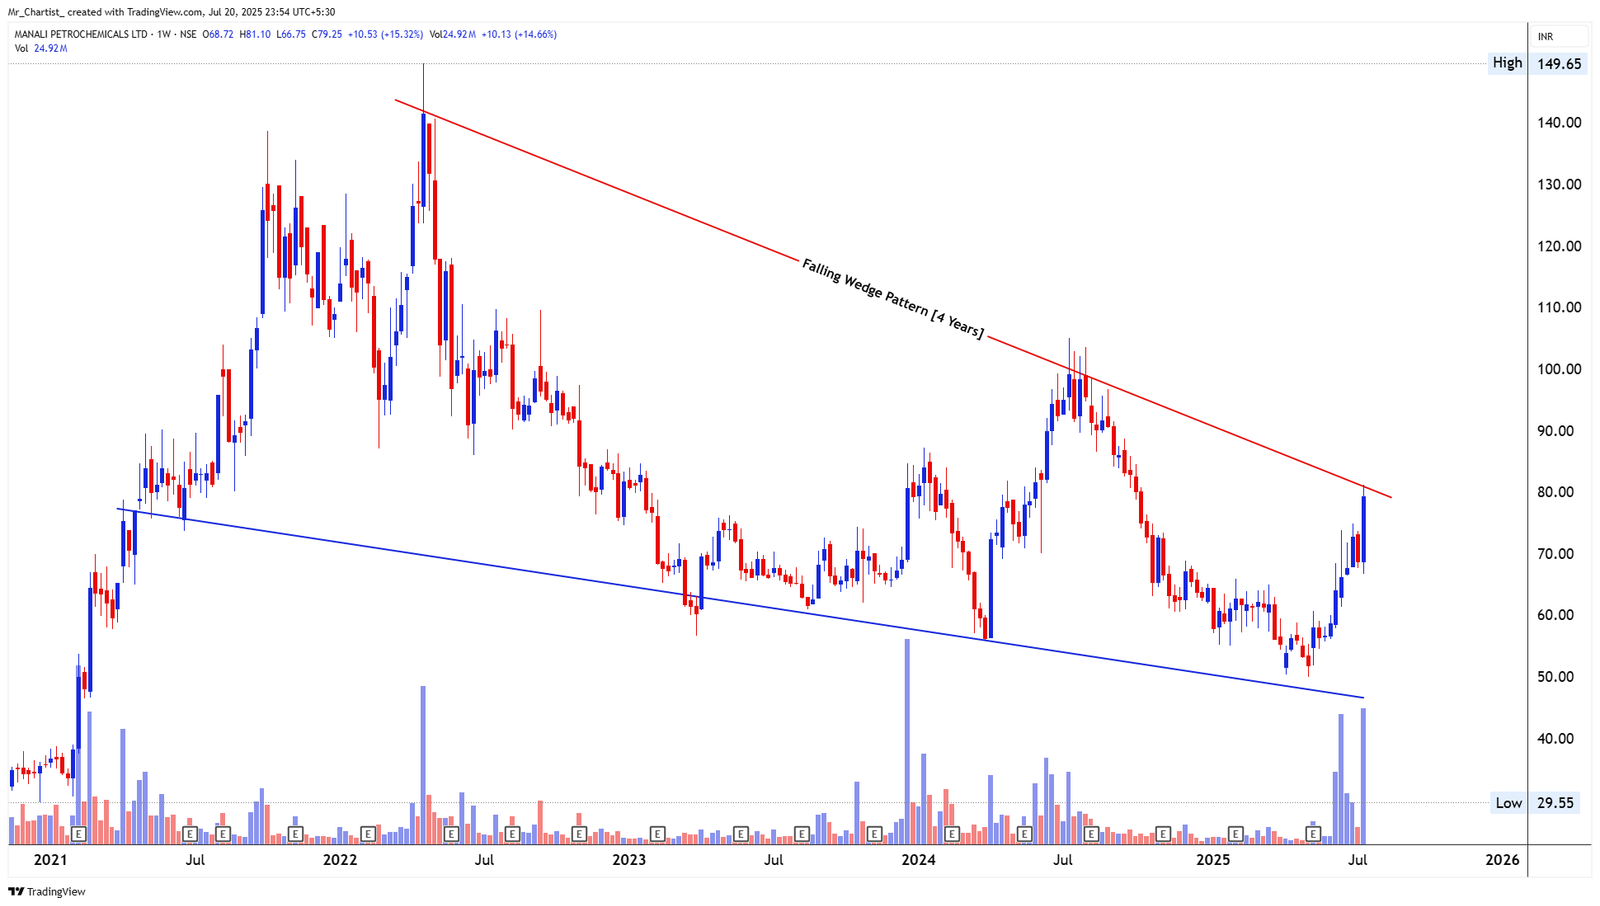
MANALI PETROCHEMICALS LTD
bearish fnoFalling Wedge
4 Years (Weekly Chart – Long-Term Reversal Formation)
Thesis & Analysis
Manali Petrochemicals has been consolidating within a broad falling wedge pattern for the past 4 years, characterized by descending lower highs and lower lows. This long-term formation suggests gradual seller exhaustion and potential accumulation, particularly after such extended price compression. The stock recently made a sharp upward move, testing the wedge’s upper boundary. This push comes on the back of heavy buying activity, indicating that a breakout attempt may be underway. Candlestick Behavior: The current weekly candle is a strong wide-bodied bullish bar, closing near its high—a possible breakout initiation bar. The prior few weeks showed steady price climbs with controlled pullbacks. Volume View: Volume has surged notably in recent weeks. The recent volume spike coinciding with upward momentum signals growing institutional interest and adds credibility to the breakout prospects. 2. Crucial Support and Resistance Levels Resistance Zones: ₹82–₹85: Falling wedge resistance; immediate breakout test zone. ₹100: Swing high from mid-2023; secondary confirmation level. ₹125–₹130: Major supply zone from early 2022. Support Zones: ₹72–₹75: Minor support from last week’s breakout base. ₹63: Key level from previous consolidation. ₹50–₹52: Lower wedge boundary; long-term structural support. Price is currently in the upper quadrant of the wedge, hinting at breakout potential if the ₹85 zone is breached convincingly. 3. Strategic Trade Scenarios 🔸 Primary Setup – Breakout Continuation from 4-Year Falling Wedge If price decisively breaks and sustains above ₹85 on strong volume, it confirms the wedge breakout. The stock could then trend toward ₹100 and extend toward ₹125 over the medium term. 🔹 Alternate Setup – False Breakout & Rejection at Resistance If price gets rejected at ₹82–₹85, a pullback toward ₹72 or even ₹63 is possible. However, the long-term wedge remains intact as long as price holds above ₹50. This setup is evolving into a potential structural reversal with historical compression, and a confirmed breakout would mark a major sentiment shift.
Price Action
- ■Price action is structurally positive.
- ■Forming higher highs and higher lows.
Volume Profile
- ■Volume is supportive of the price action.
- ■Wait for volume expansion on breakout.
Key Levels
No zones specified
No zones specified
Invalidation Scenario
A weekly close below the support level invalidates this structure.
PERMANENT MAGNETS LTD
bearish fnoDouble Bottom Breakout
Daily Chart
Thesis & Analysis
No detailed thesis provided for this setup.
Price Action
- ■Price action is structurally positive.
- ■Forming higher highs and higher lows.
Volume Profile
- ■Volume is supportive of the price action.
- ■Wait for volume expansion on breakout.
Key Levels
No zones specified
No zones specified
Invalidation Scenario
A weekly close below the support level invalidates this structure.
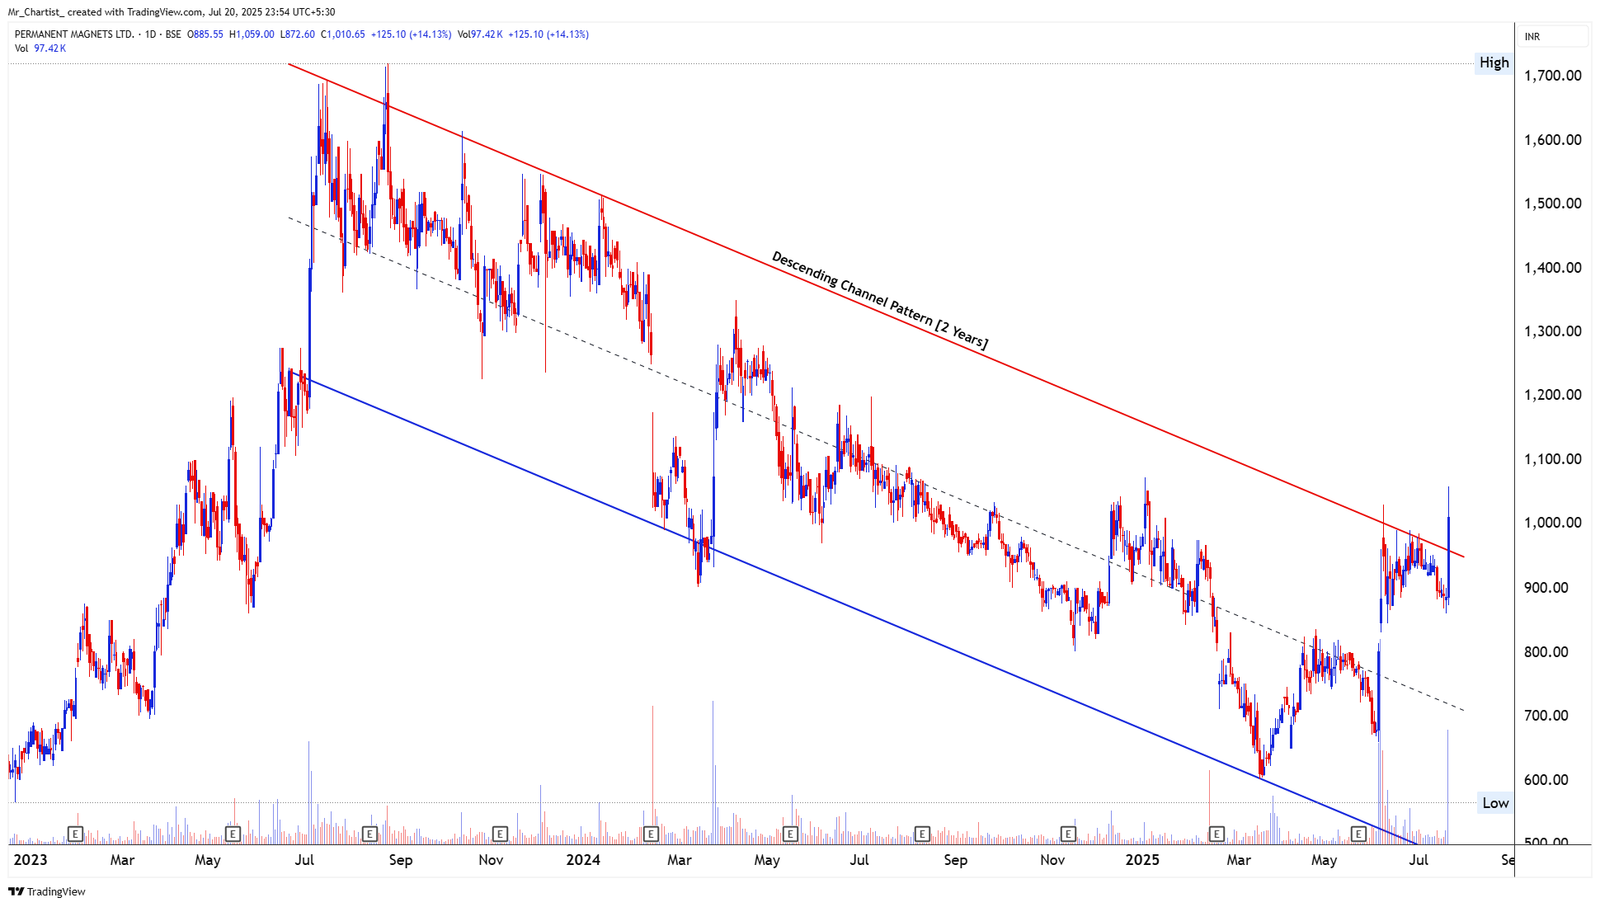
PERMANENT MAGNETS LTD
bearish fnoDescending Channel
2 Years (Daily Chart – Medium-Term Breakout Structure)
Thesis & Analysis
Permanent Magnets has been trending inside a well-defined descending channel for the past two years, forming a sequence of lower highs and lower lows. This classical pattern reflects sustained profit-taking with orderly pullbacks and lower volatility compression over time. In the latest sessions, the price has pierced the upper boundary of this channel on strong momentum, potentially indicating a breakout from this corrective phase. Candlestick Behavior: The recent candle is a powerful bullish bar with a wide range and strong close near the day’s high. This is a significant change of character compared to previous candles, hinting at strong breakout intent. Volume View: Volume has surged sharply in tandem with the breakout, clearly above the average. The increase in volume adds validity to the breakout and shows aggressive buyer interest at channel resistance. 2. Crucial Support and Resistance Levels Resistance Zones: ₹1,020–₹1,050: Upper channel boundary; immediate breakout zone. ₹1,120–₹1,200: Major supply zone from Oct–Dec 2023. ₹1,300+: Historical resistance and the next major target if momentum continues. Support Zones: ₹940–₹960: Initial post-breakout support. ₹860: Mid-channel consolidation base. ₹720–₹750: Lower boundary of the channel and key historical support. The price is now at a critical technical juncture, moving out of a controlled downtrend with expansionary momentum. 3. Strategic Trade Scenarios 🔸 Primary Setup – Channel Breakout with Volume Surge If the stock sustains above ₹1,020, it confirms a breakout from the descending channel. The price could then target ₹1,120 in the short term and extend toward ₹1,300 as part of a trend reversal. 🔹 Alternate Setup – Pullback after False Breakout If the breakout fails and price dips below ₹940, it may retest ₹860. However, the broader pattern remains valid as long as ₹720 holds. The overall setup signals a key inflection point with trend reversal potential backed by strong momentum and volume participation.
Price Action
- ■Price action is structurally positive.
- ■Forming higher highs and higher lows.
Volume Profile
- ■Volume is supportive of the price action.
- ■Wait for volume expansion on breakout.
Key Levels
No zones specified
No zones specified
Invalidation Scenario
A weekly close below the support level invalidates this structure.
ROYAL ORCHID HOTELS LTD
bearish fnoDouble Bottom Breakout
Daily Chart
Thesis & Analysis
No detailed thesis provided for this setup.
Price Action
- ■Price action is structurally positive.
- ■Forming higher highs and higher lows.
Volume Profile
- ■Volume is supportive of the price action.
- ■Wait for volume expansion on breakout.
Key Levels
No zones specified
No zones specified
Invalidation Scenario
A weekly close below the support level invalidates this structure.
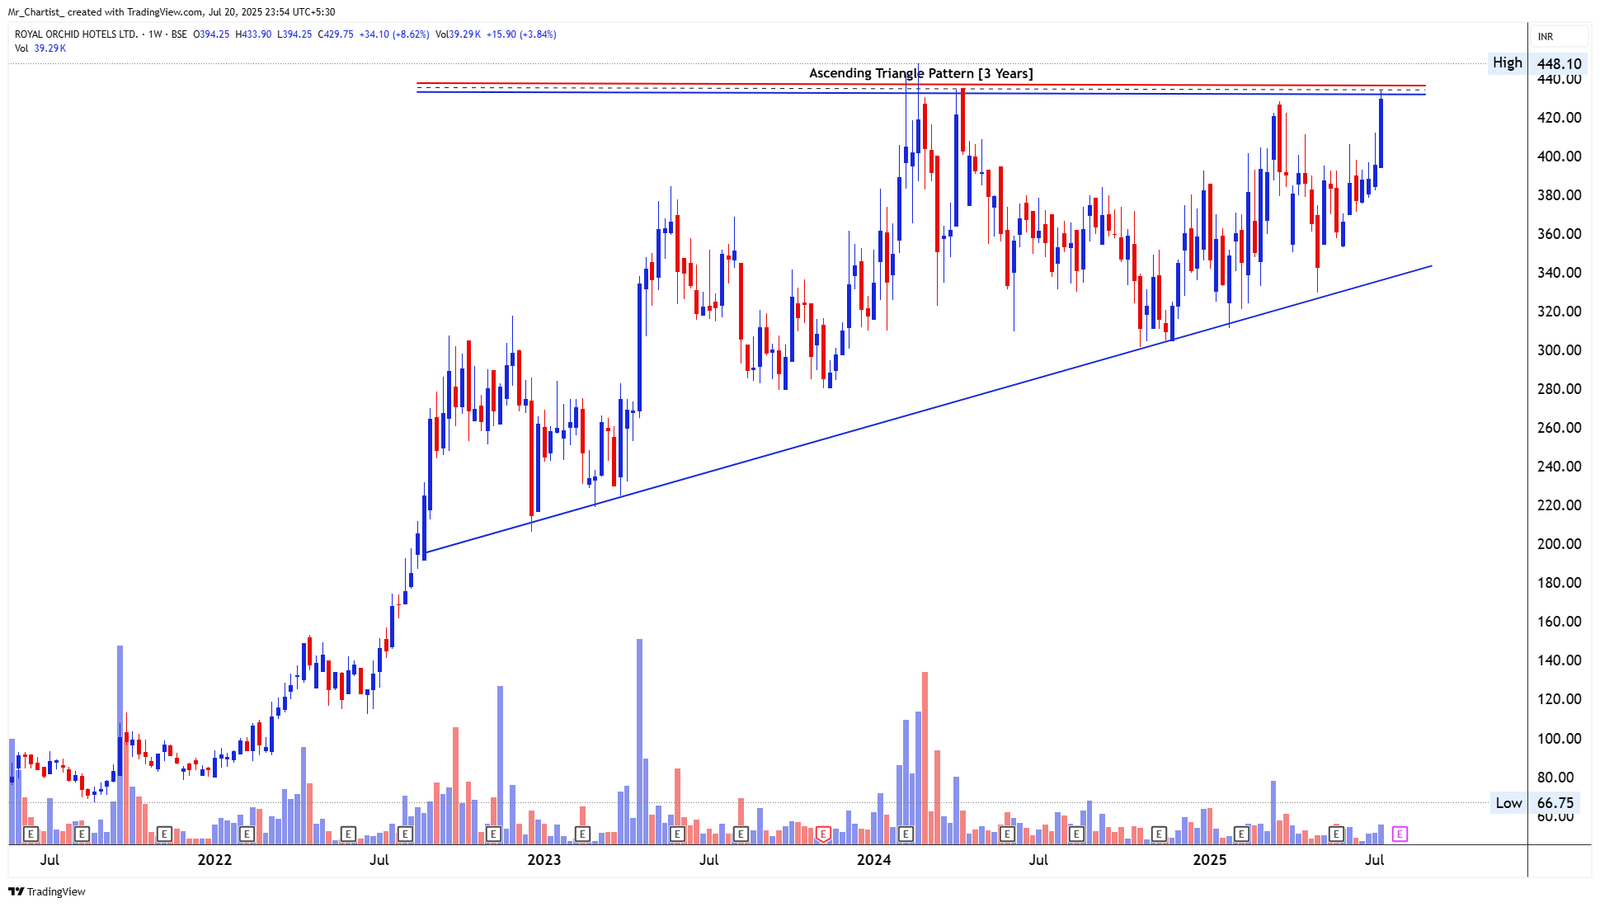
ROYAL ORCHID HOTELS LTD
bearish fnoAscending Triangle
3 Years (Weekly Chart – Consolidation with Bullish Bias)
Thesis & Analysis
Royal Orchid Hotels has formed a large ascending triangle over the last 3 years. This pattern is characterized by rising lows and a relatively flat resistance zone around ₹440. The sustained higher lows indicate accumulating strength and tightening supply. The stock is now hovering right at the upper boundary of this triangle, testing the horizontal resistance with strong bullish momentum. The structure favors an eventual breakout if momentum sustains. Candlestick Behavior: The latest weekly candle is a large bullish bar with a near-high close, suggesting strong buying pressure into resistance. Previous candles have been progressively larger, indicating momentum is building. Volume View: Volume has been relatively modest but increasing gradually. The current volume spike, though not extreme, aligns with the candle structure and shows constructive accumulation. 2. Crucial Support and Resistance Levels Resistance Zones: ₹440–₹448: Horizontal resistance; ascending triangle breakout zone. ₹485–₹500: Measured move target post-breakout. ₹540: Multi-year swing projection from 2021-2022 rally. Support Zones: ₹405: Recent swing base. ₹370–₹375: Triangle’s rising trendline support. ₹340: Key base support formed repeatedly since 2023. The price is currently coiled for a potential move after long consolidation within a strong continuation structure. 3. Strategic Trade Scenarios 🔸 Primary Setup – Triangle Breakout Anticipation If price sustains above ₹448 on strong volume, it would confirm a breakout from the ascending triangle. Potential upside targets then open toward ₹485 and ₹540 in the medium term. 🔹 Alternate Setup – Resistance Rejection and Pullback If resistance at ₹440–₹448 holds, price may pull back toward ₹405 or even the rising trendline near ₹375. As long as the price remains above ₹340, the ascending triangle remains valid. This is a textbook continuation pattern nearing resolution, with tight compression suggesting breakout timing is close.
Price Action
- ■Price action is structurally positive.
- ■Forming higher highs and higher lows.
Volume Profile
- ■Volume is supportive of the price action.
- ■Wait for volume expansion on breakout.
Key Levels
No zones specified
No zones specified
Invalidation Scenario
A weekly close below the support level invalidates this structure.
SHREE DIGVIJAY CEMENT CO LTD
bearish fnoDouble Bottom Breakout
Daily Chart
Thesis & Analysis
No detailed thesis provided for this setup.
Price Action
- ■Price action is structurally positive.
- ■Forming higher highs and higher lows.
Volume Profile
- ■Volume is supportive of the price action.
- ■Wait for volume expansion on breakout.
Key Levels
No zones specified
No zones specified
Invalidation Scenario
A weekly close below the support level invalidates this structure.
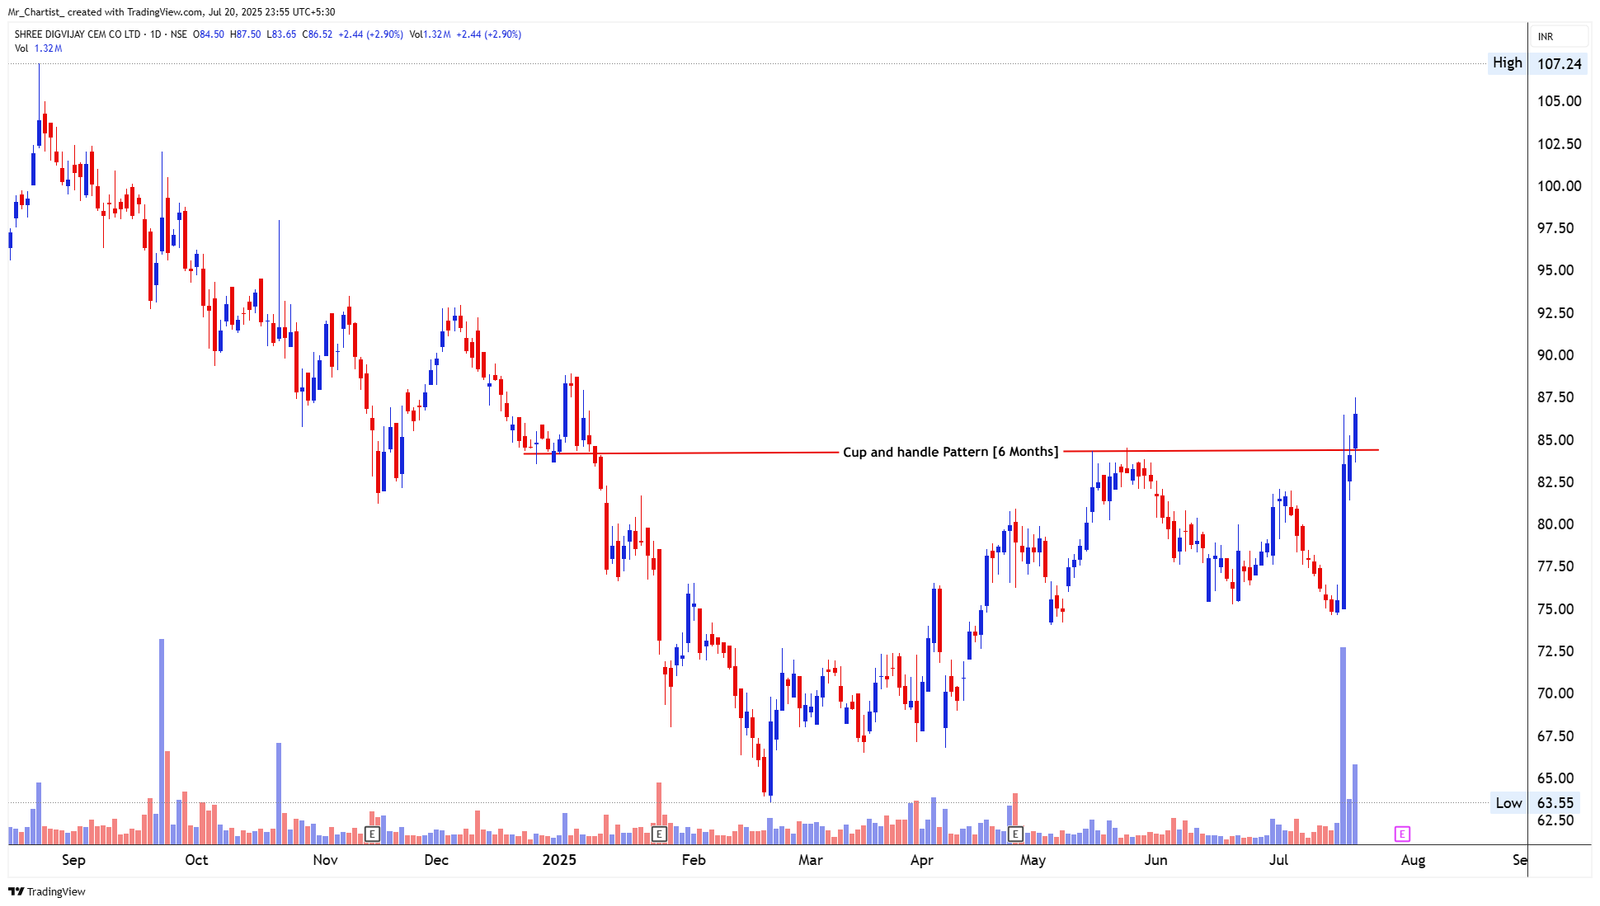
SHREE DIGVIJAY CEMENT CO LTD
bearish fnoCup and Handle
6 Months (Daily Chart – Medium-Term Breakout Setup)
Thesis & Analysis
Shree Digvijay Cement has completed a well-defined cup and handle pattern over the past 6 months, a classical bullish continuation setup. The handle formation tightened price action with decreasing volume before the recent breakout move. The price has convincingly broken above the neckline resistance around ₹85 with a strong bullish candle, suggesting pattern confirmation. Candlestick Behavior: A long bullish candle emerged on breakout day, closing near the day’s high and decisively above resistance. Prior handle candles were compressed, signaling low volatility before expansion. Volume View: Breakout accompanied by a sharp volume spike, confirming buying interest and strength behind the move. Recent volume trend aligns with classical breakout behavior. 2. Crucial Support and Resistance Levels Resistance Zones: ₹90–₹94: Minor resistance from previous consolidation zones. ₹100: Psychological level and historical resistance. ₹107–₹110: Previous swing high zone from September 2024. Support Zones: ₹84–₹85: Breakout neckline; now a key retest zone. ₹78: Handle base. ₹72–₹74: Lower base from prior cup bottom structure. The neckline breakout above ₹85 is a pivotal event and offers a strong technical setup if sustained. 3. Strategic Trade Scenarios 🔸 Primary Setup – Cup and Handle Breakout Play If price sustains above ₹85 with continued volume support, a rally toward ₹94 and eventually ₹100–₹107 is technically likely. Sustained momentum will be confirmed by a follow-through candle and consolidation above ₹90. 🔹 Alternate Setup – False Breakout Risk If price fails to hold above ₹85 and drops below ₹84 on high volume, it could trigger a pullback toward ₹78 or ₹74. However, the structure remains intact as long as price holds above ₹72. Currently, this is a fresh breakout from a bullish base pattern with strong follow-through—a technically sound breakout candidate.
Price Action
- ■Price action is structurally positive.
- ■Forming higher highs and higher lows.
Volume Profile
- ■Volume is supportive of the price action.
- ■Wait for volume expansion on breakout.
Key Levels
No zones specified
No zones specified
Invalidation Scenario
A weekly close below the support level invalidates this structure.
TAMILNADU PETROPRODUCTS LTD
bearish fnoDouble Bottom Breakout
Daily Chart
Thesis & Analysis
No detailed thesis provided for this setup.
Price Action
- ■Price action is structurally positive.
- ■Forming higher highs and higher lows.
Volume Profile
- ■Volume is supportive of the price action.
- ■Wait for volume expansion on breakout.
Key Levels
No zones specified
No zones specified
Invalidation Scenario
A weekly close below the support level invalidates this structure.
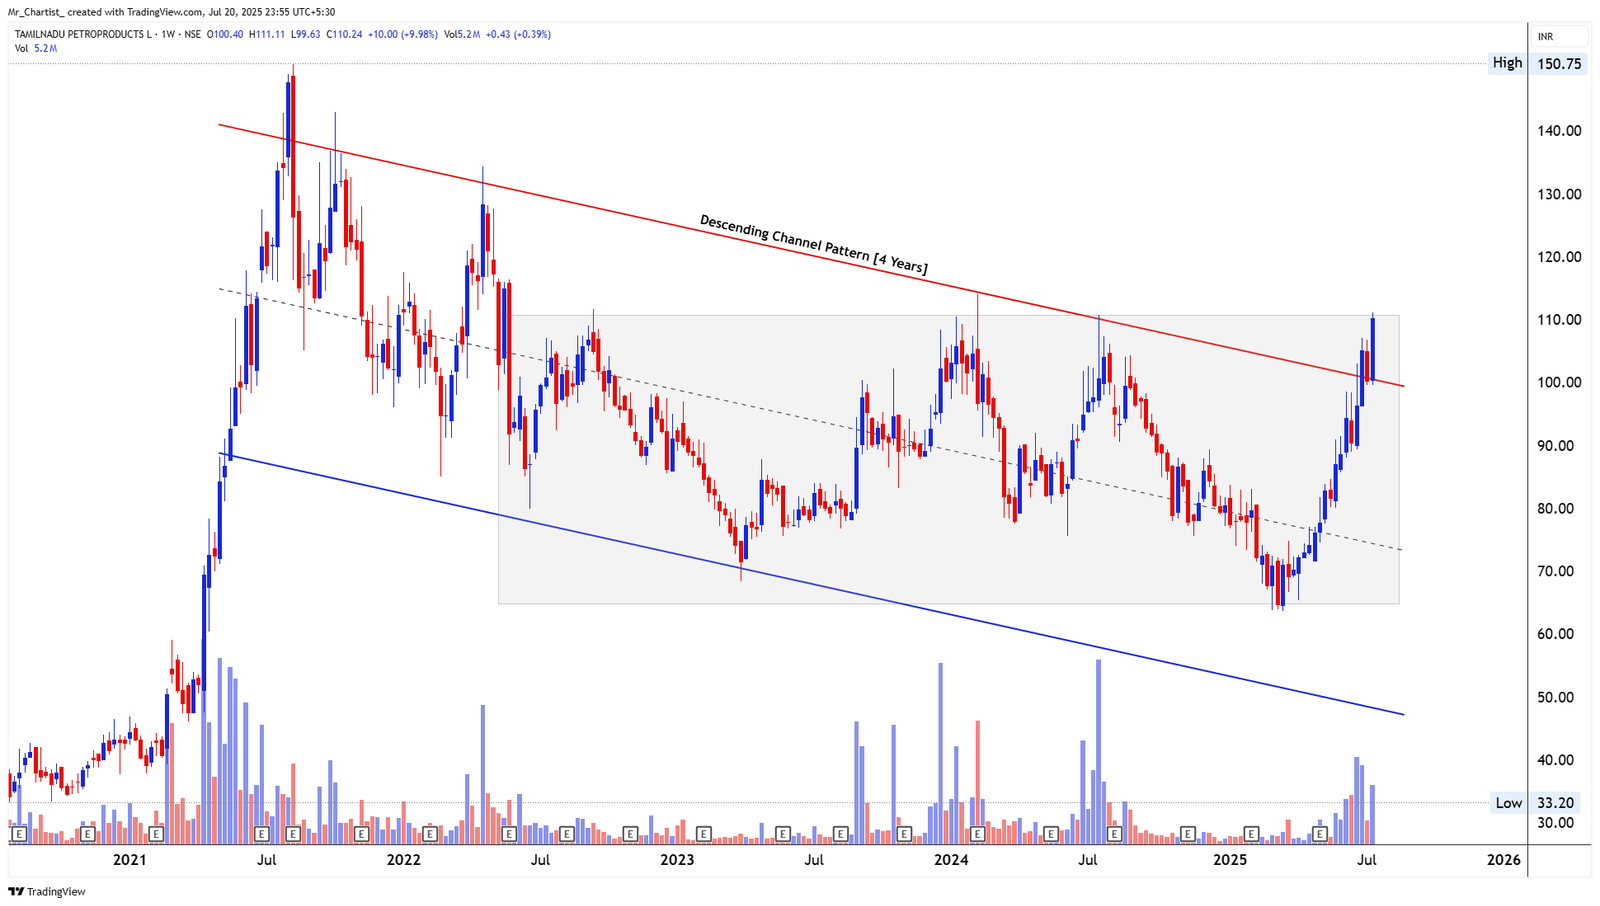
TAMILNADU PETROPRODUCTS LTD
bearish fnoDescending Channel
4 Years (Weekly Chart – Medium to Long-Term Reversal Watch)
Thesis & Analysis
Tamilnadu Petro has been moving within a well-structured descending channel over the past four years, making lower highs and lower lows in a controlled decline. The recent price action has shown a sharp breakout attempt from the upper boundary of this channel. The stock has made a decisive push toward the channel resistance line and briefly breached it before closing just at the edge—indicating a high-alert breakout zone. Candlestick Behavior: This week’s candle is a strong bullish bar with a wide range, followed by a minor upper wick indicating profit-booking or supply at resistance. Prior candles have shown increasing momentum over the past 6 weeks. Volume View: Volume has expanded meaningfully in the last few weeks, especially during the approach toward the breakout zone—a classic sign of accumulation and demand strength. 2. Crucial Support and Resistance Levels Resistance Zones: ₹112–₹115: Immediate resistance at the upper channel line; needs a strong weekly close above for confirmation. ₹130–₹135: Prior swing high from early 2022. ₹150–₹155: Historical resistance zone. Support Zones: ₹100: Channel breakout retest level. ₹90–₹92: Former swing resistance turned into demand zone. ₹75–₹78: Long-term structural support base. The channel top is acting as a make-or-break level for a long-term trend reversal confirmation. 3. Strategic Trade Scenarios 🔸 Primary Setup – Channel Breakout Watch If the price closes above ₹112–₹115 with volume confirmation, it would signal a clean breakout from the 4-year descending channel. This could open potential targets toward ₹130 and ₹150 in the coming months. 🔹 Alternate Setup – Rejection at Resistance If the price fails to sustain above ₹112 and drops below ₹100, a pullback into the ₹92– ₹95 zone is likely. The broader structure remains intact as long as the price stays above ₹75. This is a high-probability reversal setup developing from long-term compression, with bulls actively testing the upper boundaries.
Price Action
- ■Price action is structurally positive.
- ■Forming higher highs and higher lows.
Volume Profile
- ■Volume is supportive of the price action.
- ■Wait for volume expansion on breakout.
Key Levels
No zones specified
No zones specified
Invalidation Scenario
A weekly close below the support level invalidates this structure.
VENUS REMEDIES LTD
bearish fnoDouble Bottom Breakout
Daily Chart
Thesis & Analysis
No detailed thesis provided for this setup.
Price Action
- ■Price action is structurally positive.
- ■Forming higher highs and higher lows.
Volume Profile
- ■Volume is supportive of the price action.
- ■Wait for volume expansion on breakout.
Key Levels
No zones specified
No zones specified
Invalidation Scenario
A weekly close below the support level invalidates this structure.
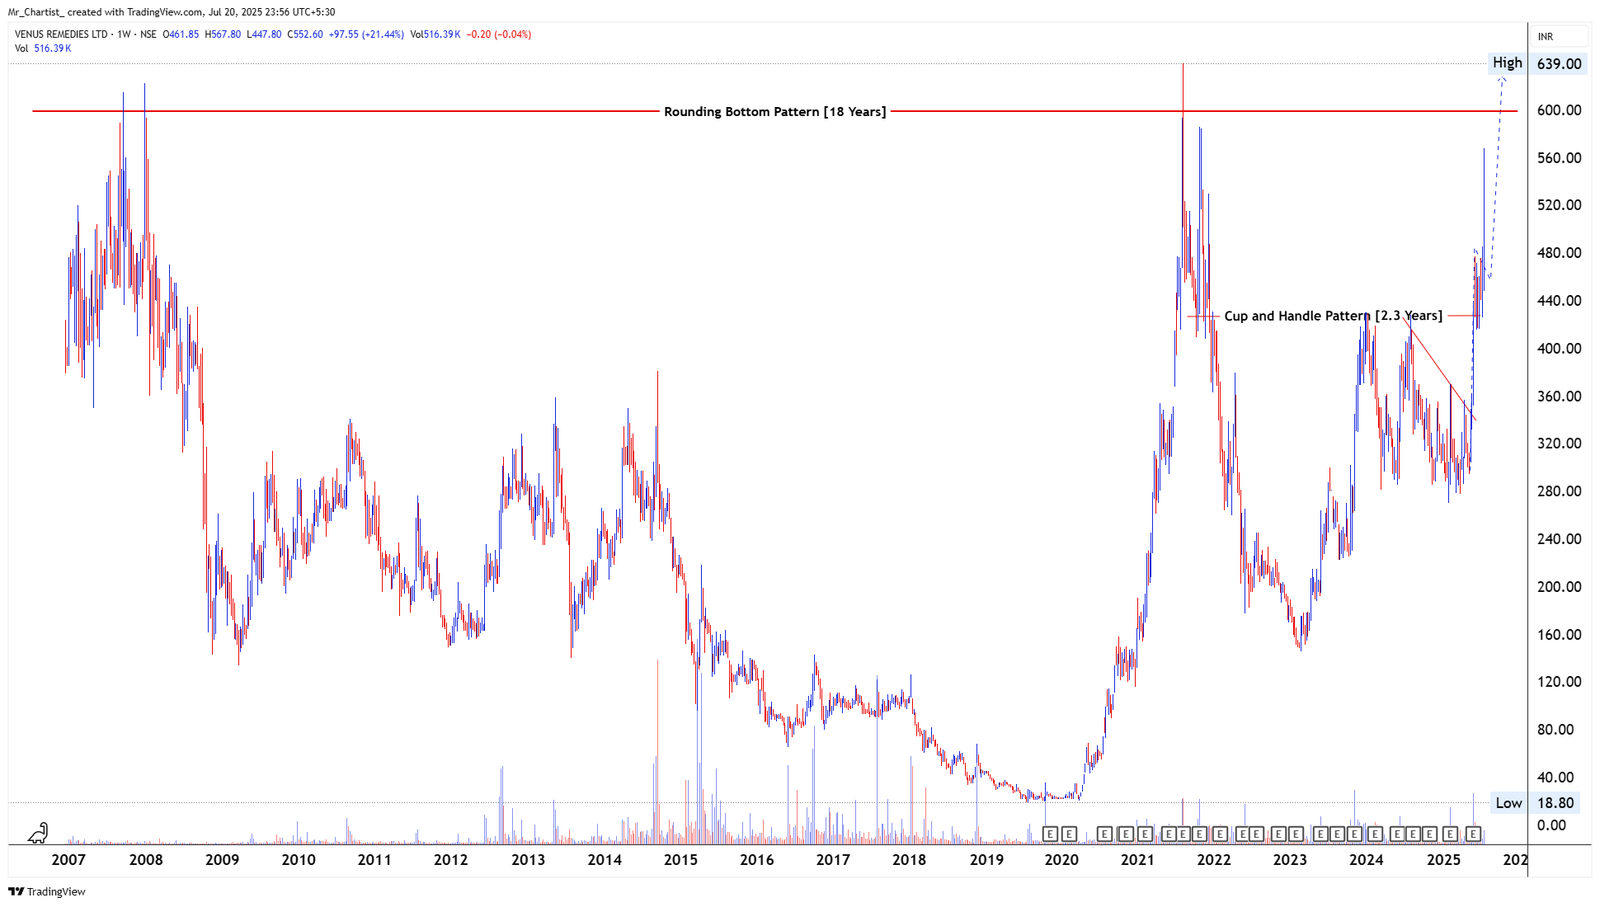
VENUS REMEDIES LTD
bearish fnoRounding Bottom (18 Years – Major Long-Term Reversal)
Daily Chart
Thesis & Analysis
No detailed thesis provided for this setup.
Price Action
- ■Price action is structurally positive.
- ■Forming higher highs and higher lows.
Volume Profile
- ■Volume is supportive of the price action.
- ■Wait for volume expansion on breakout.
Key Levels
No zones specified
No zones specified
Invalidation Scenario
A weekly close below the support level invalidates this structure.
WINSOME TEXTILE INDUSTRIES LTD
bearish fnoDouble Bottom Breakout
Daily Chart
Thesis & Analysis
No detailed thesis provided for this setup.
Price Action
- ■Price action is structurally positive.
- ■Forming higher highs and higher lows.
Volume Profile
- ■Volume is supportive of the price action.
- ■Wait for volume expansion on breakout.
Key Levels
No zones specified
No zones specified
Invalidation Scenario
A weekly close below the support level invalidates this structure.
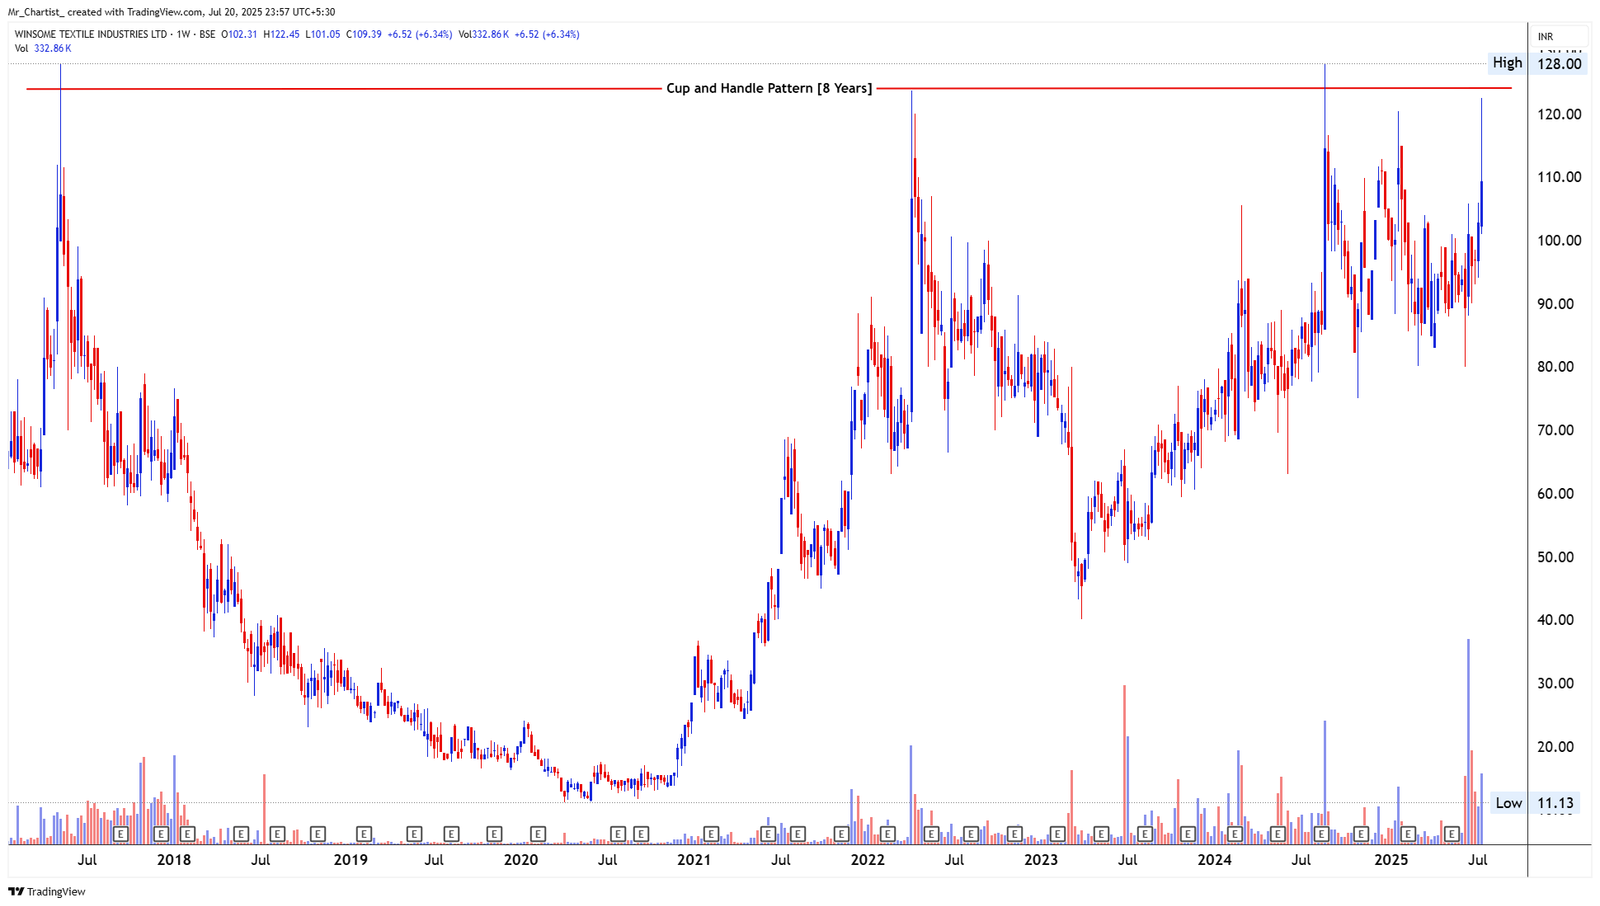
WINSOME TEXTILE INDUSTRIES LTD
bearish fnoCup and Handle
8 Years (Weekly Chart – Long-Term Bullish Structure)
Thesis & Analysis
Winsome Textile is forming a classic 8-year cup and handle pattern, indicating a prolonged consolidation base with a recent bullish tilt. The left side of the cup formed from 2017 to early 2022, followed by a rounded bottom and a structurally clean handle phase over the past 18–20 months. The stock is now approaching the neckline resistance zone, showing renewed bullish strength and steady higher lows. The consolidation has narrowed with volatility compression, supporting the probability of a breakout attempt soon. Candlestick Behavior: The latest weekly candle is a bullish expansion bar closing near its high, showing momentum build-up. Prior candles during the handle were mixed but mostly range-bound, indicating controlled supply. Volume View: Recent volume has started to rise with price, especially over the last few bullish candles— highlighting early accumulation. This volume uptick at the neckline suggests interest is increasing at critical levels. 2. Crucial Support and Resistance Levels Resistance Zones: ₹125–₹128: Cup and handle neckline; major breakout confirmation zone. ₹150+: Psychological and structural extension levels beyond breakout. Support Zones: ₹96–₹98: Handle base support; key for structure integrity. ₹85: Intermediate swing zone from early 2024. ₹70–₹72: Long-term support from cup base formation. Currently, the price is hovering near the breakout point of the long base—a key area where trend resolution is likely. 3. Strategic Trade Scenarios 🔸 Primary Setup – Breakout from 8-Year Cup and Handle If price breaks and sustains above ₹128 on strong volume, it confirms a structural breakout. This would complete the cup and handle and open the path for a long-term trend extension toward ₹150 and beyond. 🔹 Alternate Setup – Pullback Before Breakout If price faces resistance and pulls back, a retest of ₹96–₹98 or even ₹85 is possible. As long as the handle remains intact and above ₹70, the bullish structure holds. This is a classic "base breakout in the making" scenario, with multi-year implications if the neckline is cleared decisively.
Price Action
- ■Price action is structurally positive.
- ■Forming higher highs and higher lows.
Volume Profile
- ■Volume is supportive of the price action.
- ■Wait for volume expansion on breakout.
Key Levels
No zones specified
No zones specified
Invalidation Scenario
A weekly close below the support level invalidates this structure.
Charts to Watch
Setups forming favorable structures
Nifty 50 Index
charts to-watchDouble Bottom Breakout
Daily Chart
Thesis & Analysis
No detailed thesis provided for this setup.
Price Action
- ■Price action is structurally positive.
- ■Forming higher highs and higher lows.
Volume Profile
- ■Volume is supportive of the price action.
- ■Wait for volume expansion on breakout.
Key Levels
No zones specified
No zones specified
Invalidation Scenario
A weekly close below the support level invalidates this structure.
NIFTY 50 INDEX
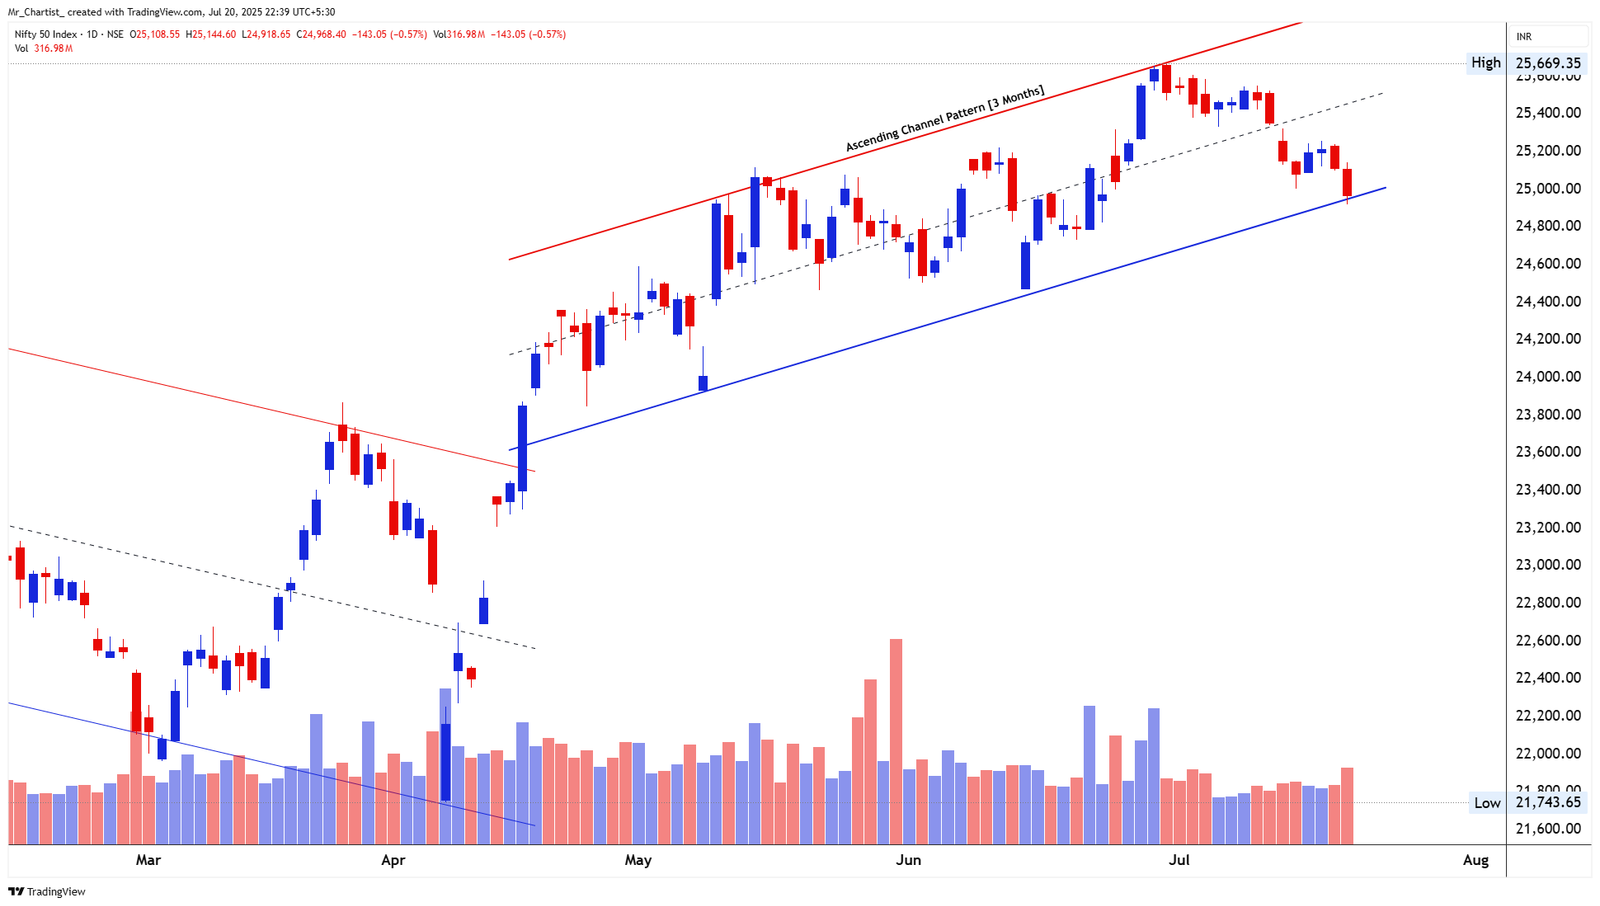
charts to-watchAscending Channel
3 Months (Daily Chart – Ongoing Trend)
Thesis & Analysis
Nifty 50 has been moving inside a rising channel since late April. Both the top and bottom trendlines have been respected well, which shows that the price is moving in a steady, controlled uptrend. The index is now hovering near the lower trendline, which has acted as a launchpad for bounces in past instances. This current setup shows the market is in a pause mode, but still respecting the trend. Unless the price breaks below this channel, the structure remains bullish. Candlestick Behavior: The recent candles near the support zone are small-bodied and tightly ranged, which shows uncertainty but also lack of strong selling. The latest session showed a small intraday bounce from the trendline, a possible early sign of buying interest at support. Volume Analysis: Volume has reduced during this pullback phase, which usually means this is more of a healthy correction than panic selling. Earlier rallies had strong volume participation, especially during early June, which tells us that buyers have been in control for most of the trend. 2. Crucial Support and Resistance Levels Support Zones: 24,850–24,900: Important short-term support from the channel base. Holding this is key to avoid breakdown risk. 24,300: Past breakout zone from May and a solid backup support if the first level fails. 23,800: Previous swing low and deeper support area. Resistance Zones: 25,300: Mid-channel resistance; needs to clear this to shift momentum back up. 25,670: Recent top near the channel's upper edge, tested multiple times. 26,000: Strong psychological resistance; will only come into play if a breakout happens above the current range. 3. Strategic Trade Scenarios 🔸 Primary Setup – Bounce from Channel Support If the index manages to hold above 24,850 and builds strength above 25,200, we could see a recovery attempt toward 25,670, the recent high. A breakout beyond that—especially with good volume—could lead to a fresh move toward 26,000. This scenario favors the bulls only if the support trendline continues to hold and price action improves. 🔹 Alternate Setup – Breakdown Below Channel On the flip side, a decisive breakdown below 24,850 on strong volume could shift the momentum. This would open the door toward 24,300 as the first downside zone. If that doesn’t hold, the structure could weaken further toward 23,800, which is a more important level from a broader trend perspective. This setup would mean the current uptrend is losing steam and may enter a deeper pullback.
Price Action
- ■Price action is structurally positive.
- ■Forming higher highs and higher lows.
Volume Profile
- ■Volume is supportive of the price action.
- ■Wait for volume expansion on breakout.
Key Levels
No zones specified
No zones specified
Invalidation Scenario
A weekly close below the support level invalidates this structure.
Nifty Pharma Index
charts to-watchDouble Bottom Breakout
Daily Chart
Thesis & Analysis
No detailed thesis provided for this setup.
Price Action
- ■Price action is structurally positive.
- ■Forming higher highs and higher lows.
Volume Profile
- ■Volume is supportive of the price action.
- ■Wait for volume expansion on breakout.
Key Levels
No zones specified
No zones specified
Invalidation Scenario
A weekly close below the support level invalidates this structure.
NIFTY PHARMA INDEX
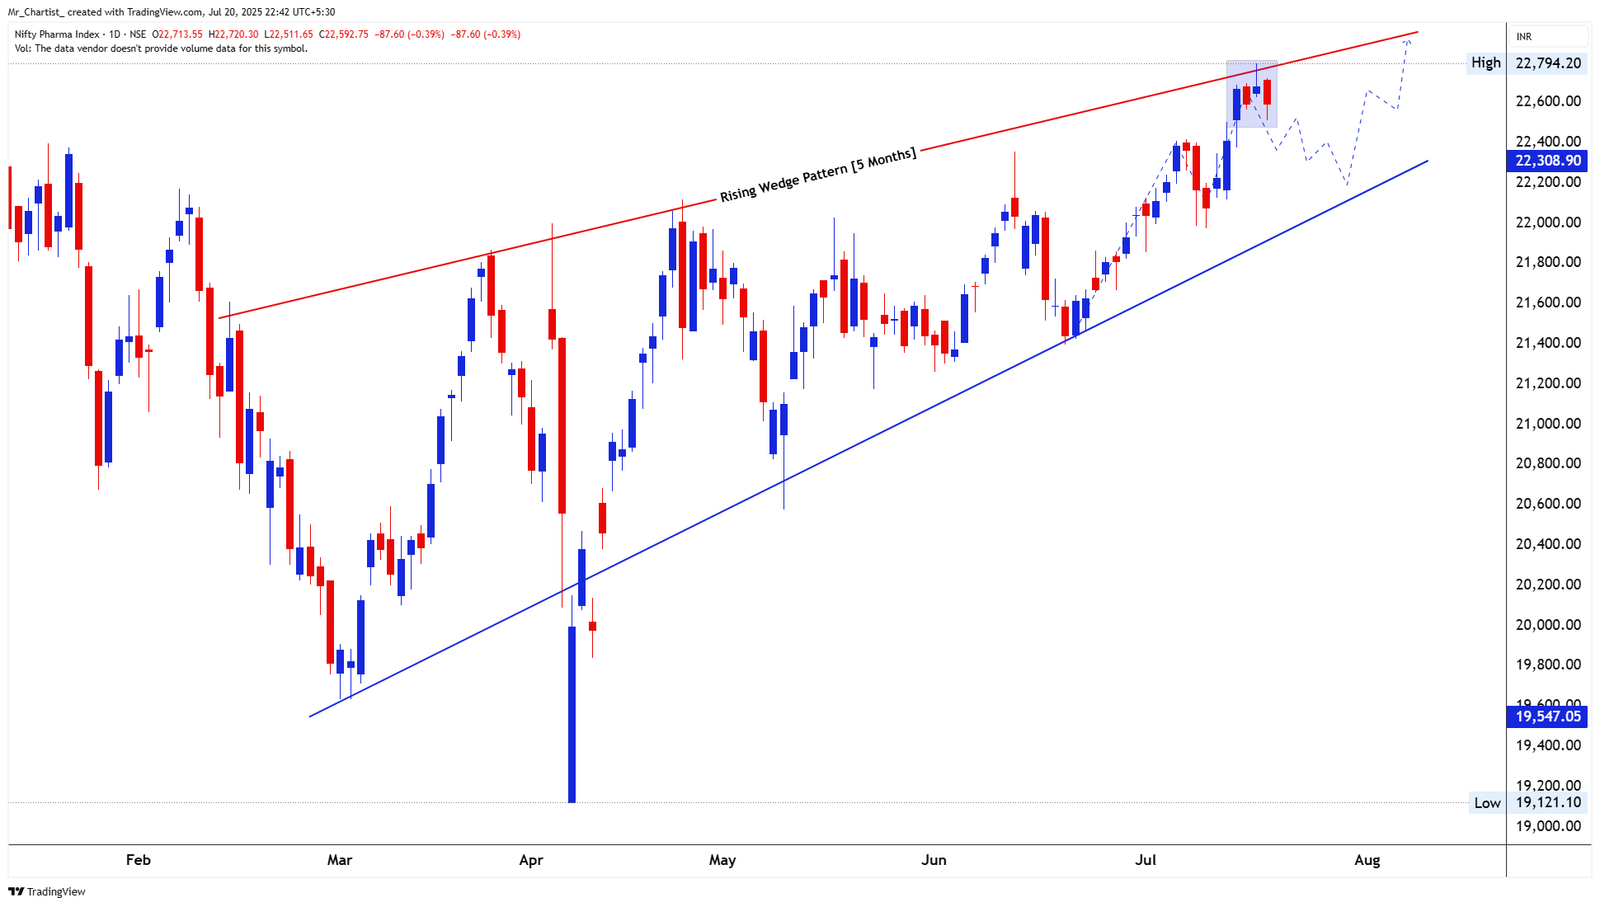
charts to-watchRising Wedge
5 Months (Daily Chart – Gradual Climb with Tightening Range)
Thesis & Analysis
The Nifty Pharma Index is currently moving inside a rising wedge pattern, which has been forming over the last five months. This structure shows a gradual upward move, but with price ranges narrowing as the index approaches the wedge resistance. The index recently touched the upper boundary of the wedge, where it is now facing resistance and showing some hesitation. This setup is typically a warning sign that the upside momentum is slowing down. The price has already reacted slightly from the top, forming a few small-bodied candles and a minor pullback. Candlestick Behavior: The recent candles near the top of the wedge are tight and indecisive, with small bodies and occasional upper wicks—showing some supply pressure. However, no major reversal candle has formed yet. 2. Crucial Support and Resistance Levels Support Zones: 22,300–22,400: Immediate short-term support within the wedge. 21,800: Midline support of the wedge structure. 20,800–21,000: Key swing low from June; breakdown target if wedge fails. Resistance Zones: 22,700–22,800: Upper wedge boundary; multiple rejections seen here. 22,950–23,000: Potential breakout target above the wedge. 23,600+: Longer-term open sky level if strong breakout happens. 3. Strategic Trade Scenarios 🔸 Primary Setup – Watch for Breakout Above Wedge If the index manages to break and close above 22,800 with strong follow-through, we could see a fresh rally toward 23,000–23,600. This would signal that the wedge has resolved positively. 🔹 Alternate Setup – Breakdown Risk from Wedge If price fails to hold above 22,300 and closes below the wedge support line, it could trigger a correction toward 21,800 or even 20,800 in the coming days. At this stage, the index is trading at a decision point—right near the wedge top—so upcoming candles will be key to confirm the next direction.
Price Action
- ■Price action is structurally positive.
- ■Forming higher highs and higher lows.
Volume Profile
- ■Volume is supportive of the price action.
- ■Wait for volume expansion on breakout.
Key Levels
No zones specified
No zones specified
Invalidation Scenario
A weekly close below the support level invalidates this structure.
Nifty MidCap 100 Index
charts to-watchDouble Bottom Breakout
Daily Chart
Thesis & Analysis
No detailed thesis provided for this setup.
Price Action
- ■Price action is structurally positive.
- ■Forming higher highs and higher lows.
Volume Profile
- ■Volume is supportive of the price action.
- ■Wait for volume expansion on breakout.
Key Levels
No zones specified
No zones specified
Invalidation Scenario
A weekly close below the support level invalidates this structure.
NIFTY MIDCAP 100 INDEX
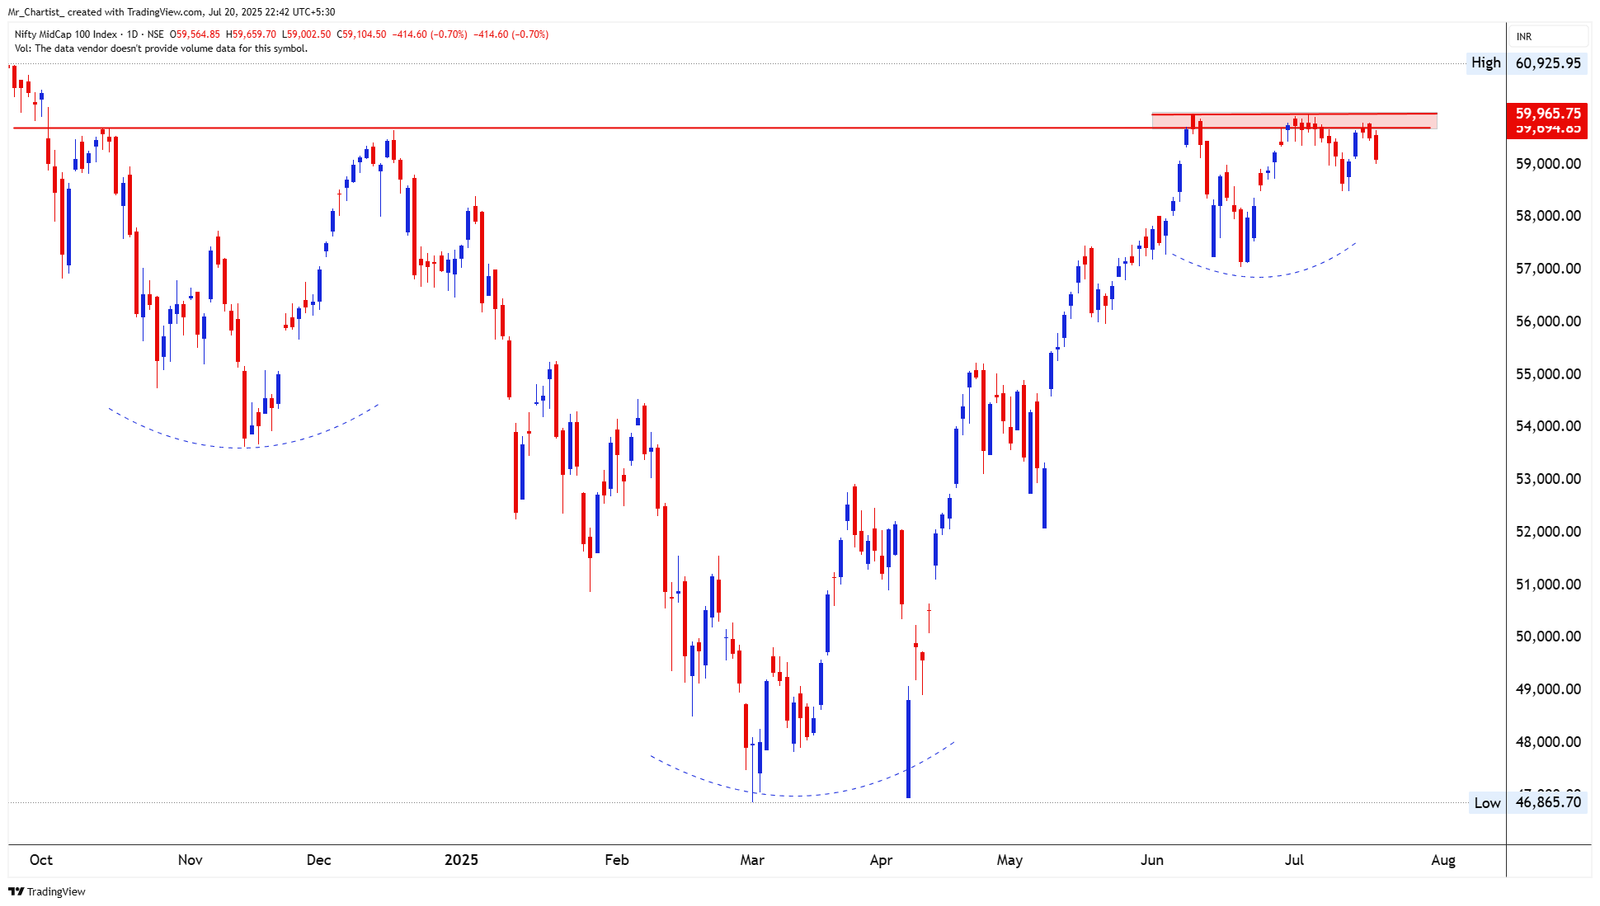
charts to-watchInverted Head and Shoulder (Long-Term)
Daily Chart
Thesis & Analysis
No detailed thesis provided for this setup.
Price Action
- ■Price action is structurally positive.
- ■Forming higher highs and higher lows.
Volume Profile
- ■Volume is supportive of the price action.
- ■Wait for volume expansion on breakout.
Key Levels
No zones specified
No zones specified
Invalidation Scenario
A weekly close below the support level invalidates this structure.
Nifty Metal Index
charts to-watchDouble Bottom Breakout
Daily Chart
Thesis & Analysis
No detailed thesis provided for this setup.
Price Action
- ■Price action is structurally positive.
- ■Forming higher highs and higher lows.
Volume Profile
- ■Volume is supportive of the price action.
- ■Wait for volume expansion on breakout.
Key Levels
No zones specified
No zones specified
Invalidation Scenario
A weekly close below the support level invalidates this structure.
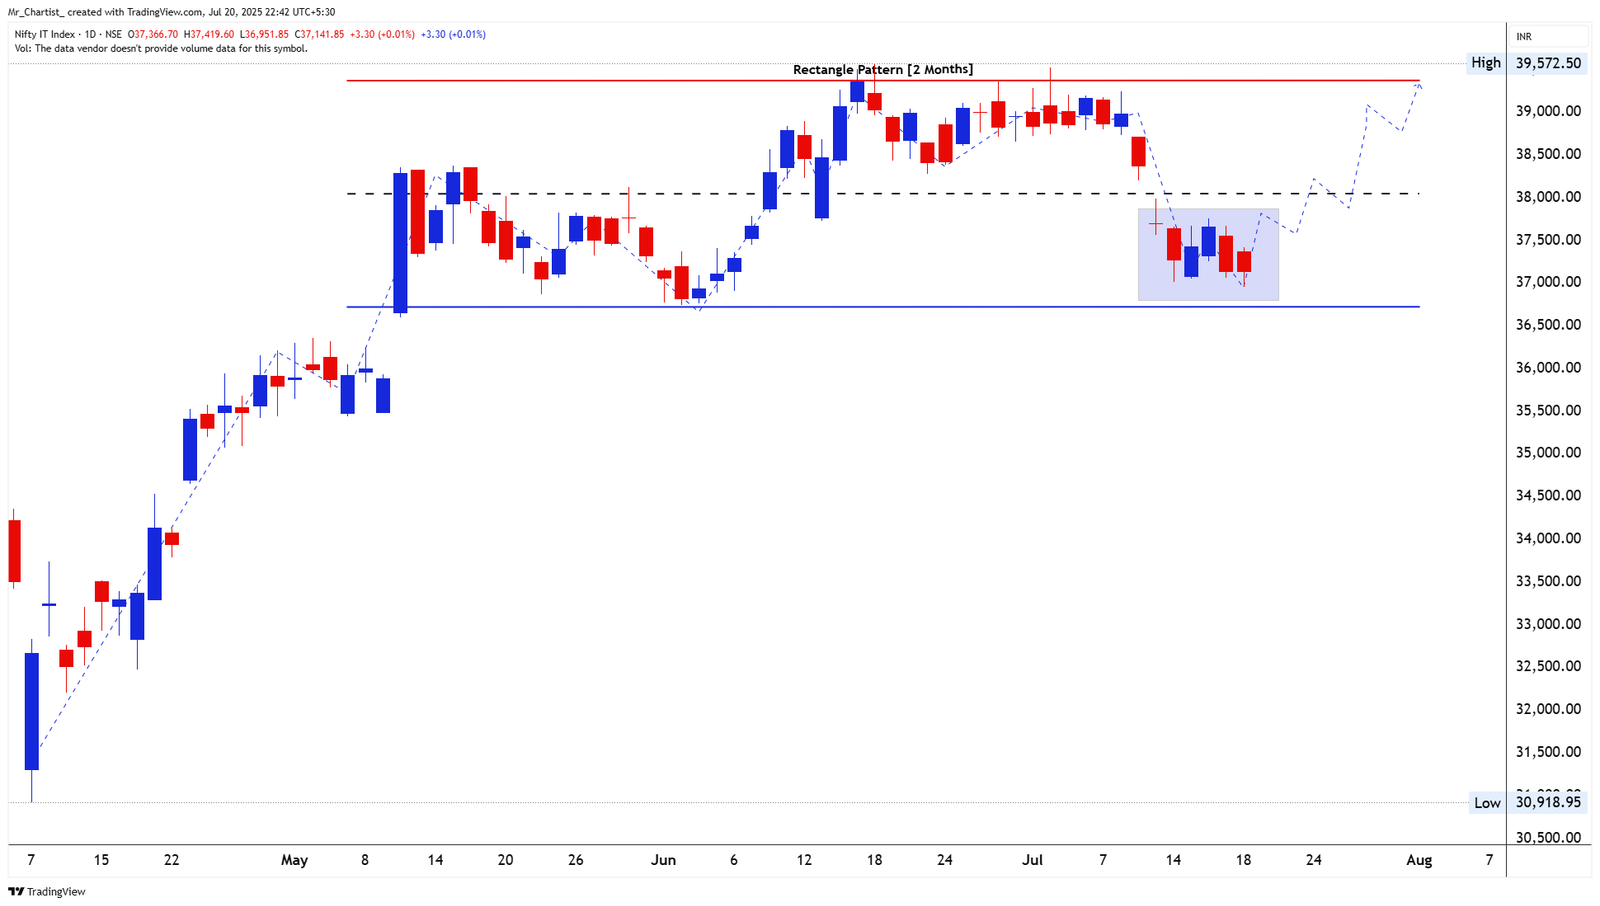
NIFTY METAL INDEX
charts to-watchRising Wedge
3 Months (Daily Chart – Trend Continuation Setup)
Thesis & Analysis
The Nifty Metal Index is trading inside a rising wedge pattern, which has been developing for the last 3 months. Both the upper and lower trendlines are upward sloping, with price moving closer to the upper boundary, showing a steady climb with occasional short consolidations. Most recently, the index pulled back slightly but held the lower wedge support well. It has now started forming higher lows again, suggesting strength is building up once more inside the wedge. Candlestick Behavior: Recent candles are showing a rounding base formation near the wedge support line. Price has bounced back with a few strong blue candles, signaling that buyers are stepping in on dips. 2. Crucial Support and Resistance Levels Support Zones: 9,300–9,350: Immediate trendline support within the wedge. 9,000: Psychological and structural support from past bounces. 8,600: Base of the wedge; deeper support if breakdown happens. Resistance Zones: 9,600–9,650: Minor supply zone within the wedge. 9,780: Upper wedge boundary and recent high. 9,900–10,000: Possible breakout target if wedge breaks on the upside. 3. Strategic Trade Scenarios 🔸 Primary Setup – Trend Continuation Within Wedge As long as price holds above the rising trendline near 9,300, the index may continue drifting higher toward 9,650 and 9,780. A breakout above 9,800 would confirm a strong upside move, with targets near 10,000. 🔹 Alternate Setup – Breakdown Risk from Wedge If price fails to hold above the trendline and breaks below 9,300, we may see a pullback toward 9,000, or even 8,600 if selling picks up. This would also signal a wedge failure and potential reversal. Right now, the index is rebounding within the wedge, and the next move depends on whether it breaks above recent highs or loses the lower support again.
Price Action
- ■Price action is structurally positive.
- ■Forming higher highs and higher lows.
Volume Profile
- ■Volume is supportive of the price action.
- ■Wait for volume expansion on breakout.
Key Levels
No zones specified
No zones specified
Invalidation Scenario
A weekly close below the support level invalidates this structure.
Nifty IT Index
charts to-watchDouble Bottom Breakout
Daily Chart
Thesis & Analysis
No detailed thesis provided for this setup.
Price Action
- ■Price action is structurally positive.
- ■Forming higher highs and higher lows.
Volume Profile
- ■Volume is supportive of the price action.
- ■Wait for volume expansion on breakout.
Key Levels
No zones specified
No zones specified
Invalidation Scenario
A weekly close below the support level invalidates this structure.
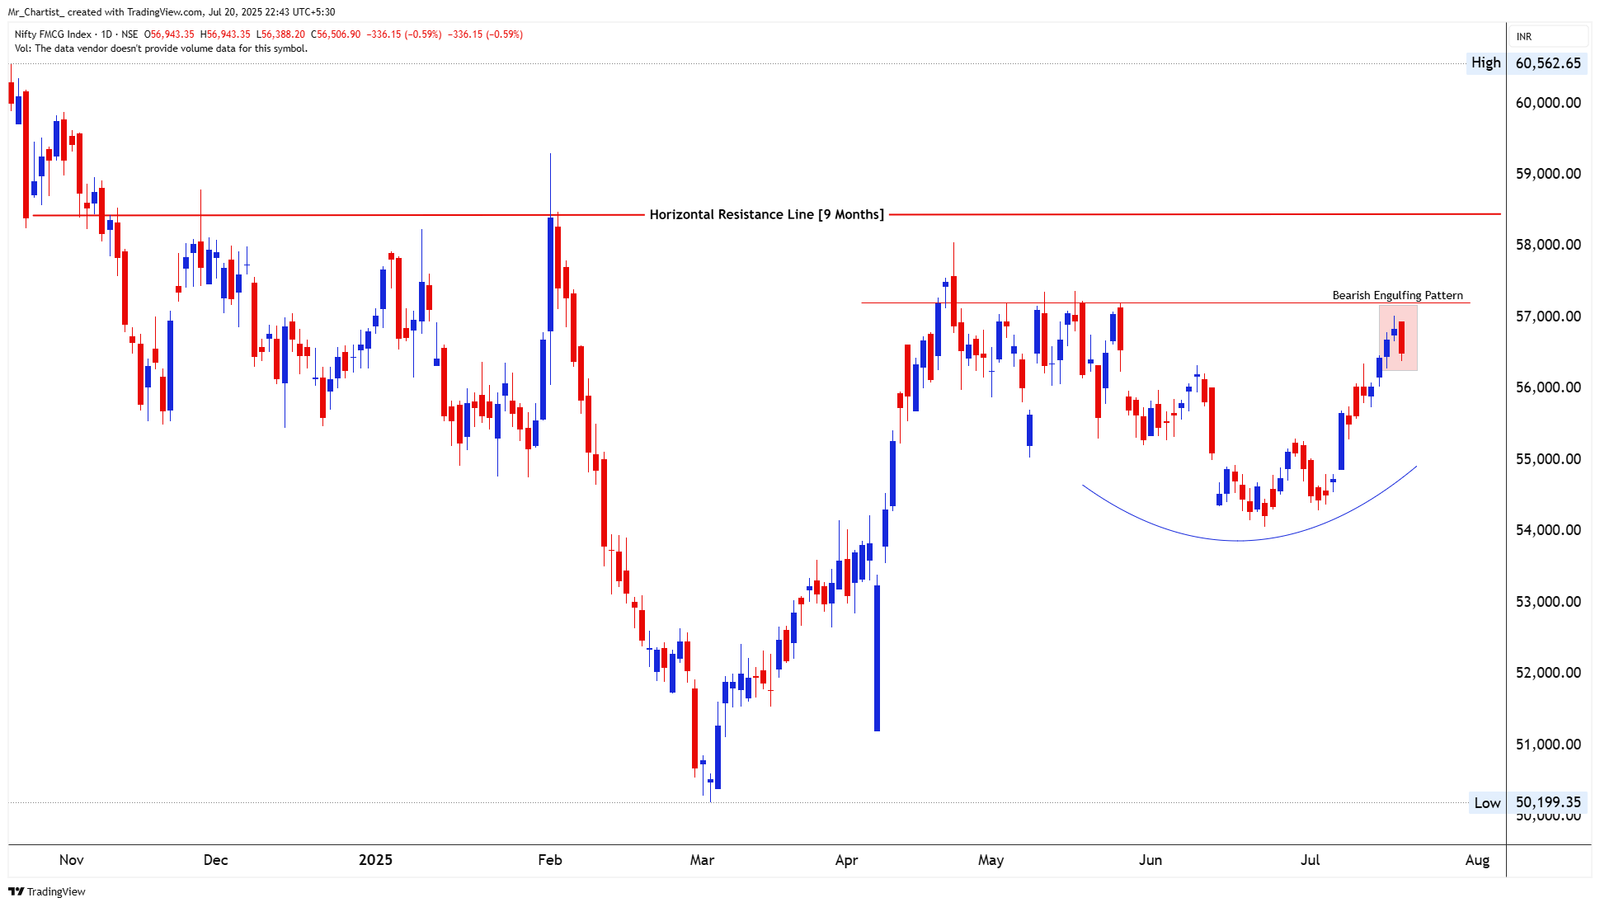
NIFTY IT INDEX
charts to-watchRectangle Pattern
2 Months (Daily Chart – Sideways Range)
Thesis & Analysis
The Nifty IT Index has been trading inside a rectangle pattern for the past 2 months. The support is near 36,900 and resistance is at 39,570. Price is currently trading inside a tight lower range box after facing repeated rejections from the top. This kind of rectangle formation usually signals a consolidation zone, where the market is taking a breather before the next move. The recent candles show the index is trying to hold above the support level once again. Candlestick Behavior: The last few candles are forming near the lower end of the range with small bodies, showing indecision but also signs of base-building. A bounce is possible if this level holds. 2. Crucial Support and Resistance Levels Support Zones: 36,900: Key rectangle support; tested multiple times. 36,300–36,500: Buffer support below the range. 35,000: Long-term trend support (only relevant if breakdown extends). Resistance Zones: 38,400: Mid-range horizontal level; near-term barrier. 39,570: Rectangle resistance and recent swing high. 40,200+: Potential breakout target if range breaks upward. 3. Strategic Trade Scenarios 🔸 Primary Setup – Range Bounce and Breakout Watch If price continues to hold above 36,900 and crosses back above 38,400, it can reattempt 39,570. A breakout above the rectangle top could lead to a strong move toward 40,200+. 🔹 Alternate Setup – Breakdown from Range If price breaks below 36,900 and sustains below it, the rectangle will break on the downside. This could drag the index toward 36,300, and possibly deeper if weakness continues. Right now, the index is sitting near the bottom of the range, and next few candles will be crucial to confirm if a reversal is building or breakdown is coming.
Price Action
- ■Price action is structurally positive.
- ■Forming higher highs and higher lows.
Volume Profile
- ■Volume is supportive of the price action.
- ■Wait for volume expansion on breakout.
Key Levels
No zones specified
No zones specified
Invalidation Scenario
A weekly close below the support level invalidates this structure.
Nifty FMCG Index
charts to-watchDouble Bottom Breakout
Daily Chart
Thesis & Analysis
No detailed thesis provided for this setup.
Price Action
- ■Price action is structurally positive.
- ■Forming higher highs and higher lows.
Volume Profile
- ■Volume is supportive of the price action.
- ■Wait for volume expansion on breakout.
Key Levels
No zones specified
No zones specified
Invalidation Scenario
A weekly close below the support level invalidates this structure.
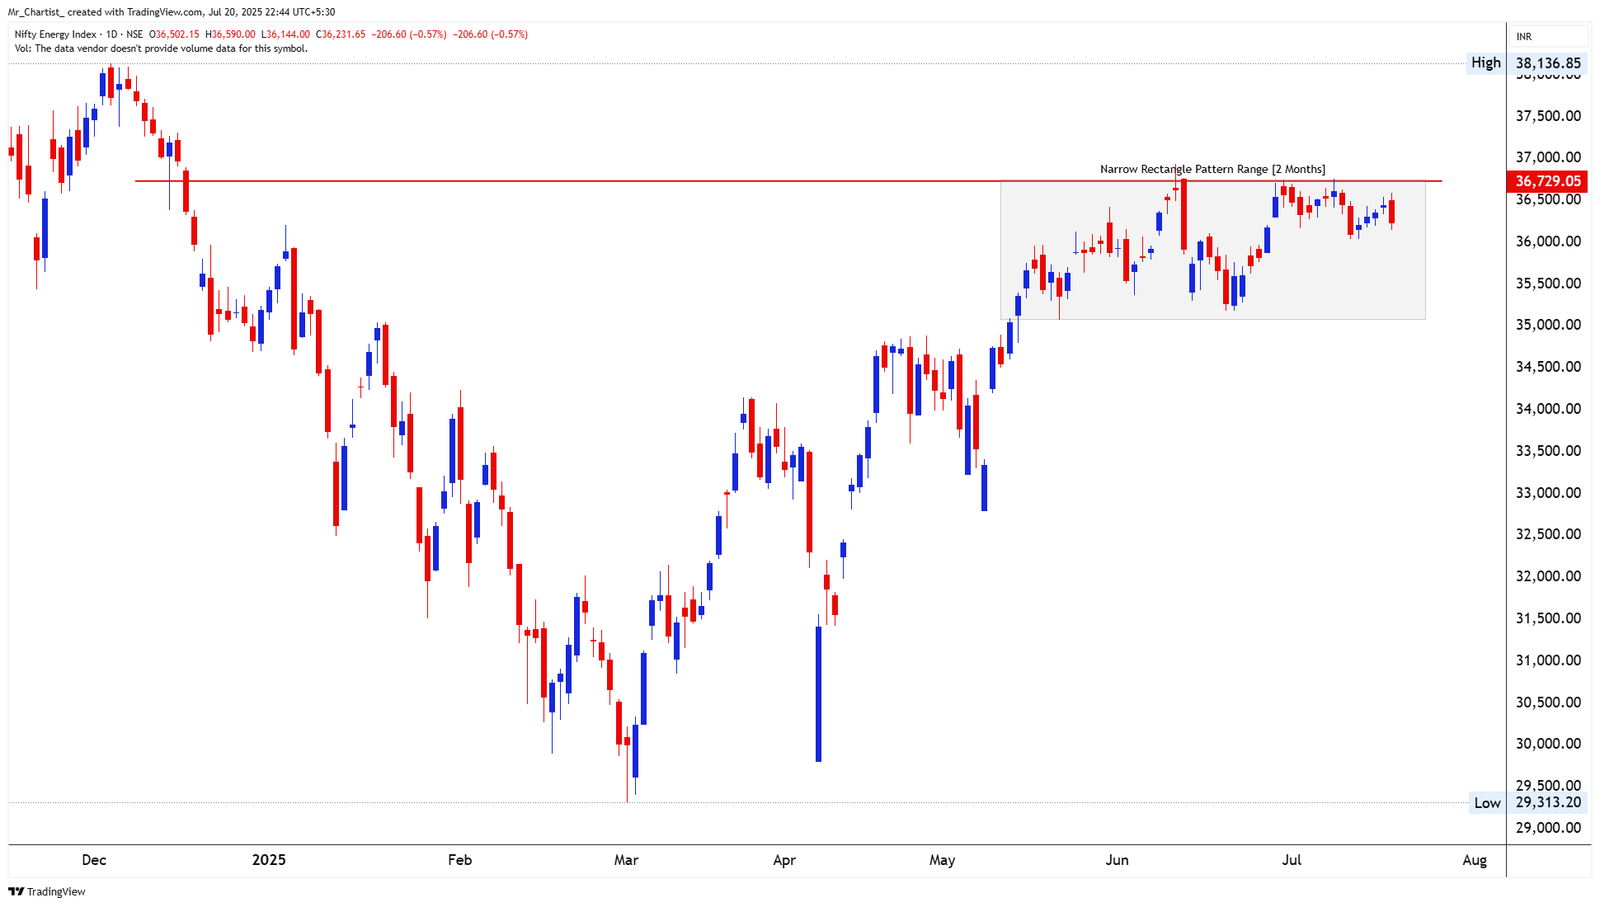
NIFTY FMCG INDEX
charts to-watchDouble Bottom Breakout
9 Months (Daily Chart – Long-Term Structure)
Thesis & Analysis
The Nifty FMCG Index is facing a strong horizontal resistance near the 57,000 mark, which has held firm for the past 9 months. The price recently completed a rounded base and approached this resistance zone, but is now showing signs of rejection. In the latest session, the index formed a Bearish Engulfing candle right at resistance, which suggests a possible short-term reversal or pause. This is the third rejection from the same level, which adds more weight to this resistance zone. Candlestick Behavior: The recent bearish engulfing candle shows clear selling interest at the top. This formation after a sharp rally adds to the caution, especially with no breakout confirmation yet. 2. Crucial Support and Resistance Levels Resistance Zones: 57,000: Major horizontal resistance (9-month range top). 58,000–58,500: Only relevant if breakout happens. 60,562: 52-week high level. Support Zones: 55,800–56,000: Minor support from recent swing. 54,200: Base of the recent rounded structure. 52,800: Medium-term cushion if broader correction happens. 3. Strategic Trade Scenarios 🔸 Primary Setup – Resistance Rejection With the bearish engulfing pattern forming right at 57,000, we may see a pullback toward 55,800 or even 54,200 if follow-through weakness continues. This scenario remains active unless the price closes strongly above the resistance. 🔹 Alternate Setup – Bullish Breakout If price manages to reclaim 57,000 and gives a clean daily close above it, this long-standing range will finally break. In that case, 58,500 and even 60,000+ could be the next zones to watch. For now, the index remains in a range-bound zone, and the latest candle hints at a short-term pause or dip.
Price Action
- ■Price action is structurally positive.
- ■Forming higher highs and higher lows.
Volume Profile
- ■Volume is supportive of the price action.
- ■Wait for volume expansion on breakout.
Key Levels
No zones specified
No zones specified
Invalidation Scenario
A weekly close below the support level invalidates this structure.
Nifty Energy Index
charts to-watchDouble Bottom Breakout
Daily Chart
Thesis & Analysis
No detailed thesis provided for this setup.
Price Action
- ■Price action is structurally positive.
- ■Forming higher highs and higher lows.
Volume Profile
- ■Volume is supportive of the price action.
- ■Wait for volume expansion on breakout.
Key Levels
No zones specified
No zones specified
Invalidation Scenario
A weekly close below the support level invalidates this structure.
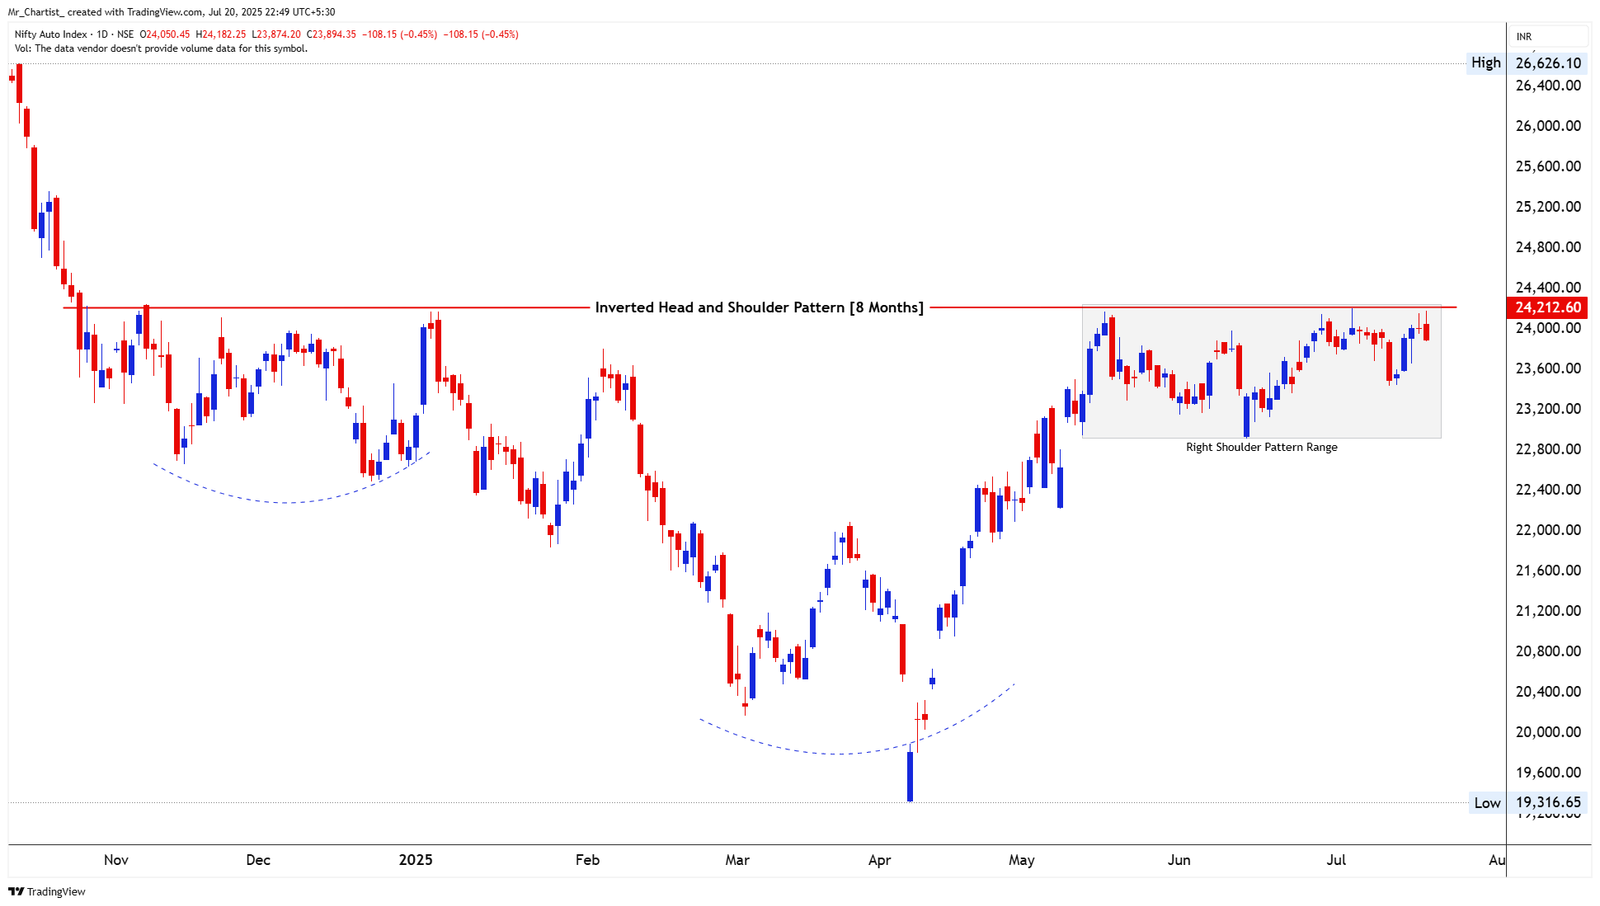
NIFTY ENERGY INDEX
charts to-watchNarrow Rectangle Range
2 Months (Daily Chart – Sideways Consolidation)
Thesis & Analysis
The Nifty Energy Index has been moving inside a tight rectangle range for the last two months. The range is clearly defined between approximately 35,500 support and 36,700 resistance, with price currently fluctuating near the upper part of this zone. Despite multiple attempts, the index has not managed to close above the 36,700 level, showing that strong sellers are active there. This pattern usually reflects a pause in trend, where the market is waiting for a trigger before the next directional move. Candlestick Behavior: Recent candles are choppy and overlapping, typical of consolidation. Price is stuck in a narrow band and hasn’t shown strong bullish or bearish conviction yet. 2. Crucial Support and Resistance Levels Resistance Zones: 36,700–36,800: Rectangle top; index has failed here multiple times. 38,100: If breakout happens, this becomes the next possible target. 39,000+: Open sky zone if strong follow-through comes in. Support Zones: 35,500–35,600: Strong rectangle base support. 34,300: Prior swing low and safety cushion in case of breakdown. 32,800: Medium-term support from April base. 3. Strategic Trade Scenarios 🔸 Primary Setup – Breakout Watch If the index closes above 36,700, the rectangle breakout will activate. This can lead to a rally toward 38,100, and possibly beyond. A strong bullish candle with follow-through would confirm the setup. 🔹 Alternate Setup – Breakdown from Range If price drops below 35,500 and sustains, it could trigger a correction phase toward 34,300 or even 32,800. This would mean sellers have taken control, and the range has broken on the downside. Right now, the index is stuck inside a 2-month narrow range, and a decisive move is still awaited.
Price Action
- ■Price action is structurally positive.
- ■Forming higher highs and higher lows.
Volume Profile
- ■Volume is supportive of the price action.
- ■Wait for volume expansion on breakout.
Key Levels
No zones specified
No zones specified
Invalidation Scenario
A weekly close below the support level invalidates this structure.
Nifty Auto Index
charts to-watchDouble Bottom Breakout
Daily Chart
Thesis & Analysis
No detailed thesis provided for this setup.
Price Action
- ■Price action is structurally positive.
- ■Forming higher highs and higher lows.
Volume Profile
- ■Volume is supportive of the price action.
- ■Wait for volume expansion on breakout.
Key Levels
No zones specified
No zones specified
Invalidation Scenario
A weekly close below the support level invalidates this structure.
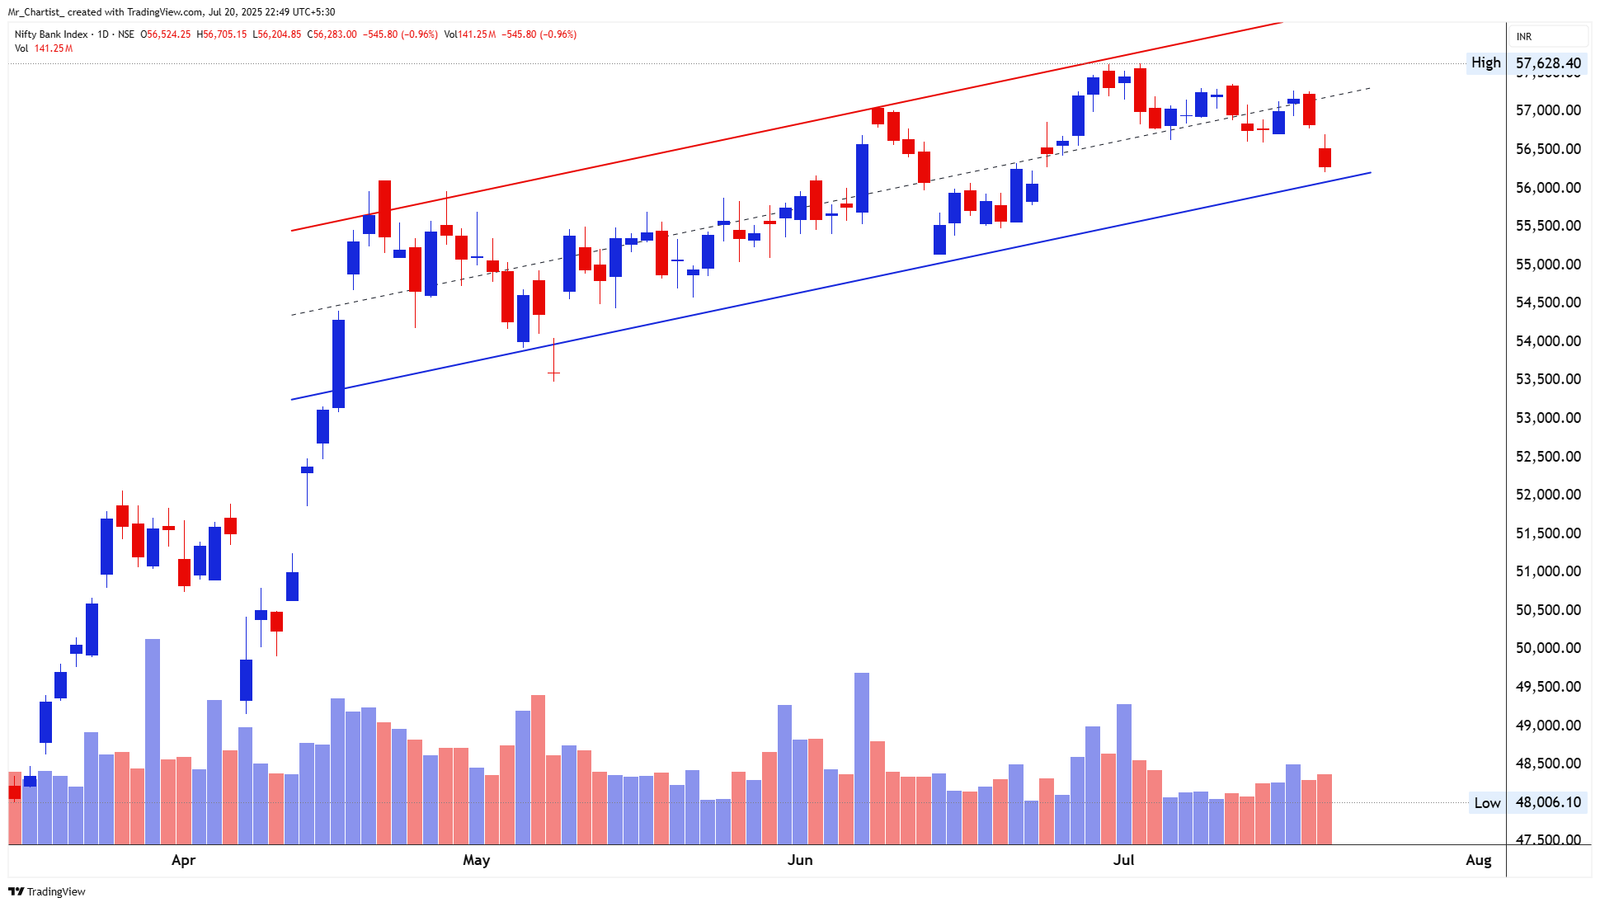
NIFTY AUTO INDEX
charts to-watchInverted Head and Shoulder
8 Months (Daily Chart – Medium-Term Reversal Structure)
Thesis & Analysis
The Nifty Auto Index has formed a classic Inverted Head and Shoulder (IHS) pattern over the past 8 months. The left shoulder was formed in Nov–Dec 2024, the head in Feb–Apr 2025, and the right shoulder has been developing inside a horizontal range since May. The neckline of the pattern is marked around 24,200, which the index is currently testing again. This is a key resistance zone that has been touched multiple times in the past few weeks—indicating building breakout pressure. Candlestick Behavior: The recent candles are small-bodied and consolidating near the neckline, showing hesitation, but no strong rejection yet. This signals that the market is waiting for a trigger to confirm the next move. 2. Crucial Support and Resistance Levels Resistance Zones: 24,200–24,250: Key neckline zone; current breakout level. 25,500: Projected target if IHS pattern confirms. 26,600: Medium-to-long term breakout target. Support Zones: 23,200–23,300: Right shoulder range support. 22,500: Structure support below the shoulder. 21,000: Head bottom zone; must hold for pattern validity. 3. Strategic Trade Scenarios 🔸 Primary Setup – Bullish Breakout Trigger Watch If the index gives a strong daily close above 24,250, it would confirm the breakout from this 8-month-long base. This can trigger a move toward 25,500 and possibly 26,600+ in the coming weeks. 🔹 Alternate Setup – Rejection from Neckline If the index fails to break out and slips back below 23,200, the right shoulder zone could weaken. A fall below this level might drag the index toward 22,500, delaying the breakout and adding pressure to the pattern. Currently, the index is hovering right at the neckline, making this a decisive level for the pattern to confirm or fail.
Price Action
- ■Price action is structurally positive.
- ■Forming higher highs and higher lows.
Volume Profile
- ■Volume is supportive of the price action.
- ■Wait for volume expansion on breakout.
Key Levels
No zones specified
No zones specified
Invalidation Scenario
A weekly close below the support level invalidates this structure.
Nifty Bank Index
charts to-watchDouble Bottom Breakout
Daily Chart
Thesis & Analysis
No detailed thesis provided for this setup.
Price Action
- ■Price action is structurally positive.
- ■Forming higher highs and higher lows.
Volume Profile
- ■Volume is supportive of the price action.
- ■Wait for volume expansion on breakout.
Key Levels
No zones specified
No zones specified
Invalidation Scenario
A weekly close below the support level invalidates this structure.
Chart Image Not Extracted
NIFTY BANK INDEX
charts to-watchAscending Channel
3.5 Months (Daily Chart – Trend Continuation)
Thesis & Analysis
The Nifty Bank Index has been trading inside an ascending channel since early April. Price has steadily followed the upper and lower boundaries of the channel, making higher highs and higher lows throughout this period. Currently, the index is approaching the lower trendline support of the channel after a recent 4-day decline. The last candle is a strong bearish bar, closing near the lower edge of the structure, suggesting that the next few sessions will be crucial to determine whether this level holds. Candlestick Behavior: The recent candles show increased selling pressure, with the last session clearly breaking the mid-channel support and heading toward the lower band. There’s been no strong reversal candle yet, keeping the short-term bias weak. 2. Crucial Support and Resistance Levels Support Zones: 56,000–56,100: Immediate support at the lower channel line. 55,000: Psychological and structural support from May. 53,500: April swing support; major level if breakdown happens. Resistance Zones: 57,000: Mid-channel level; now flipped to minor resistance. 57,600–57,800: Channel top and recent high. 58,500: Possible breakout extension zone if strength returns. 3. Strategic Trade Scenarios 🔸 Primary Setup – Support Test at Channel Base If price manages to hold above 56,000 and forms a bullish reversal candle, a rebound toward 57,000 and possibly 57,600 can be expected. This would keep the uptrend inside the channel alive. 🔹 Alternate Setup – Breakdown Below Channel If the index breaks and closes below 56,000 with strong volume, it could lead to a breakdown from the channel. In that case, the index may slide toward 55,000, and further downside toward 53,500 could follow if weakness continues. As of now, the index is resting right at key support, and next move will decide whether bulls defend the trend or sellers take over.
Price Action
- ■Price action is structurally positive.
- ■Forming higher highs and higher lows.
Volume Profile
- ■Volume is supportive of the price action.
- ■Wait for volume expansion on breakout.
Key Levels
No zones specified
No zones specified
Invalidation Scenario
A weekly close below the support level invalidates this structure.
SEBI Registered Research Analyst — INH000015297 (INVESTOLOGY). Investment in securities market are subject to market risks. Read all related documents carefully before investing. The content provided is for educational purposes only and should not be considered as financial advice. Past performance is not indicative of future results.