Coming Soon
The Weekend Visual ChartBook is currently undergoing a massive upgrade. Stay tuned for a world-class reading experience.
Return HomeWeekend Visual ChartBook
Edition #274
Extracted Edition
Market Pulse
LiveReal-time index prices above. Detailed index chart analysis below in the Indices section.
Charts to Watch
Setups forming favorable structures
Nifty 50 Index
charts to-watchDouble Bottom Breakout
Daily Chart
Thesis & Analysis
No detailed thesis provided for this setup.
Price Action
- ■Price action is structurally positive.
- ■Forming higher highs and higher lows.
Volume Profile
- ■Volume is supportive of the price action.
- ■Wait for volume expansion on breakout.
Key Levels
No zones specified
No zones specified
Invalidation Scenario
A weekly close below the support level invalidates this structure.
NIFTY 50 INDEX
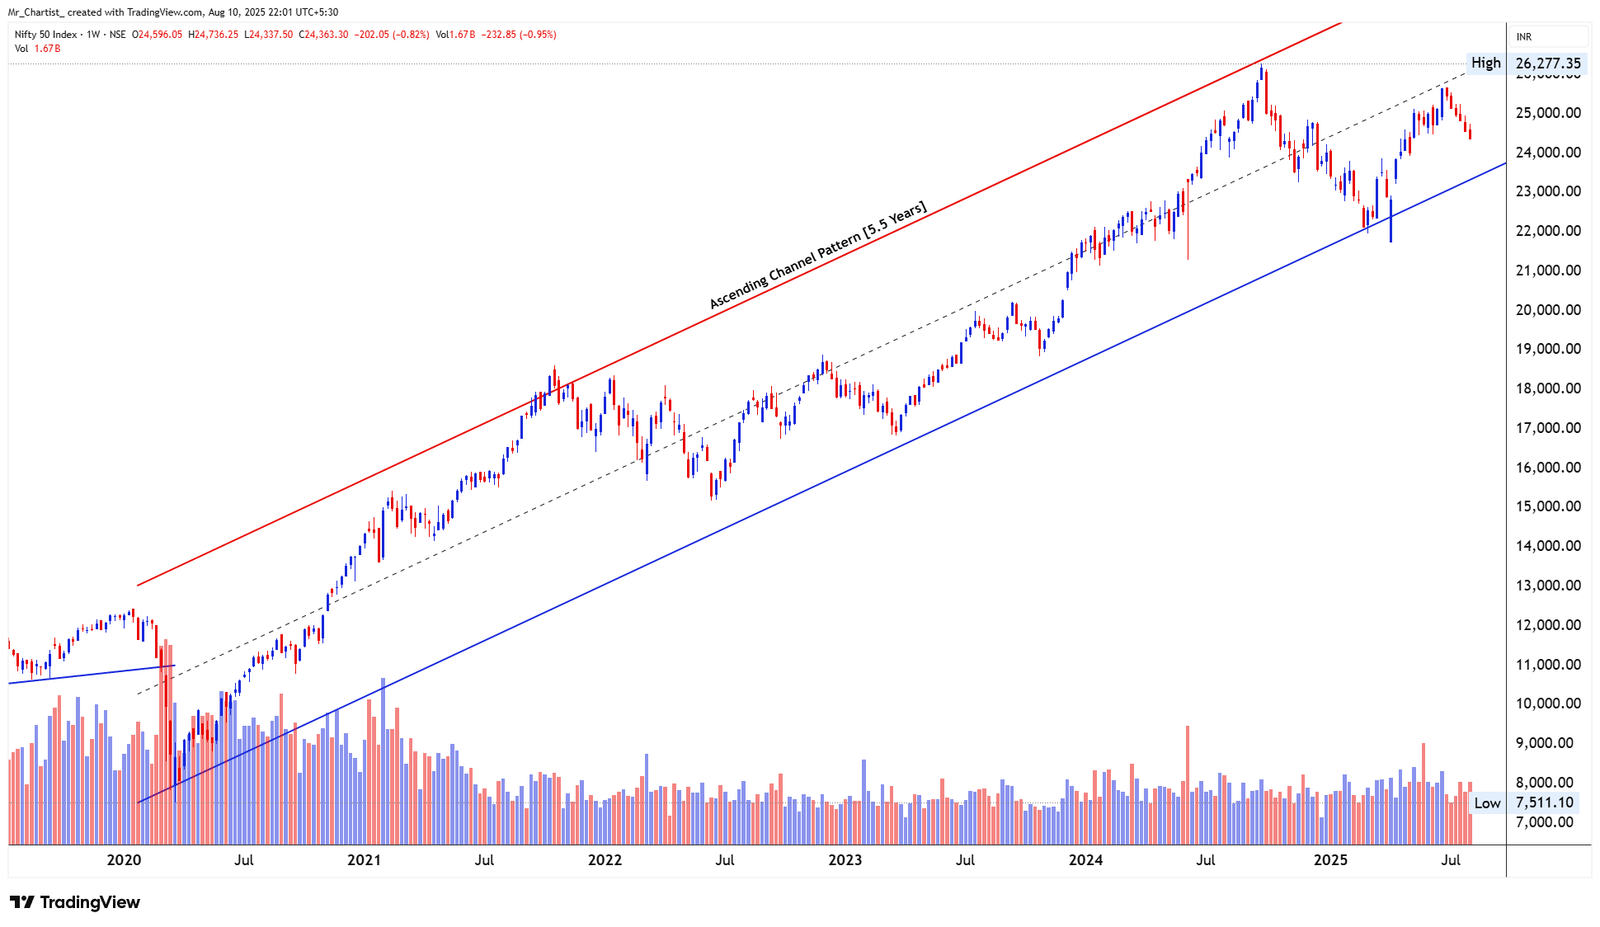
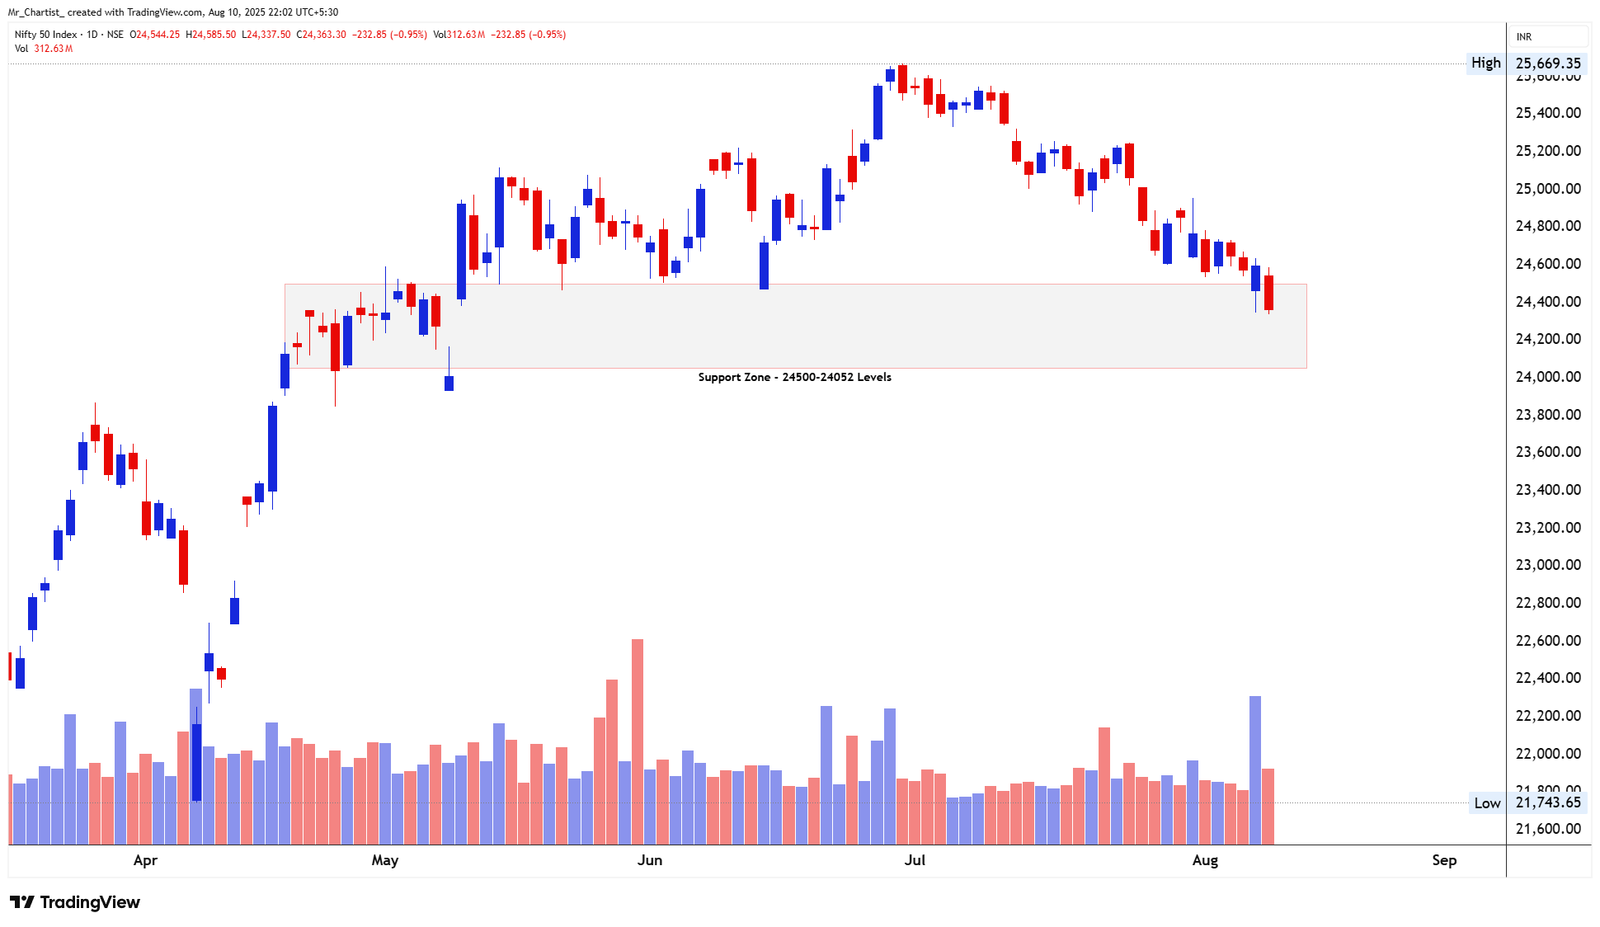
charts to-watchLong-term Ascending Channel (Weekly) + Short-term Horizontal Support
Weekly (5.5 Years) & Daily (3 Months – Sideways Phase)
Thesis & Analysis
Nifty 50 has been moving inside a steady rising channel for over 5 years. This channel has guided the long-term uptrend, with the upper and lower boundaries respected multiple times. Recently, the index touched the midline resistance of this channel and started to drift lower. Now, the price is approaching a key weekly support area near 24,000, which has historically acted as a springboard for upward moves. On the daily chart, the story zooms in on a horizontal support zone between 24,500 and 24,052. Price has been trapped here for the past few weeks, testing the lower boundary more frequently. This tells us that buyers are struggling to push the price higher and sellers are slowly gaining ground. Unless the price breaks and closes below 24,000, the long-term uptrend is still intact. But if this level gives way, we could see a much deeper fall in the coming weeks. Candlestick Behavior: On the weekly chart, recent candles have small bodies, showing the market is pausing before deciding its next big move. On the daily chart, candles near support often have upper shadows — meaning sellers are active whenever price tries to bounce. No strong bullish reversal candle has appeared yet, so buyers still need to prove they’re in control. Volume Analysis: Down days are coming with higher volume, which hints at distribution (smart money selling into rallies). Up days have lighter volume, showing weak buying interest. This volume pattern leans slightly bearish unless we suddenly see a spike in buying activity near 24,000. 2. Crucial Support and Resistance Levels Support Zones: 1.24,052–24,000 – Critical daily and weekly floor. Holding this is essential for bulls to defend the broader trend. 2.23,850 – Secondary demand zone from the April rebound. 3.22,800 – Major long-term swing low and lower boundary of the ascending channel. Resistance Zones: 1.24,800 – First hurdle for any short-term rebound attempt. 2.25,000 – Important psychological barrier and midpoint of the daily range. 3.25,660 – Multi-month range top; breaking above this would revive bullish momentum.
Price Action
- ■Price action is structurally positive.
- ■Forming higher highs and higher lows.
Volume Profile
- ■Volume is supportive of the price action.
- ■Wait for volume expansion on breakout.
Key Levels
No zones specified
No zones specified
Invalidation Scenario
A weekly close below the support level invalidates this structure.
Nifty PSU Bank
charts to-watchDouble Bottom Breakout
Daily Chart
Thesis & Analysis
No detailed thesis provided for this setup.
Price Action
- ■Price action is structurally positive.
- ■Forming higher highs and higher lows.
Volume Profile
- ■Volume is supportive of the price action.
- ■Wait for volume expansion on breakout.
Key Levels
No zones specified
No zones specified
Invalidation Scenario
A weekly close below the support level invalidates this structure.
NIFTY PSU BANK
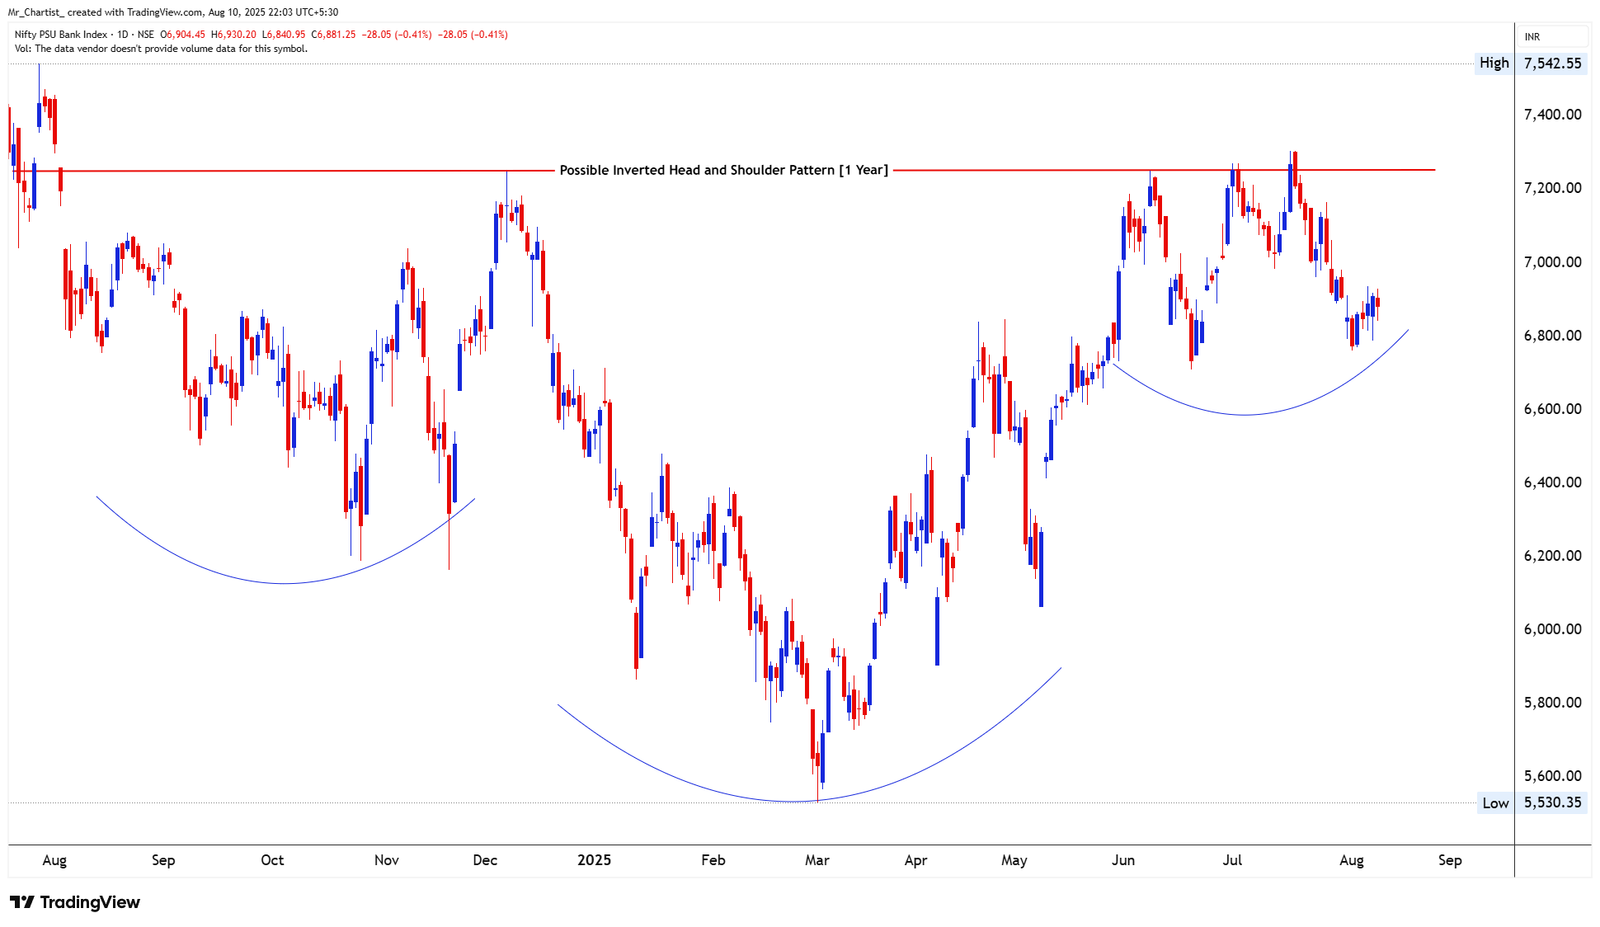
charts to-watchPossible Inverted Head & Shoulders
1 Year (Daily Chart – Potential Bullish Reversal Setup)
Thesis & Analysis
The PSU Bank Index appears to be forming a large inverted head and shoulders pattern, a structure often linked with bullish reversals. This setup has been developing over the past year, with the left shoulder in September 2024, the head forming in March 2025, and the right shoulder currently in progress. At present, the index is trading inside the right shoulder zone, having recently tested and held a support area near 6,700. This level has acted as a short-term floor, preventing further downside. A sustained rebound from here could push prices toward the neckline around 7,200 — a key breakout level for this pattern. If price breaks and sustains above 7,200, the inverted head and shoulders formation would be confirmed, opening the door for a larger upside move in the medium term. Candlestick Behavior: Recent daily candles near 6,700 have small bodies with mild upward bias, showing price stability after a pullback. No heavy selling candles have emerged at this support, suggesting that sellers are not yet in full control. Volume Analysis: No volume data is available for this index, so confirmation will rely solely on price action and breakout structure. 2. Crucial Support and Resistance Levels Support Zones: 1.6,700 – Key short-term floor; holding here keeps the right shoulder intact. 2.6,500 – Backup support from June consolidation. 3.6,200 – Deeper support; would weaken the bullish reversal idea if reached. Resistance Zones: 1.7,000 – First minor hurdle on a rebound. 2.7,200 – Neckline resistance; breakout point for bullish confirmation. 3.7,400+ – Post-breakout target zone based on pattern projection.
Price Action
- ■Price action is structurally positive.
- ■Forming higher highs and higher lows.
Volume Profile
- ■Volume is supportive of the price action.
- ■Wait for volume expansion on breakout.
Key Levels
No zones specified
No zones specified
Invalidation Scenario
A weekly close below the support level invalidates this structure.
Nifty Pharma
charts to-watchDouble Bottom Breakout
Daily Chart
Thesis & Analysis
No detailed thesis provided for this setup.
Price Action
- ■Price action is structurally positive.
- ■Forming higher highs and higher lows.
Volume Profile
- ■Volume is supportive of the price action.
- ■Wait for volume expansion on breakout.
Key Levels
No zones specified
No zones specified
Invalidation Scenario
A weekly close below the support level invalidates this structure.
NIFTY PHARMA
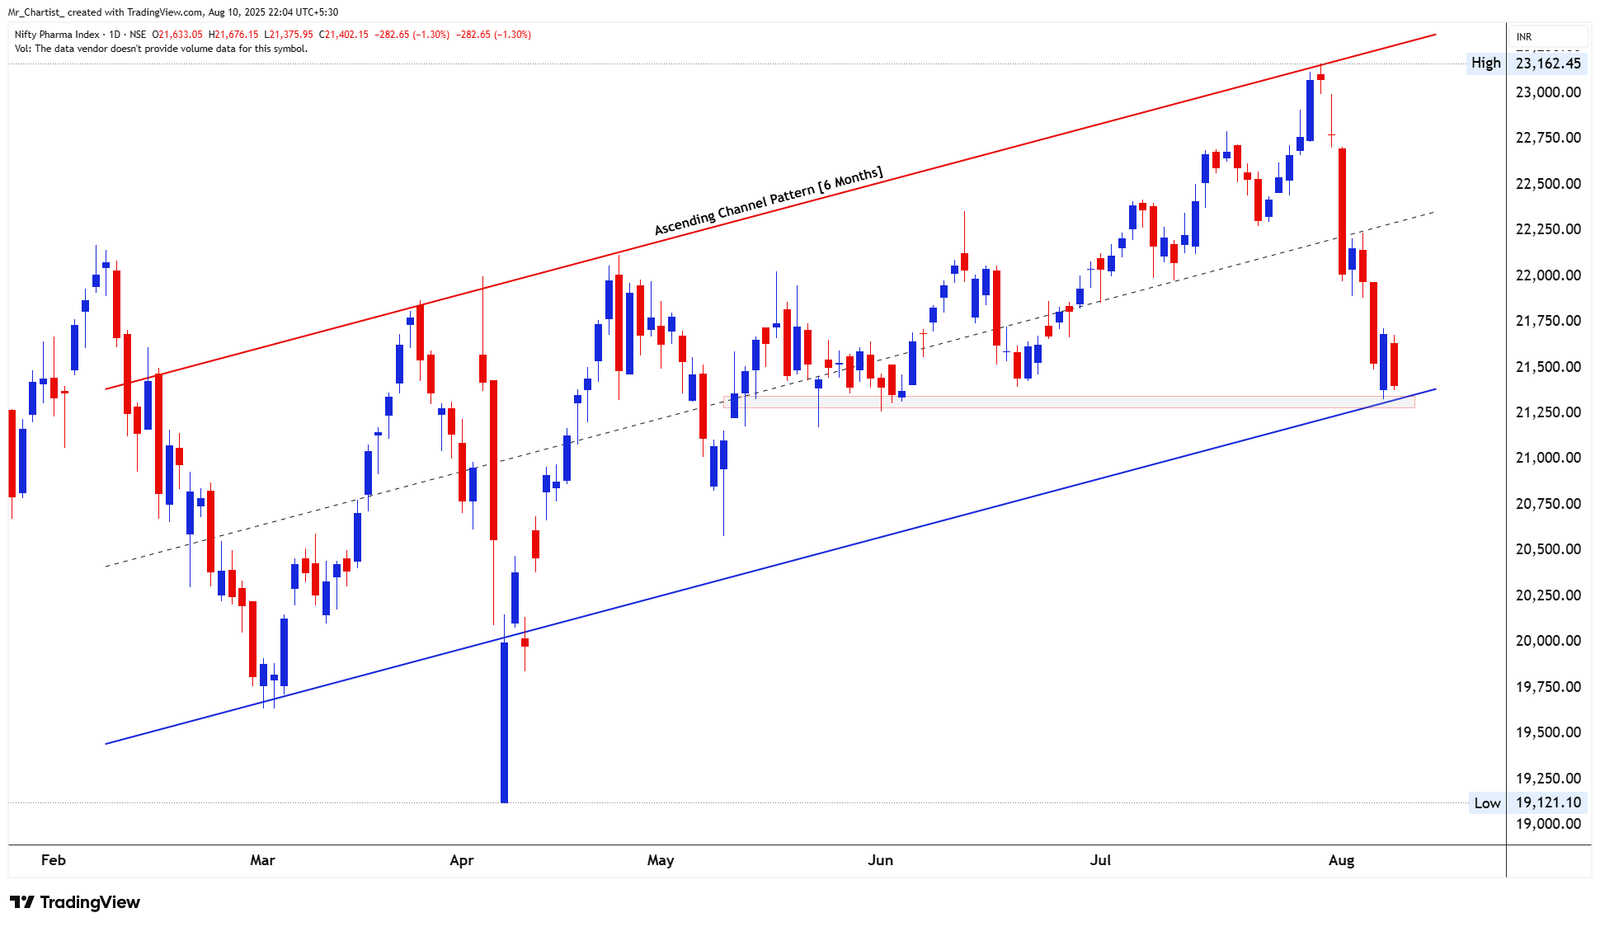
charts to-watchAscending Channel
6 Months (Daily Chart – Ongoing Trend)
Thesis & Analysis
Nifty Pharma has been trading inside a well-defined ascending channel for the past six months. The price recently touched the upper resistance trendline of the channel and reversed sharply, indicating that sellers stepped in at higher levels. This pullback has now brought the index to the lower support trendline, which coincides with a horizontal support zone around 21,250. This confluence of diagonal and horizontal support makes the current level very important. Holding above it could attract buying interest and lead to a short-term rebound. On the other hand, a breakdown below this level would signal that the uptrend is losing strength, potentially triggering a deeper fall. Candlestick Behavior: Recent candles near the support line show narrow bodies and reduced downward momentum compared to the earlier fall, hinting at possible stabilization. The absence of strong bullish reversal patterns means confirmation is still needed before calling a bounce. Volume Analysis: Volume data is not available for this chart, so price action will be the primary confirmation tool. Watch for wide-bodied bullish candles as an early sign of reversal. 2. Crucial Support and Resistance Levels Support Zones: 1.21,250 – Key confluence of horizontal and trendline support; the most important level to watch. 2.21,000 – Next downside zone if the first support fails. 3.20,500 – Deeper support and possible medium-term demand zone. Resistance Zones: 1.21,800 – Minor resistance from recent pullback levels. 2.22,300 – Mid-channel resistance and short-term breakout point. 3.23,000–23,150 – Upper channel boundary; recent reversal point. 3. Strategic Trade Scenarios 🔸 Primary Setup – Reversal from Channel Support If the index holds above 21,250 and forms a bullish reversal candle, a recovery toward 21,800 and 22,300 could follow. Sustaining above 22,300 would re-establish momentum toward the 23,000 channel top. 🔹 Alternate Setup – Breakdown Below Support If price closes below 21,250 and sustains there, the ascending channel structure would be at risk. This could open the way for a slide to 21,000 and potentially 20,500 in the short to medium term.
Price Action
- ■Price action is structurally positive.
- ■Forming higher highs and higher lows.
Volume Profile
- ■Volume is supportive of the price action.
- ■Wait for volume expansion on breakout.
Key Levels
No zones specified
No zones specified
Invalidation Scenario
A weekly close below the support level invalidates this structure.
Nifty Metal Index
charts to-watchDouble Bottom Breakout
Daily Chart
Thesis & Analysis
No detailed thesis provided for this setup.
Price Action
- ■Price action is structurally positive.
- ■Forming higher highs and higher lows.
Volume Profile
- ■Volume is supportive of the price action.
- ■Wait for volume expansion on breakout.
Key Levels
No zones specified
No zones specified
Invalidation Scenario
A weekly close below the support level invalidates this structure.
NIFTY IT
charts to-watchAscending Channel (Weekly) + Horizontal Support Zone (Daily)
Weekly – 5 Years | Daily – 6 Months
Thesis & Analysis
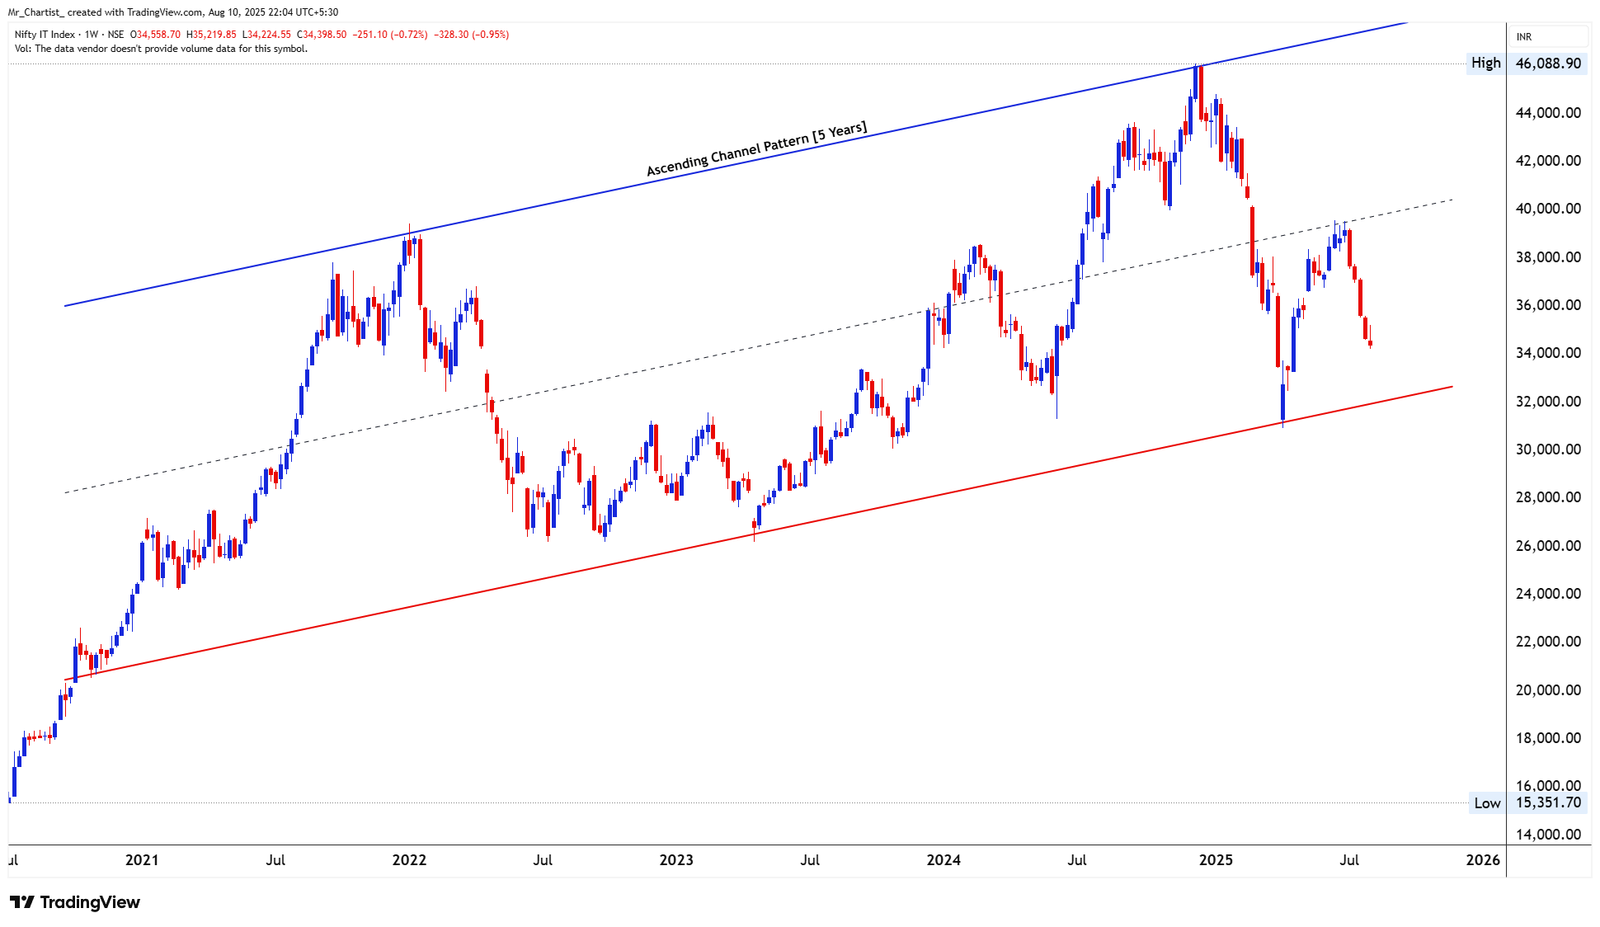
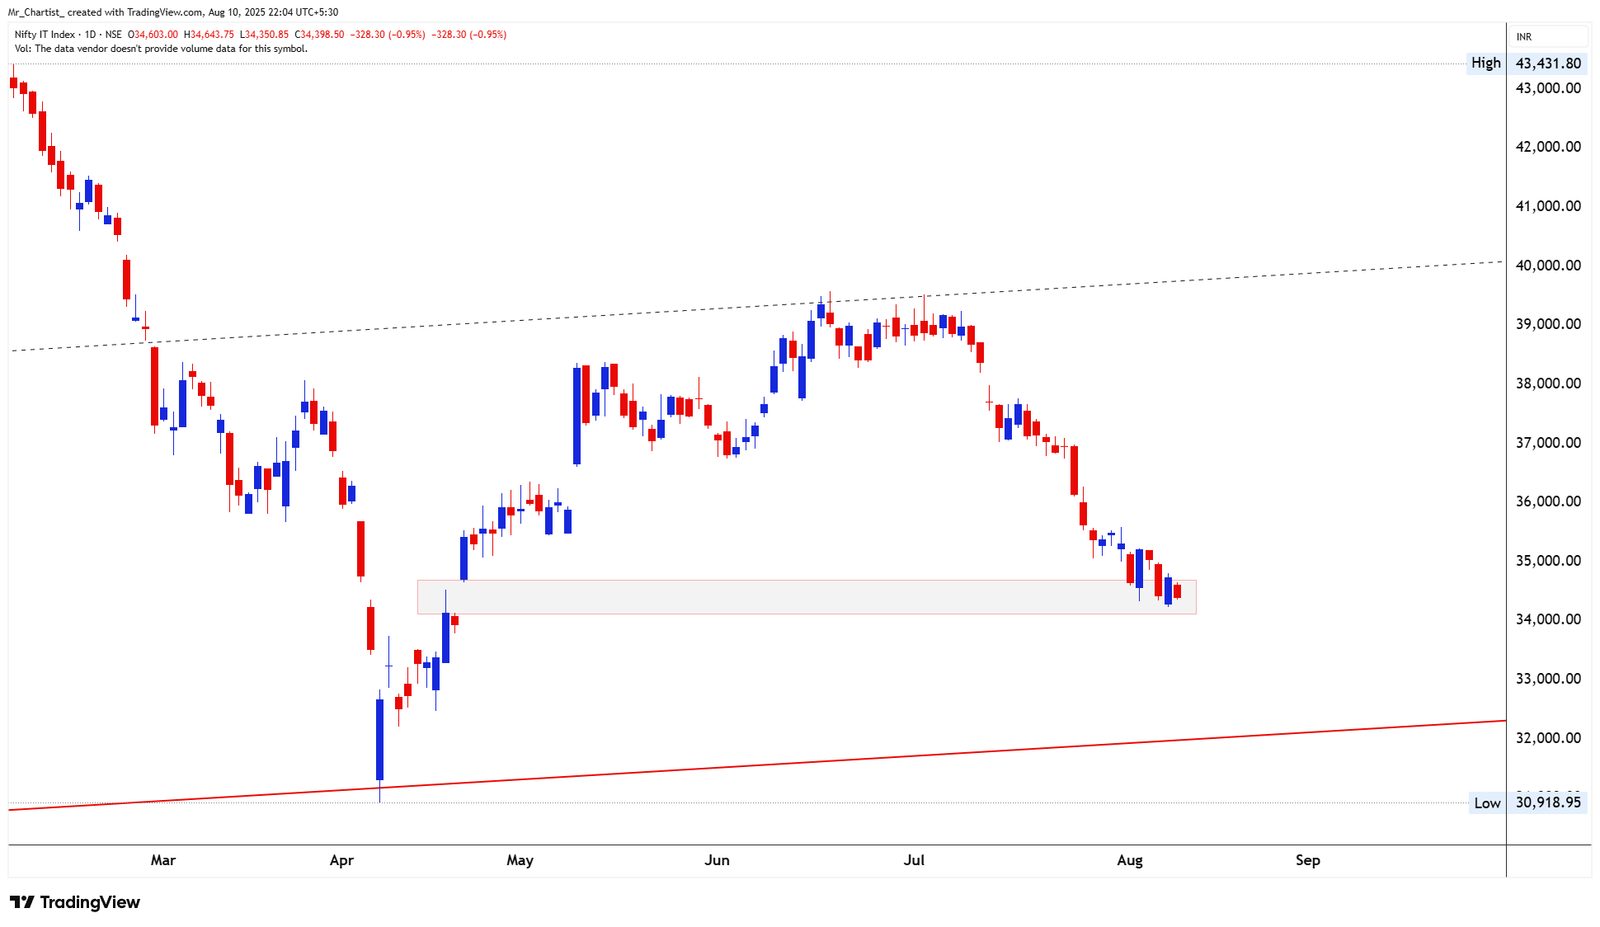
Weekly Perspective: Nifty IT has been moving inside a broad ascending channel for the past five years. Recently, the index touched the midline resistance of this channel and reversed lower. The decline from that point has been sharp, with strong bearish candles dominating recent weeks. The index is now heading toward the 32,000 support area, which is also near the lower boundary of the channel. If this level holds, the long-term uptrend remains valid. A breakdown below 32,000 could signal a much deeper correction toward the lower channel boundary. Daily Perspective: On the daily chart, Nifty IT is holding within a horizontal support zone between 34,000 and 35,000, which aligns with a past gap area. This zone is acting as the immediate floor for price action. If the index manages to push back above 35,000 and sustain, a short-term rebound could begin. If it breaks below 34,000, the structure would turn decisively bearish, opening the door for further downside. Candlestick Behavior: Weekly: Large-bodied bearish candles show strong selling pressure. Daily: Candles near support are small-bodied, suggesting price is pausing before the next move. Volume Analysis: Volume data is not available for this chart, so confirmation will rely on price behavior at the key levels. 2. Crucial Support and Resistance Levels Support Zones: 1.34,000 – Key daily horizontal support; breakdown here can accelerate selling. 2.32,000 – Major weekly support; crucial to hold for the long-term trend. 3.30,900 – Deeper support, close to the lower channel boundary. Resistance Zones: 1.35,000 – First upside hurdle; reclaiming this would improve short-term sentiment. 2.36,500 – Mid-range resistance from the July pullback. 3.38,000 – Larger resistance; needs breakout to regain medium-term strength.
Price Action
- ■Price action is structurally positive.
- ■Forming higher highs and higher lows.
Volume Profile
- ■Volume is supportive of the price action.
- ■Wait for volume expansion on breakout.
Key Levels
No zones specified
No zones specified
Invalidation Scenario
A weekly close below the support level invalidates this structure.
Nifty FMCG
charts to-watchDouble Bottom Breakout
Daily Chart
Thesis & Analysis
No detailed thesis provided for this setup.
Price Action
- ■Price action is structurally positive.
- ■Forming higher highs and higher lows.
Volume Profile
- ■Volume is supportive of the price action.
- ■Wait for volume expansion on breakout.
Key Levels
No zones specified
No zones specified
Invalidation Scenario
A weekly close below the support level invalidates this structure.
NIFTY FMCG
charts to-watchSymmetrical Triangle
10 Months (Daily Chart – Consolidation Phase)
Thesis & Analysis
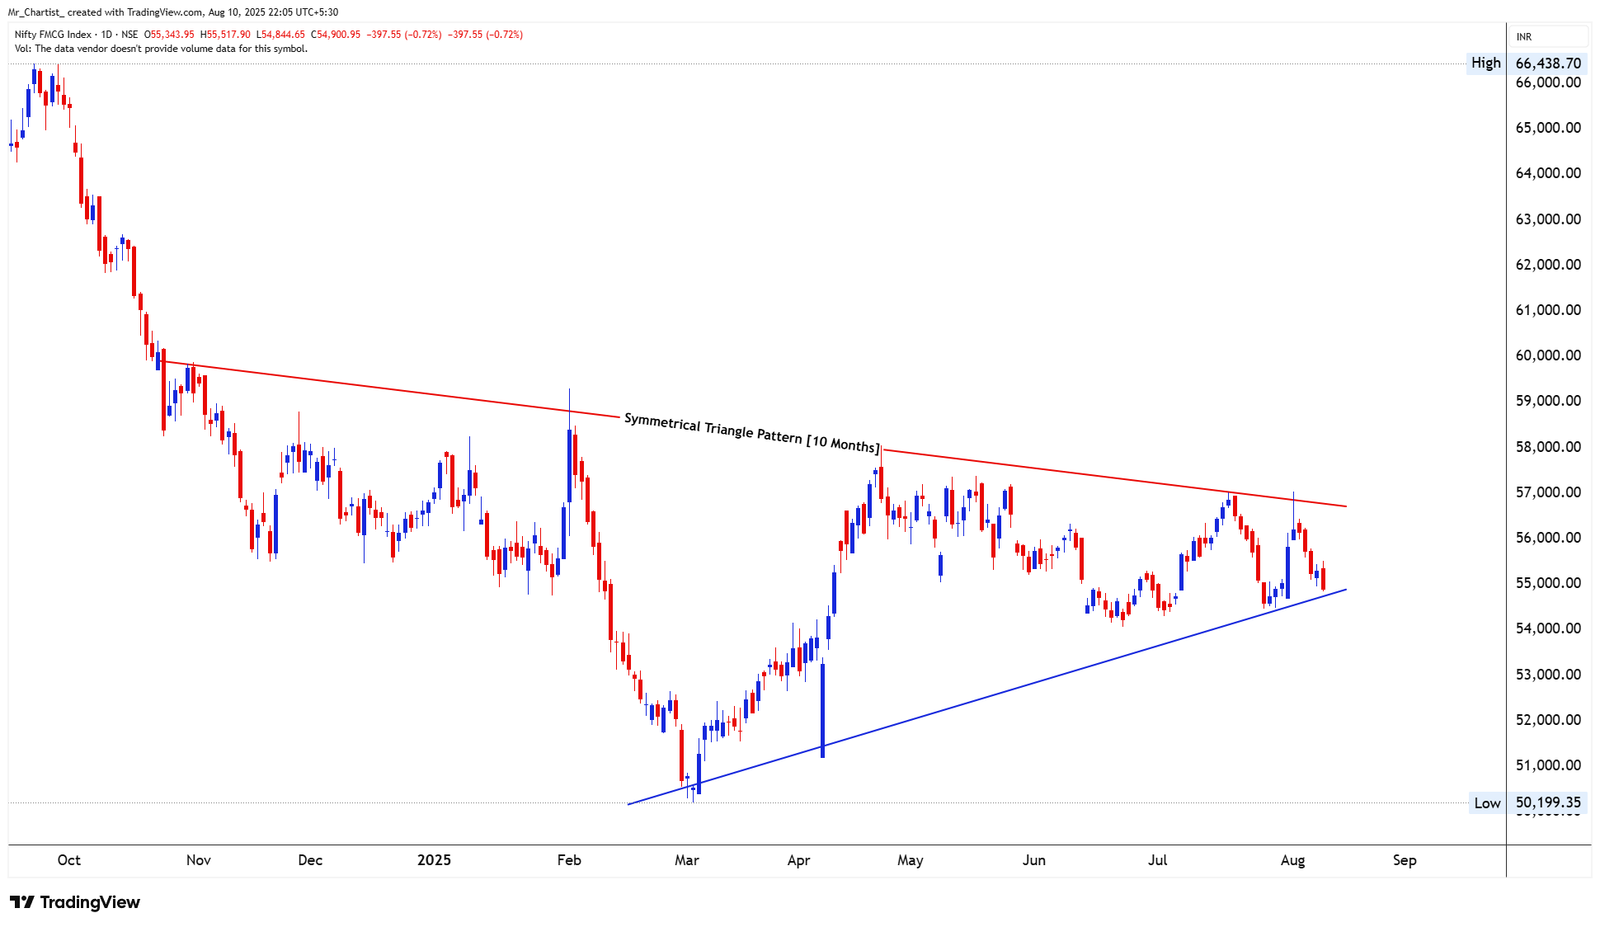
Nifty FMCG has been consolidating inside a symmetrical triangle for the past 10 months. This pattern is defined by a series of lower highs and higher lows, showing that price is being squeezed between converging trendlines. Recently, the index touched the upper resistance line near 57,000 and formed a shooting star candlestick, indicating selling pressure at higher levels. Since then, price has reversed and is now testing the lower support trendline, which aligns closely with a horizontal support zone around 54,000. This makes the 54,000 level a key decision point. A breakdown below it could shift sentiment bearish, while a rebound could set up another move toward the triangle’s upper boundary. Candlestick Behavior: The shooting star at resistance confirms seller dominance at higher levels. Recent candles near support are smaller-bodied, suggesting indecision as the market waits for a breakout or breakdown. Volume Analysis: Volume data is not available for this chart, so focus will be on price action near 54,000 and 57,000 for confirmation. 2. Crucial Support and Resistance Levels Support Zones: 1.54,000 – Confluence of triangle support and horizontal base; key breakdown trigger. 2.52,000 – Next support level if 54,000 fails. 3.50,000 – Major swing low and broader trend support. Resistance Zones: 1.57,000 – Triangle resistance; breakout above this would shift bias bullish. 2.59,000 – Post-breakout target zone. 3.62,000 – Upper extension target if bullish momentum builds. 3. Strategic Trade Scenarios 🔸 Primary Setup – Breakout Above 57,000 If price closes above 57,000 and sustains, it would confirm a bullish breakout from the symmetrical triangle. This could open a move toward 59,000, with potential to extend to 62,000 in the coming weeks. 🔹 Alternate Setup – Breakdown Below 54,000 If price closes below 54,000 and holds, the triangle would break to the downside. This could trigger a fall toward 52,000, and if weakness persists, extend to 50,000.
Price Action
- ■Price action is structurally positive.
- ■Forming higher highs and higher lows.
Volume Profile
- ■Volume is supportive of the price action.
- ■Wait for volume expansion on breakout.
Key Levels
No zones specified
No zones specified
Invalidation Scenario
A weekly close below the support level invalidates this structure.
Nifty Energy
charts to-watchDouble Bottom Breakout
Daily Chart
Thesis & Analysis
No detailed thesis provided for this setup.
Price Action
- ■Price action is structurally positive.
- ■Forming higher highs and higher lows.
Volume Profile
- ■Volume is supportive of the price action.
- ■Wait for volume expansion on breakout.
Key Levels
No zones specified
No zones specified
Invalidation Scenario
A weekly close below the support level invalidates this structure.
NIFTY ENERGY
charts to-watchRectangle Pattern (Sideways Consolidation)
7 Months (Daily Chart – Range-Bound Phase)
Thesis & Analysis
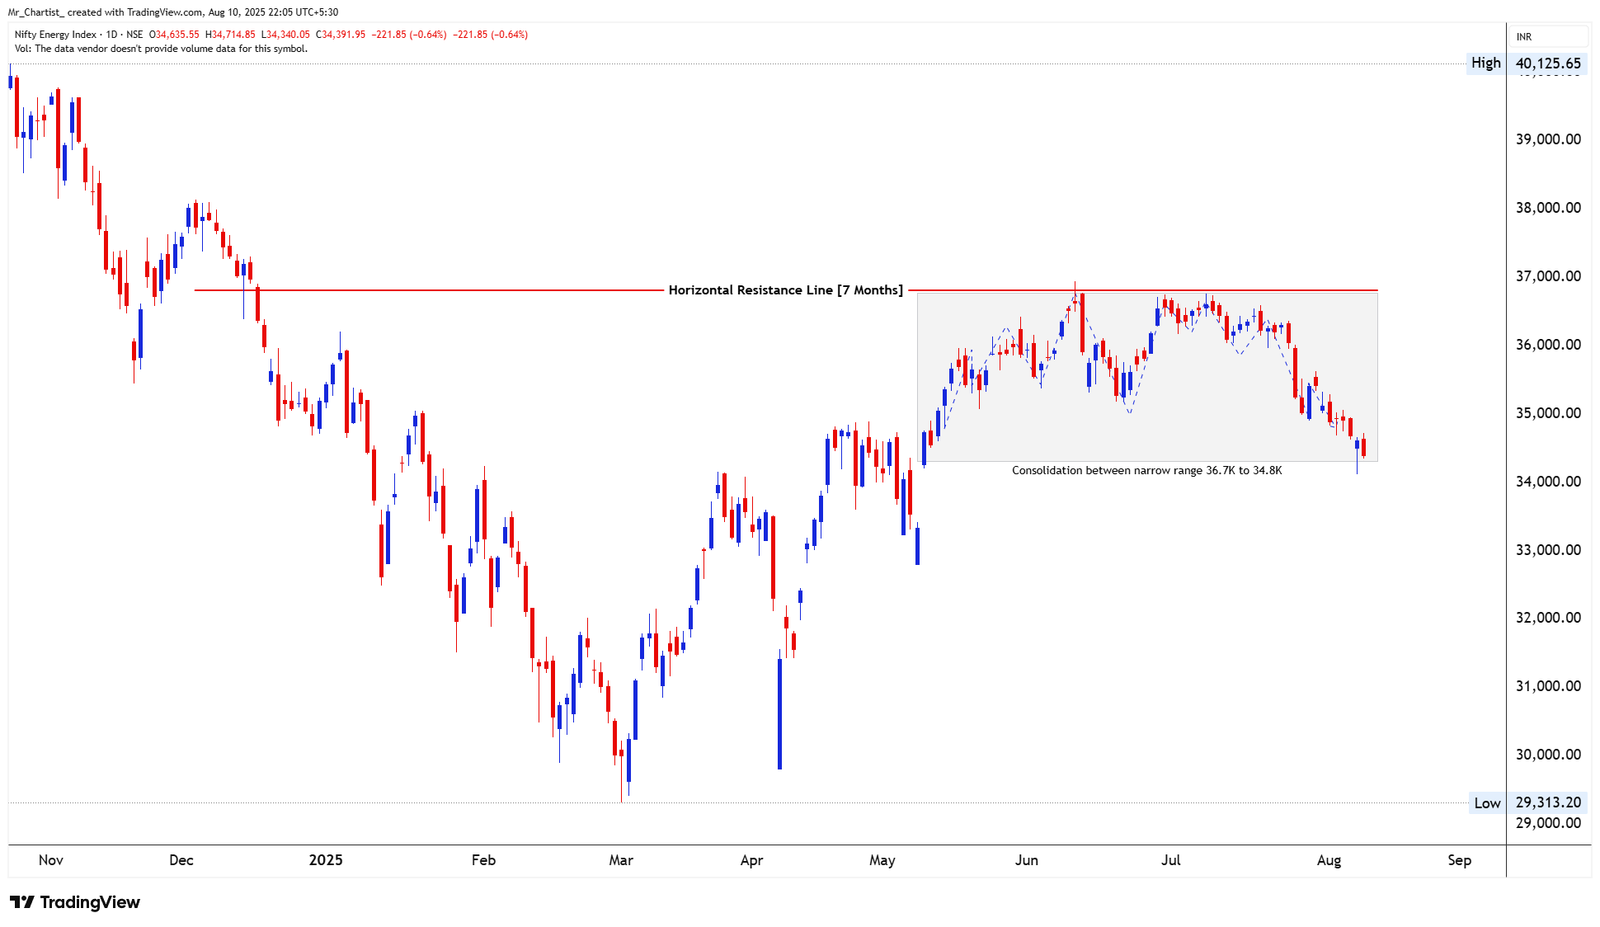
Nifty Energy has been moving inside a rectangle consolidation pattern for the past seven months, with a range between 36,700 on the upper side and 34,800 on the lower side. This structure represents a tug-of-war between buyers and sellers, where neither side has been able to take control. Recently, the price tested the lower boundary of the rectangle near 34,000 and formed a hammer candlestick, signaling potential buying interest at this level. This makes the current zone a critical decision point for the next move. If the price pushes above 35,000 and sustains, it could confirm a short-term reversal and set up a move toward 36,800 — the upper boundary of the range. If the price breaks below 34,000 and sustains, it would confirm a downside breakout, potentially triggering a sharp decline. Candlestick Behavior: The hammer near 34,000 hints at buyer defense, but follow-through buying is required for confirmation. Recent candles inside the range have been relatively small-bodied, reflecting the indecision phase. Volume Analysis: Volume data is not available for this chart, so focus will be on the strength and follow- through of price action at the breakout/breakdown levels. 2. Crucial Support and Resistance Levels Support Zones: 1.34,000 – Key breakdown level; losing this could accelerate selling. 2.33,000 – Next downside target if 34,000 fails. 3.31,500 – Broader trend support from past swing lows. Resistance Zones: 1.35,000 – First hurdle to signal reversal potential. 2.36,700–36,800 – Rectangle top and major breakout trigger. 3.38,000 – Extended target if bullish breakout occurs. 3. Strategic Trade Scenarios 🔸 Primary Setup – Reversal from Support If the index holds above 34,000 and closes above 35,000, a short-term rebound toward 36,700–36,800 is likely. Sustaining above the rectangle top could then open a path toward 38,000. 🔹 Alternate Setup – Breakdown Below Support If the index breaks below 34,000 and sustains, it would confirm a bearish breakdown. This could lead to a sharp fall toward 33,000, and if weakness continues, a deeper drop toward 31,500.
Price Action
- ■Price action is structurally positive.
- ■Forming higher highs and higher lows.
Volume Profile
- ■Volume is supportive of the price action.
- ■Wait for volume expansion on breakout.
Key Levels
No zones specified
No zones specified
Invalidation Scenario
A weekly close below the support level invalidates this structure.
Nifty Auto
charts to-watchDouble Bottom Breakout
Daily Chart
Thesis & Analysis
No detailed thesis provided for this setup.
Price Action
- ■Price action is structurally positive.
- ■Forming higher highs and higher lows.
Volume Profile
- ■Volume is supportive of the price action.
- ■Wait for volume expansion on breakout.
Key Levels
No zones specified
No zones specified
Invalidation Scenario
A weekly close below the support level invalidates this structure.
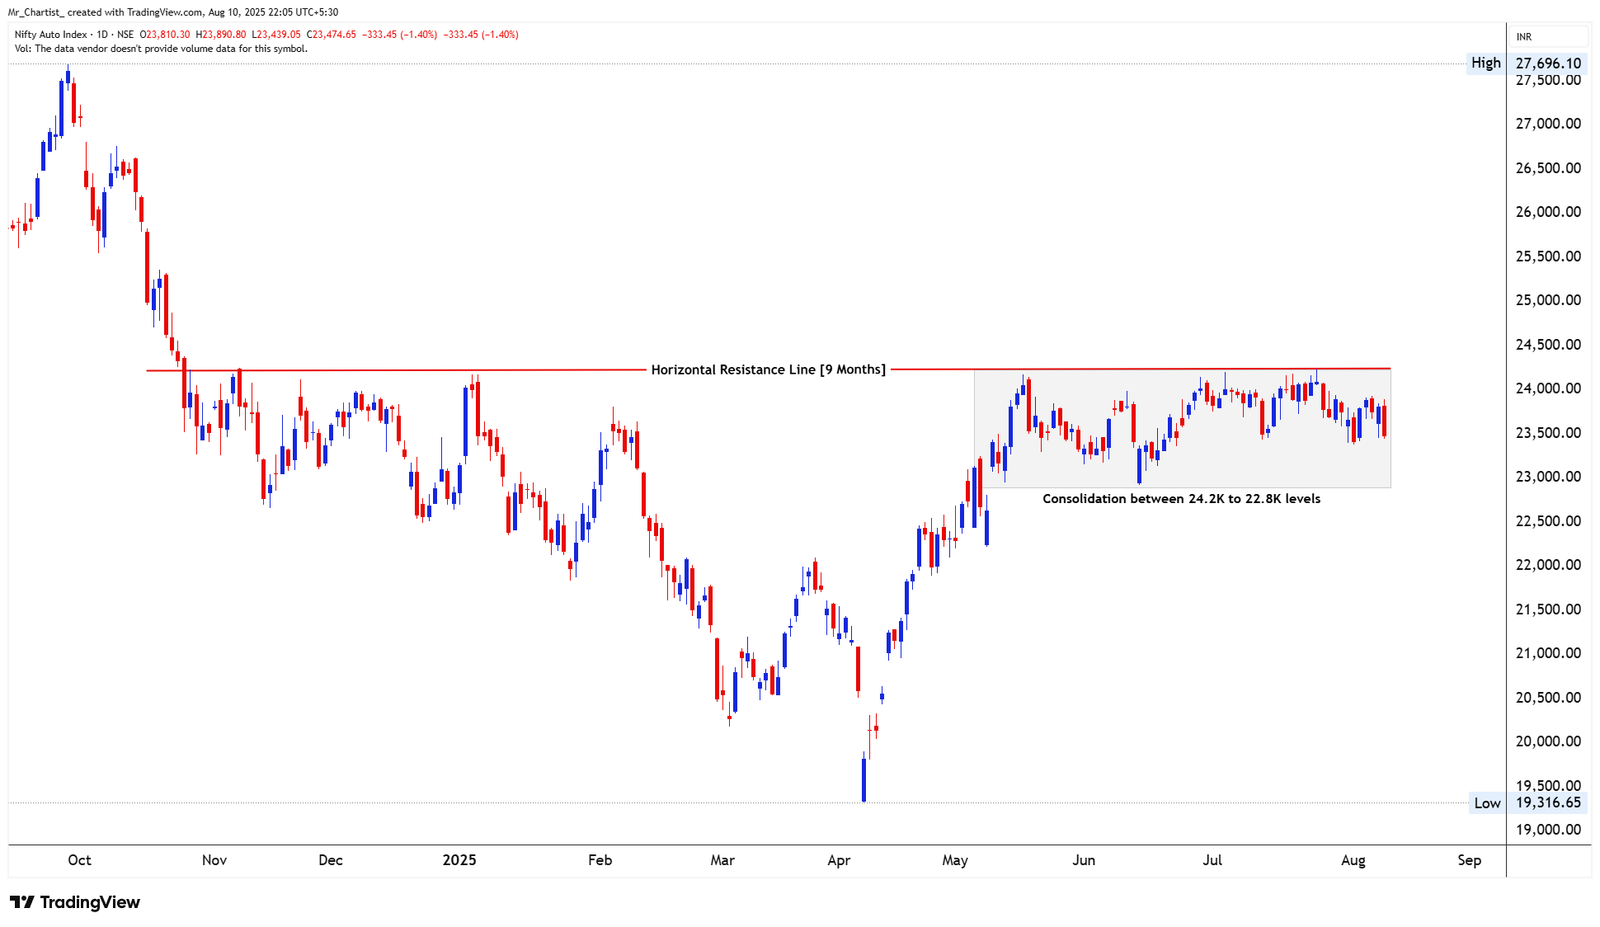
NIFTY AUTO
charts to-watchHorizontal Resistance with Range-Bound Consolidation
9 Months (Daily Chart – Sideways Structure)
Thesis & Analysis
Nifty Auto has been trading in a broad sideways range for the past several months, with 24,200 acting as a strong horizontal resistance and 22,800 serving as a solid support base. This setup shows that buyers and sellers are in balance, but the repeated tests of the upper and lower boundaries indicate a buildup toward a decisive move. Recently, the price has been consolidating within this range, holding above the 22,800 support zone while repeatedly testing the 24,200 ceiling. A breakout or breakdown from this range could trigger a significant directional move. Bullish Trigger: Sustained trade above 24,200 would confirm a breakout and shift momentum upward. Bearish Trigger: Sustained trade below 22,800 would signal breakdown and likely lead to further downside. Candlestick Behavior: Price action near the upper boundary shows rejection wicks, meaning sellers are still active at 24,200. Candles near the lower boundary have shown buying tails, indicating buyer defense. Volume Analysis: Volume data is unavailable here, so confirmation will rely on the strength of breakout or breakdown candles. 2. Crucial Support and Resistance Levels Support Zones: 1.22,800 – Key breakdown level; losing this would shift bias bearish. 2.22,000 – Next major support if 22,800 fails. 3.20,800 – Broader trend support from earlier swing lows. Resistance Zones: 1.24,200 – Range top; breakout confirmation level. 2.25,500 – First target post-breakout. 3.26,500 – Extended breakout target. 3. Strategic Trade Scenarios 🔸 Primary Setup – Breakout Above 24,200 If the index closes above 24,200 and sustains, it would confirm a bullish breakout. Upside targets would be 25,500 initially, and 26,500 if momentum continues. 🔹 Alternate Setup – Breakdown Below 22,800 If the index closes below 22,800 and holds, it would trigger a breakdown from the range. This could lead to a decline toward 22,000 first, and then potentially 20,800.
Price Action
- ■Price action is structurally positive.
- ■Forming higher highs and higher lows.
Volume Profile
- ■Volume is supportive of the price action.
- ■Wait for volume expansion on breakout.
Key Levels
No zones specified
No zones specified
Invalidation Scenario
A weekly close below the support level invalidates this structure.
Nifty Bank
charts to-watchDouble Bottom Breakout
Daily Chart
Thesis & Analysis
No detailed thesis provided for this setup.
Price Action
- ■Price action is structurally positive.
- ■Forming higher highs and higher lows.
Volume Profile
- ■Volume is supportive of the price action.
- ■Wait for volume expansion on breakout.
Key Levels
No zones specified
No zones specified
Invalidation Scenario
A weekly close below the support level invalidates this structure.
Chart Image Not Extracted
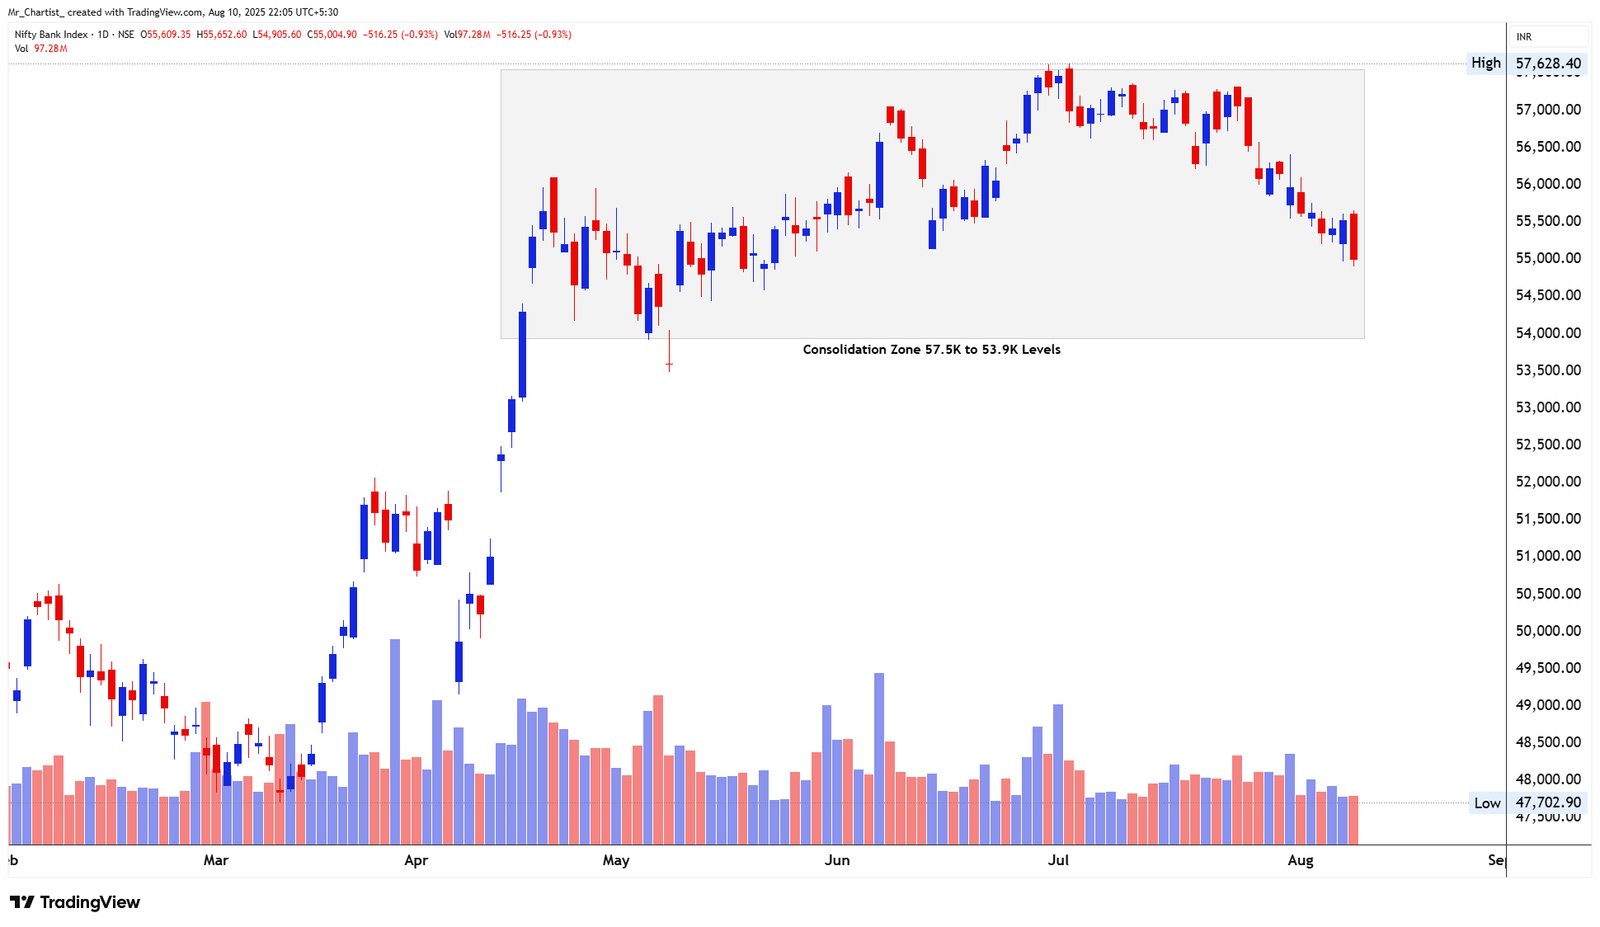
NIFTY BANK
charts to-watchRectangle / Sideways Consolidation
4 Months (Daily Chart – Range-Bound Phase)
Thesis & Analysis
Nifty Bank has been trading inside a rectangle consolidation zone between 57,500 on the upper side and 53,900 on the lower side. This structure reflects a period of equilibrium where buying and selling pressures are balanced. At present, the index is approaching the lower boundary near 54,000, a level that has repeatedly acted as support over the past months. If this level holds, a short-term bounce back toward the mid-to-upper range could follow. If it breaks and sustains below 53,900, it would confirm a downside breakout, shifting momentum toward sellers. On the upside, clearing 57,000–57,500 would signal a bullish breakout and put the index near all-time high territory. Candlestick Behavior: Recent candles show steady declines with moderate-sized bodies, indicating controlled selling pressure. No clear bullish reversal pattern has emerged yet near support. Volume Analysis: Volume has been steady during the range, with no large spikes — suggesting participants are waiting for a breakout/breakdown trigger before committing strongly. 2. Crucial Support and Resistance Levels Support Zones: 1.54,000–53,900 – Critical range floor; breakdown trigger zone. 2.52,500 – Next major support if 53,900 fails. 3.50,500 – Broader trend support from earlier swing lows. Resistance Zones: 1.55,800 – Mid-range barrier. 2.57,000–57,500 – Range top and breakout confirmation level. 3.58,500+ – All-time high zone and potential extended target. 3. Strategic Trade Scenarios 🔸 Primary Setup – Breakdown Below 53,900 If the index closes below 53,900 and sustains, it would confirm a bearish breakdown. Potential downside targets would be 52,500, followed by 50,500 if selling intensifies. 🔹 Alternate Setup – Breakout Above 57,500 If price closes above 57,500 and holds, a bullish breakout would be confirmed. This could lead to a rally toward 58,500 and possibly new all-time highs.
Price Action
- ■Price action is structurally positive.
- ■Forming higher highs and higher lows.
Volume Profile
- ■Volume is supportive of the price action.
- ■Wait for volume expansion on breakout.
Key Levels
No zones specified
No zones specified
Invalidation Scenario
A weekly close below the support level invalidates this structure.
SEBI Registered Research Analyst — INH000015297 (INVESTOLOGY). Investment in securities market are subject to market risks. Read all related documents carefully before investing. The content provided is for educational purposes only and should not be considered as financial advice. Past performance is not indicative of future results.