
🟢 Introduction to the Timeframe Selector
The Timeframe Selector in TradingView is a vital feature located at the top toolbar, right next to the symbol search bar. This tool allows you to control how much data each candlestick or bar represents on your chart—ranging from 1-minute to monthly or even custom time intervals.
Understanding how to select the right timeframe is essential for every trader. It helps define your trading context—whether you’re a scalper zooming in on minute-by-minute changes or a long-term investor reviewing monthly trends.
Each timeframe tells a different story. A 5-minute chart may show a quick pullback, while a 1-day chart could reveal an uptrend. That’s why selecting the right timeframe according to your strategy helps in aligning entries, exits, and risk management.
We’ll explore how to use this feature efficiently and how different timeframes impact your trading decisions in upcoming sections.

🧭 Different Timeframes Available in TradingView
TradingView offers one of the most flexible and diverse sets of chart timeframes among charting platforms. These timeframes determine how much data is shown in each candlestick or bar on your chart. This flexibility allows traders to analyze market trends based on their trading style—be it scalping, intraday, swing, or long-term investing.
- 🕐 Minute-Based: 1m, 3m, 5m, 15m, 30m — Ideal for scalping and fast-paced intraday decisions.
- ⏱️ Hour-Based: 1h, 2h, 4h — Perfect for short-term trading and clearer trend formation.
- 📅 Daily & Weekly: 1D, 1W — Used widely in swing trading and mid-term setups.
- 📈 Monthly & Yearly: 1M, 1Y — Essential for investors and analyzing long-term cycles.
- ⚙️ Custom Intervals: Create personalized timeframes like 12m, 2h, 8h for tailored analysis.
Each type of trader benefits from different timeframes. For example, a 3-minute chart may highlight short-term momentum, while a 1-week chart reveals the bigger picture trend. Traders often use multiple timeframes together to identify opportunities and confirm entries and exits more accurately.
Pro Tip: Use multi-timeframe analysis. Always start from higher timeframes (1W or 1D) to define trend, and move to lower timeframes (15m or 5m) to time entries.
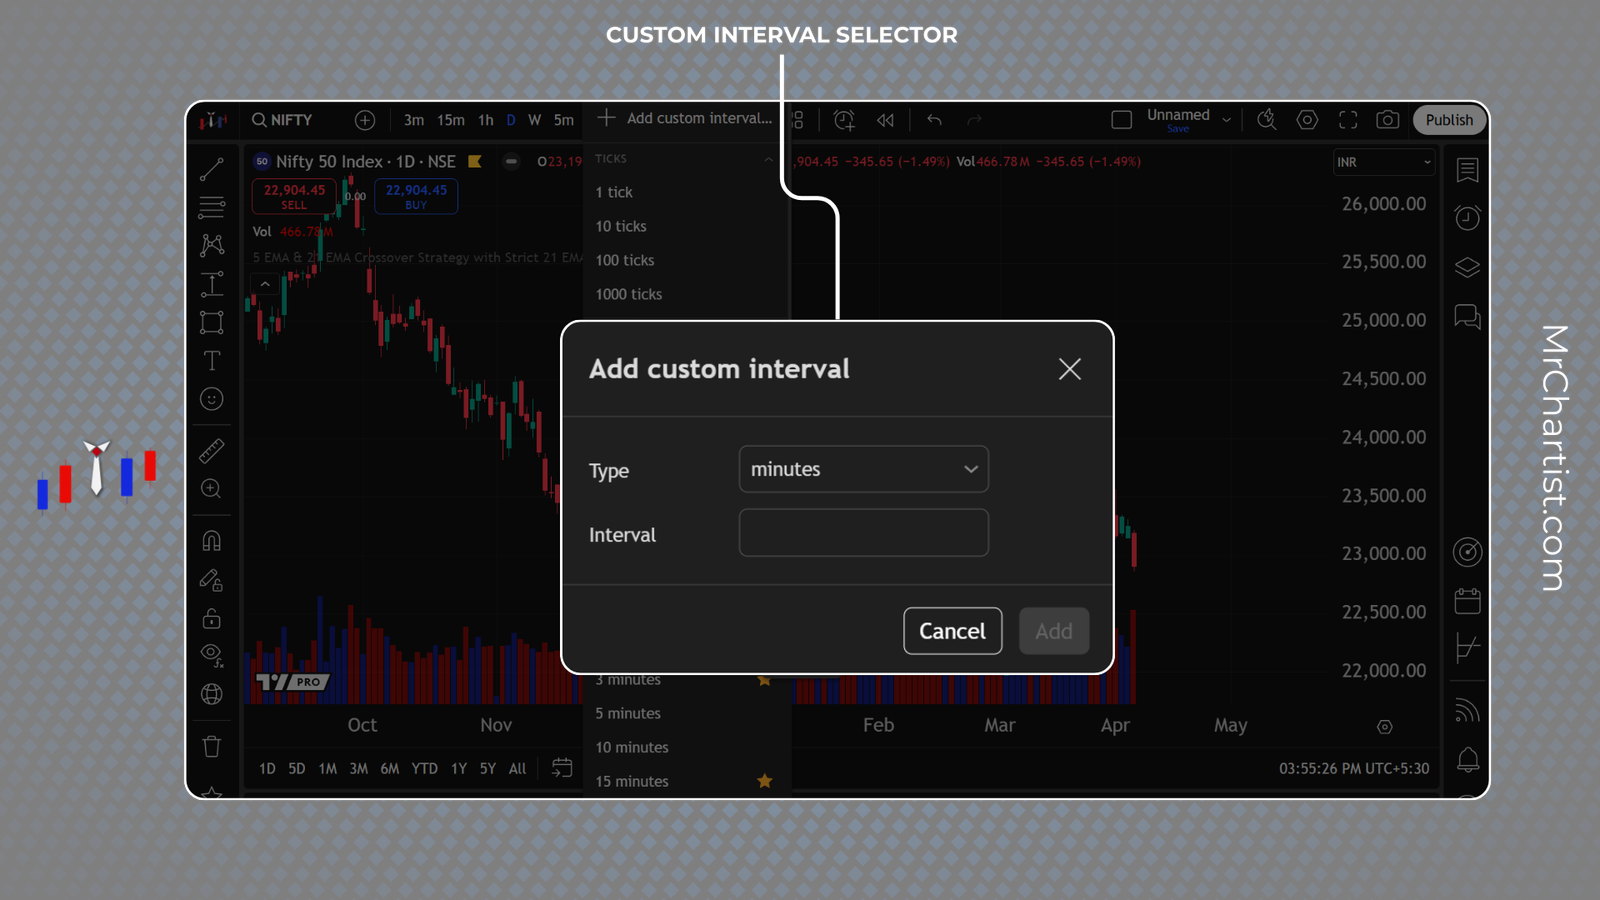
🛠️ Custom Time Interval Selector
TradingView goes beyond predefined timeframes by offering a powerful feature called Custom Interval Selector. This allows you to create your own chart intervals—ideal for traders who prefer specific time breakdowns not commonly available in default settings.
To access this feature, click the small dropdown next to the default intervals on the Timeframe Selector, and then click on “Add Custom Interval”. A pop-up will appear where you can choose:
- Type: Select between minutes, hours, days, weeks, months, or even range
- Interval: Enter any value like 2, 12, or even 90 for a 90-minute chart
This customization is extremely useful when you want to do something specific like trade on 12-minute or 2-hour charts, which aren’t available by default but suit your strategy better.
You can also create time-based intervals like 3 weeks or 6 months to match specific technical setups or institutional reporting timelines.
Pro Tip: After adding your custom timeframe, click the ⭐ (star) next to it to add it permanently to your toolbar for quick access.
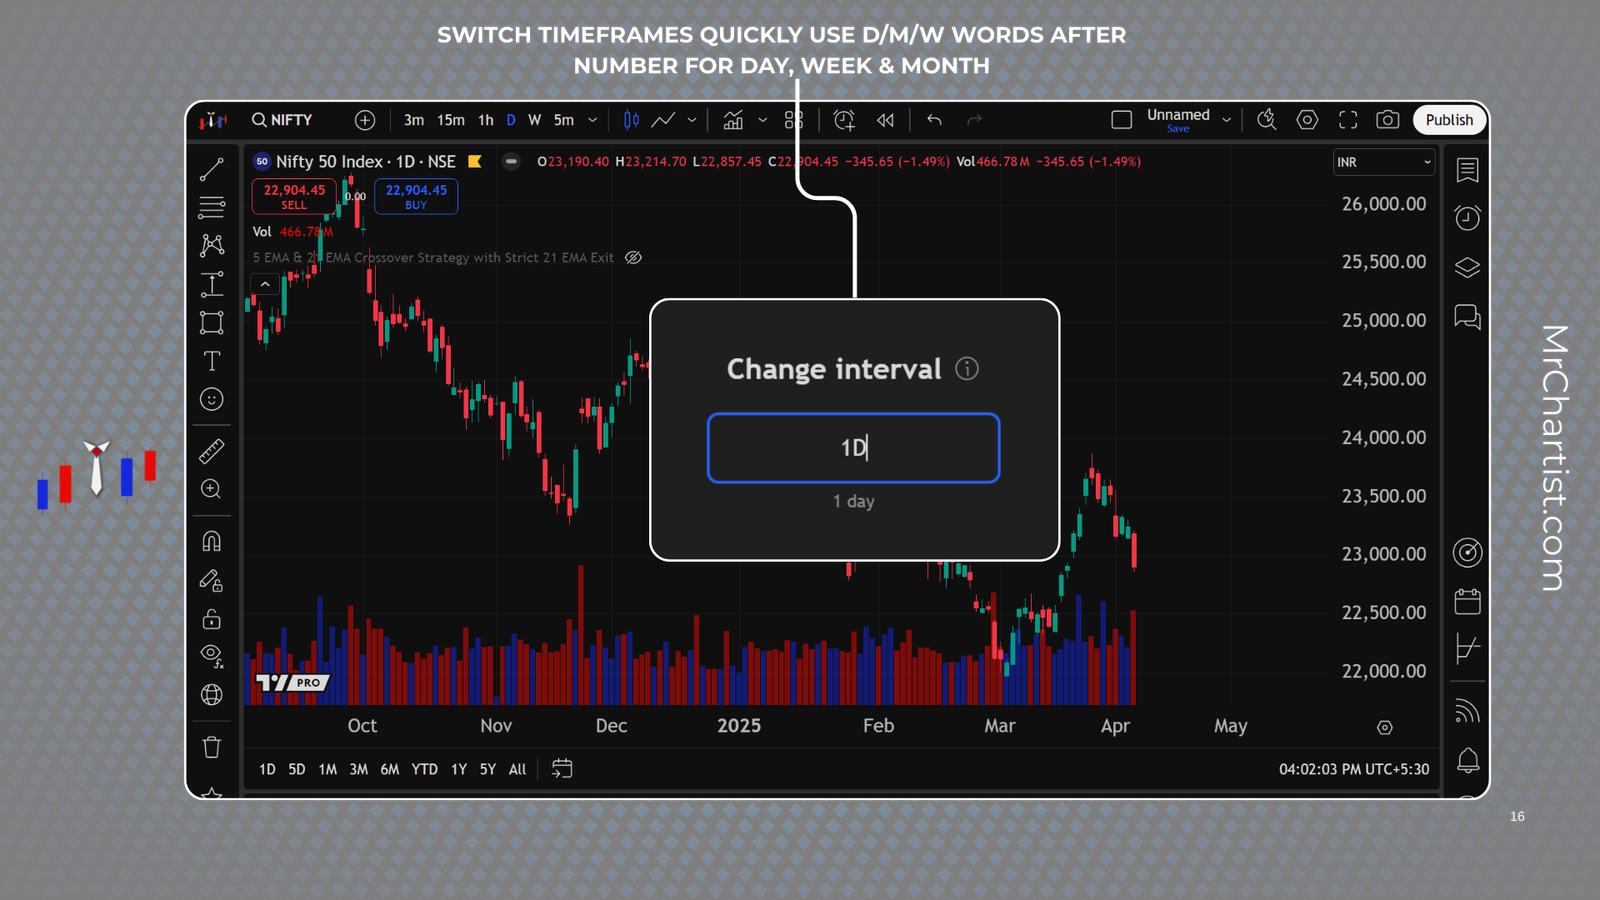
🔄 How to Switch Timeframes Quickly
In fast-moving markets, speed is everything. TradingView makes it easy to switch between timeframes using dropdowns, favorites, or simple keystrokes—without ever leaving your chart view.
- 🔽 1. Use the Dropdown Menu: Click the Timeframe Selector and choose from built-in intervals like 1m, 5m, 1h, 1D, etc.
- ⭐ 2. Use Favorites: Click the ⭐ beside your preferred intervals. They will appear directly on the toolbar, letting you switch instantly with a single click.
- ⌨️ 3. Keyboard Shortcut: Type directly on your keyboard to change the interval. Example:
15 + Enter changes the chart to 15 minutes.
You can also use letters:- 1D → Daily Chart
- 1W → Weekly Chart
- 1M → Monthly Chart
D,W, orMdirectly on the chart and hit Enter!
These methods ensure smooth, fast transitions during trading—perfect for scalpers and active traders managing multiple trades or setups.
Pro Tip: Favorite intervals stay synced to your account and appear across all devices, including mobile and tablet!
🎯 Timeframes Based on Trading Style
Choosing the right timeframe is one of the most important decisions every trader must make. Whether you are scalping in seconds, trading options for intraday moves, or building wealth with long-term investments — the chart timeframe you select defines your market perspective, risk, and strategy.
Let’s break down the most common trading styles and their ideal timeframes in TradingView:
- ⚡ Scalping: For traders who enter and exit positions within minutes. Use 1m, 3m, or 5m charts to capture micro price movements.
- Best for high-frequency trades with tight stop losses.
- Requires strong focus, quick execution, and low-latency setups.
- 📈 Intraday Trading: Suitable for traders who complete trades within the same day. Common timeframes are 5m, 15m, 1h.
- Used for spotting intraday breakouts, momentum moves, or trend reversals.
- Pairs well with pre-market or opening range strategies.
- 📊 Swing Trading: For traders who hold positions for a few days to weeks. Focus on 4h, 1D, or 1W charts.
- Captures multi-day market swings or breakout continuation moves.
- Helps avoid intraday noise while still reacting quickly to setups.
- 🏦 Long-Term Investing: For investors who hold for months or years. Use 1W, 1M, or 1Y views.
- Great for fundamental-backed portfolios and compounding returns.
- Helps zoom out for macro trend analysis and sector rotation.
- 💼 Options Trading: Combines fast decision-making with precise timing. Use a blend of 3m, 15m, and 1h charts.
- Smaller timeframes help with entry/exit accuracy and delta-decay strategies.
- Also use 1D for direction bias, and 15m for confirmation.
Every trading style has a rhythm — and timeframes help you dance with it. By aligning your time horizon with the appropriate chart intervals, you get cleaner setups, more relevant signals, and better risk management.
Pro Tip: Use top-down analysis. Even scalpers should look at 1D or 1W charts to avoid trading against the trend!
| 🧭 Trading Style | ⏱️ Suggested Timeframes | 🧠 Purpose / Notes |
|---|---|---|
| ⚡ Scalping | 1m 3m 5m | Capture very small price movements using tight stop losses and high leverage. Requires strong attention and fast execution speed. |
| 📈 Intraday Trading | 5m 15m 1h | Identify and trade price swings and momentum moves that occur within the same day. Great for breakout setups and VWAP strategies. |
| 📊 Swing Trading | 4h 1D 1W | Ride market trends for multiple days or weeks. Helps reduce noise and improve risk/reward through multi-day confirmation. |
| 🏦 Long-Term Investing | 1W 1M 1Y | Focus on large macroeconomic trends and major sector rotations. Ideal for passive investors and portfolio rebalancing decisions. |
| 💼 Options Trading | 3m 15m 1h 1D | Time-sensitive entries/exits with precision. Smaller timeframes help manage theta decay and volatility shifts efficiently. |
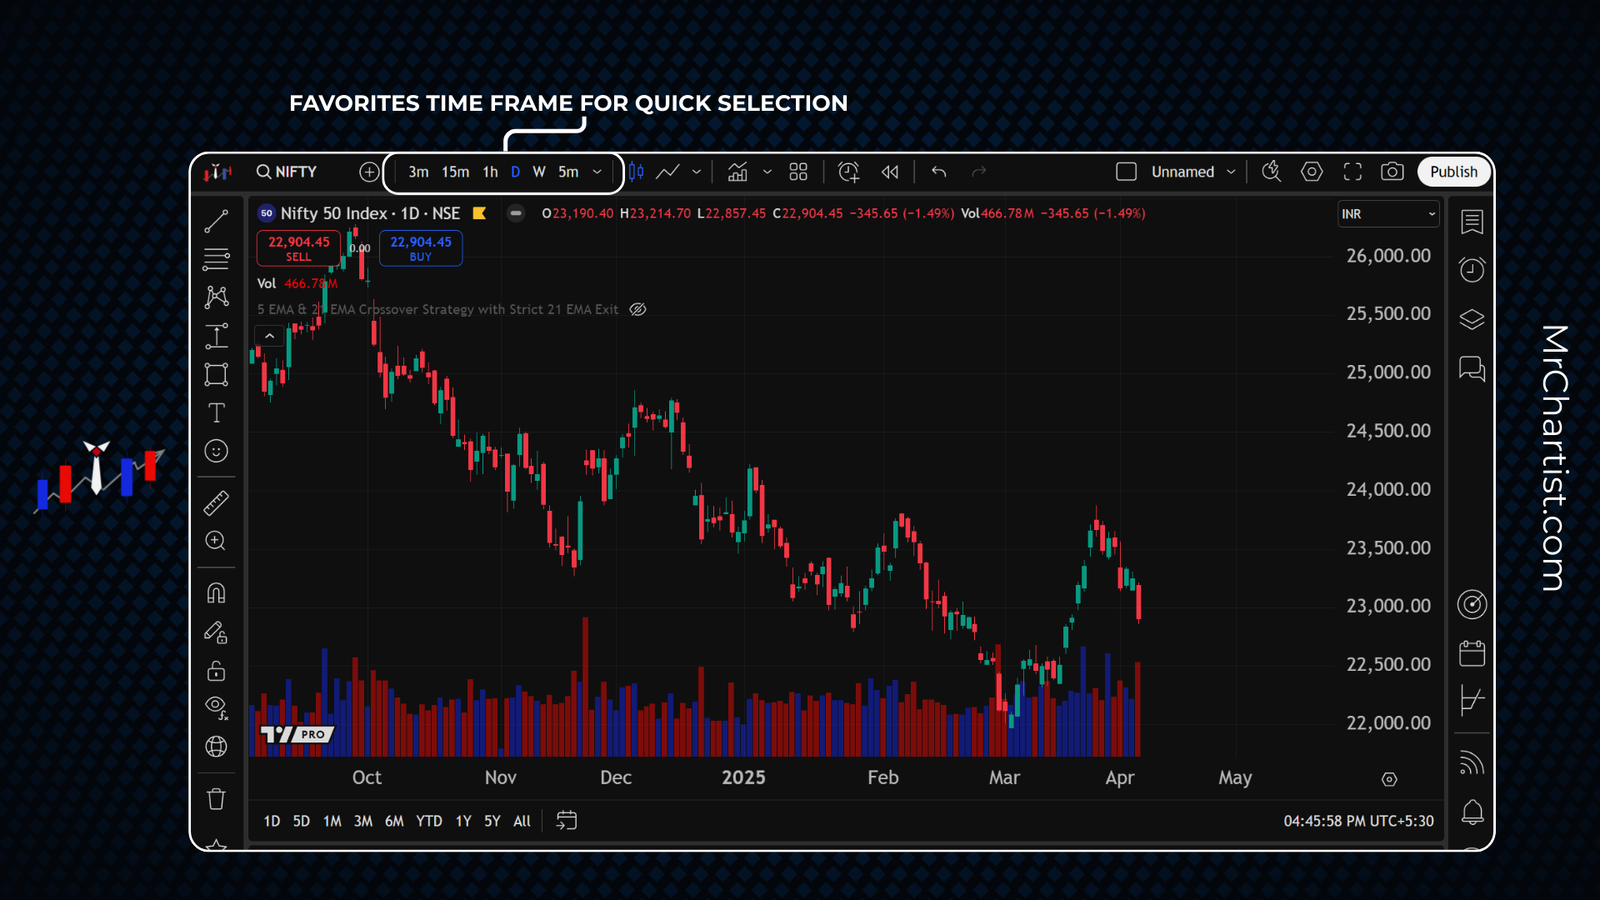
⭐ Step 5: Add Timeframes to Favorites
TradingView allows you to add your most-used timeframes to the top toolbar for quick, 1-click access. This feature is extremely helpful for traders who frequently switch between different intervals—like 5m for entries and 1D for trend analysis.
By starring your favorite timeframes, you create a custom shortcut bar that appears right beside the symbol input—making your workflow smoother and faster during market hours.
📌 How to Add a Timeframe to Favorites:
- Click on the Timeframe Selector from the top toolbar.
- Hover over any timeframe (e.g.
15m,1h,4h). - Click the star ⭐ icon next to that interval. It will now be pinned to the toolbar.
✨ Once added, these starred timeframes appear as clickable buttons, giving you ultra-fast control without opening the menu again.
💡 Why Use Favorites?
- Switch faster between scalping and positional timeframes
- Avoid navigating long menus during live trades
- Maintain consistent analysis structure (Top-Down Approach)
- Favorites are synced across all devices — desktop, mobile, and tablet
1W → 1D → 15m for top-down confirmation. It saves precious time and avoids analysis errors.
🔍 Step 6: Multi-Timeframe Analysis Strategy
Multi-Timeframe Analysis (MTFA) is a powerful charting strategy used by professional traders to align short-term entries with long-term trends. Instead of relying on just one chart timeframe, MTFA allows you to view the market from multiple perspectives—enhancing your accuracy and timing.
In TradingView, switching between different timeframes is seamless and fast, which makes it ideal for executing MTFA with confidence. Whether you’re scalping or investing long-term, this approach helps you validate signals, reduce noise, and improve your overall edge.
🧠 What is Multi-Timeframe Analysis?
MTFA involves analyzing charts at different intervals to understand the big picture (macro trend), medium-term structure, and short-term opportunities. It’s the best way to avoid false entries and poor timing.
📊 Example of Top-Down MTFA Flow:
- Monthly: Identify the long-term macro trend
- Weekly: Observe swing highs/lows, support/resistance
- Daily: Look for trade setup patterns like flags, breakouts
- 15m or 5m: Execute precise entries using candlestick confirmation
💡 Why Use Multi-Timeframe Strategy?
- ✅ Confirm trend direction before taking trades
- ✅ Avoid trading against dominant momentum
- ✅ Align entries with structure & reduce false signals
- ✅ Find better stop loss placement and risk-reward
🧠 Step 7: Pro Tips for Timeframe Efficiency
Whether you’re scalping or analyzing long-term trends, these expert tips help you use timeframes on TradingView more efficiently. Organized into a practical reference table below, these insights help speed up decision-making, reduce mistakes, and maintain clarity across your charting workflow.
| 🔧 Tip | 💡 Description |
|---|---|
| Combine Indicators with Timeframes | Confirm signals by checking indicators (like RSI/EMA) across multiple timeframes. An overbought RSI on 5m might not hold on 1D. |
| Top-Down Analysis | Always begin with higher timeframes (1M → 1W → 1D → 15m) to align trades with major trends and avoid false entries. |
| Star Timeframes | Mark frequently used intervals like 15m, 1D, or 1W as favorites for 1-click switching. |
| Create Strategy-Based Layouts | Save layouts such as “Swing View” or “Intraday Setup” with predefined timeframes and templates for faster strategy switching. |
| Avoid Over-Switching | Stick to 2–3 consistent timeframes to avoid decision fatigue. Over-checking too many intervals creates confusion. |
| Label & Save Layouts | Give layouts memorable names like “Nifty Daily MTF” to avoid misclicks and help manage analysis flow across devices. |
| Use Keyboard Shortcuts | Type timeframes directly (e.g., 15 + Enter for 15-minute). You can also use suffixes like 1D, 1W, 1M for daily, weekly, monthly charts. |
📌 Step 8: Mistakes to Avoid When Using Timeframes in TradingView
Even experienced traders can fall into dangerous habits when using multiple timeframes. These mistakes can lead to late entries, conflicting signals, or missed opportunities. By becoming aware of these traps, you can streamline your analysis and improve trade execution.
| ⚠️ Mistake | 🧠 Why It’s Harmful | ✅ What to Do Instead |
|---|---|---|
| Using Only One Timeframe | Limits your view of the bigger trend and increases risk of fake breakouts or trend reversals. | Always perform top-down analysis using 2–3 timeframes. |
| Over-Switching Timeframes | Creates confusion and leads to indecision by viewing the same price in multiple conflicting ways. | Stick to your strategy-defined intervals (like 1D + 15m). |
| Ignoring Higher Timeframes | You may enter trades against the dominant trend unknowingly. | Check 1D or 1W to confirm direction before entering lower timeframes. |
| Misinterpreting Candlesticks | A strong signal on 5m could be noise on 1H. Acting without context increases false trades. | Analyze price action in relation to bigger intervals. |
| Not Saving Layouts | Risk of losing analysis when browser resets or switches between devices. | Save your layout after setting key timeframes and tools. |
| Relying on Auto-Save | Auto-save may not catch your last changes, especially during fast trading sessions. | Click “Save” manually after major updates to your layout. |
| Not Pinning Favorites | Wastes time during fast trading when you need to switch intervals quickly. | Use ⭐ to pin your go-to timeframes like 5m, 15m, and 1D. |
| Wrong Timeframe for Your Strategy | Leads to missed signals or getting stopped out due to mismatch in volatility and holding period. | Match timeframe to style: 1m–5m for scalping, 1D for swing, 1W for long-term. |
🚀 Ready to Master Timeframes on TradingView?
You’ve now unlocked the full potential of TradingView’s Timeframe Selector. From scalping in seconds to planning long-term investments, you now understand how to navigate, customize, and analyze across multiple intervals with confidence.
Time to apply this knowledge and elevate your trading journey!