Coming Soon
The Weekend Visual ChartBook is currently undergoing a massive upgrade. Stay tuned for a world-class reading experience.
Return HomeWeekend Visual ChartBook
Edition #268
Extracted Edition
Market Pulse
LiveReal-time index prices above. Detailed index chart analysis below in the Indices section.
Bullish Charts [F&O]
Breakout and momentum setups from the F&O universe
BAJAJ AUTO LTD
bullish fnoThe breakout was accompanied by large bullish candles with minimal wicks, reflecting
Descending Channel Pattern [7 Months]
Thesis & Analysis
Price Action Overview: Bajaj Auto was moving within a well-defined descending channel for the past 7 months. This channel was respected by both lower highs and lower lows, indicating a prolonged downtrend. However, the recent price action shows a strong breakout above the upper boundary of this channel, signaling a potential reversal or the beginning of a fresh uptrend. Post breakout, the price surged out of a small box consolidation and has followed through aggressively. The breakout occurred after multiple rejections at the upper channel line, increasing its significance. Candlestick Pattern: The breakout was accompanied by large bullish candles with minimal wicks, reflecting conviction from buyers. There's no sign of exhaustion yet, although minor pullbacks can be expected due to the steep rise. Volume Analysis: Volume spiked during the breakout, lending credibility to the move. Sustained higher volumes in follow-up sessions would reinforce the strength of the reversal and continuation potential. 2. Crucial Support and Resistance Levels Support Levels: 8,200–8,000: Breakout zone and immediate short-term support. 7,600: Lower boundary of the recent consolidation range. 7,100: Channel base and major swing low; long-term support. Resistance Levels: 9,200: Initial upside target based on breakout momentum. 10,000–10,200: Key psychological and structural resistance zone. 12,774: Previous all-time high; long-term resistance target. 3. Strategic Trade Scenarios Bullish Scenario: If price sustains above 8,200, this breakout could drive the stock higher toward 9,200, with a potential extension to 10,000–10,200. A continuation with bullish candles and strong volume would confirm this path. Bearish Scenario: If the stock falls back below 8,000 and fails to reclaim the breakout level quickly, it could signal a false breakout. This may lead to a retest of 7,600, or deeper correction toward the channel base at 7,100.
Price Action
- ■Price action is structurally positive.
- ■Forming higher highs and higher lows.
Volume Profile
- ■Volume is supportive of the price action.
- ■Wait for volume expansion on breakout.
Key Levels
No zones specified
No zones specified
Invalidation Scenario
A weekly close below the support level invalidates this structure.

PI INDUSTRIES LTD
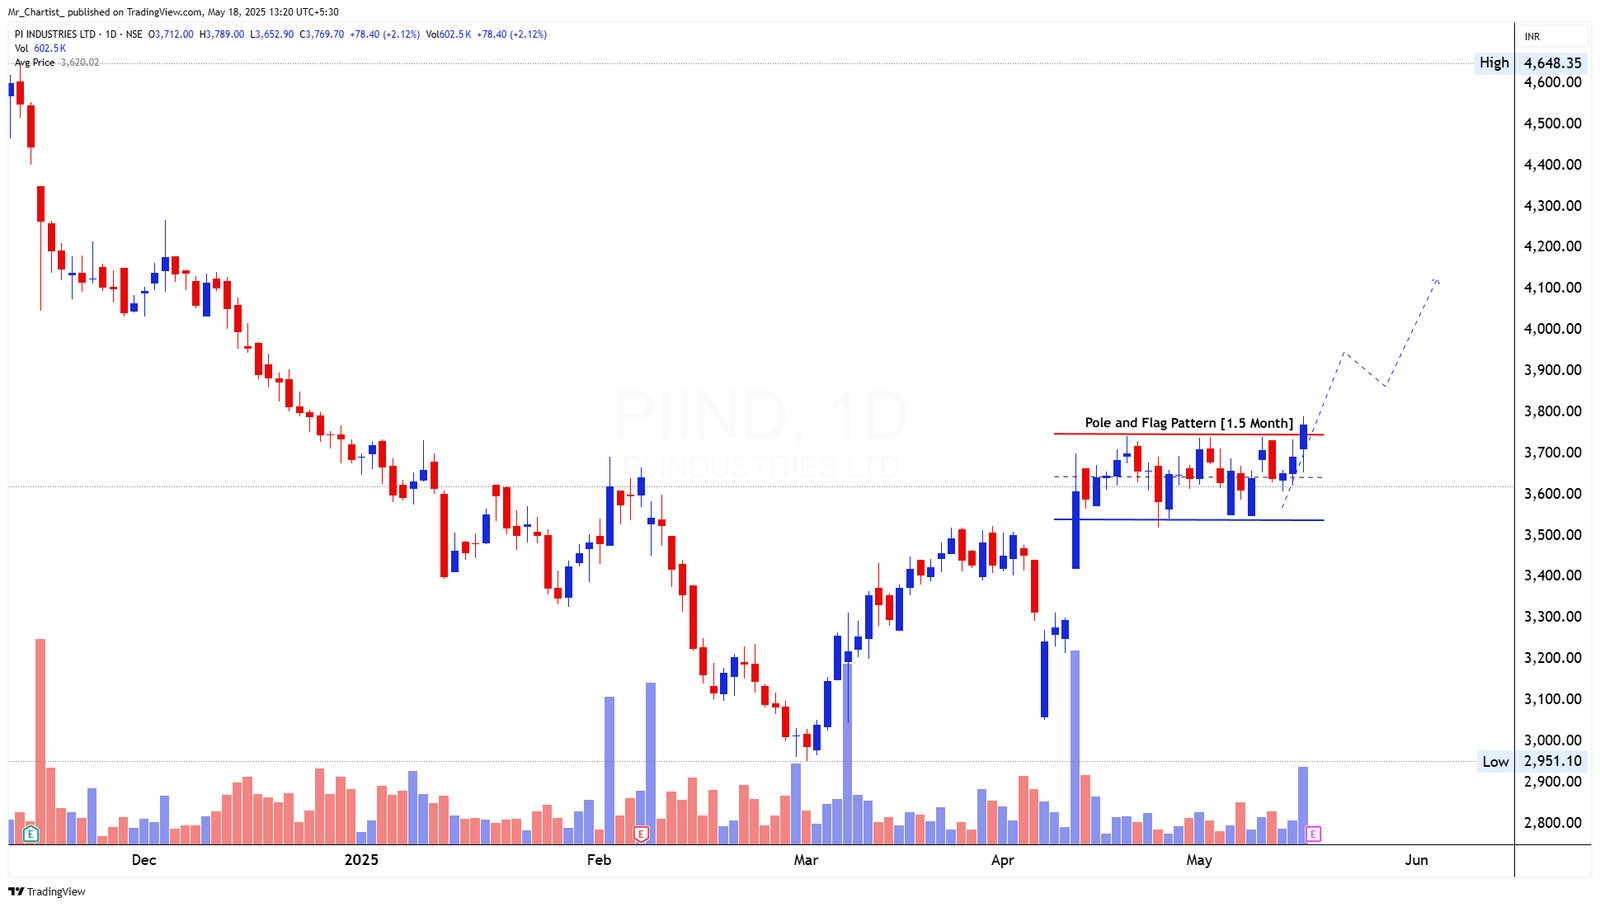
bullish fnoA strong bullish candle has emerged after several small-bodied consolidative
Pole and Flag Pattern [1.5 Months]
Thesis & Analysis
Price Action Overview: PI Industries formed a Pole and Flag pattern over the last 1.5 months, a classic bullish continuation formation. The sharp rally leading into April established the pole, and since then, the price has been consolidating within a narrow range, forming the flag. Today’s candle reflects a breakout attempt from the flag’s upper boundary near ₹3,760. If this breakout holds above the recent range high, it could signal the start of a fresh leg up, continuing the bullish structure. Candlestick Pattern: A strong bullish candle has emerged after several small-bodied consolidative candles, suggesting renewed buying interest. No reversal patterns are visible within the flag. Volume Analysis: Volume has noticeably picked up during the breakout session, validating the bullish move. This volume surge supports the view of an authentic breakout, increasing the probability of sustained upside. 2. Crucial Support and Resistance Levels Support Levels: ₹3,600–3,550: Base of the flag formation; immediate support zone. ₹3,400: Prior breakout zone; key intermediate cushion. ₹2,950: Recent swing low and broader support level. Resistance Levels: ₹3,800–3,820: Immediate resistance above flag top; watch for confirmation. ₹4,100: Measured target from the flag breakout. ₹4,600+: Previous high and potential extended target. 3. Strategic Trade Scenarios Bullish Scenario: If PI Industries sustains above ₹3,760–3,800, the flag breakout will confirm with an upside projection toward ₹4,100, and possibly higher toward ₹4,600+ in a momentum-driven move. Bearish Scenario: If the stock fails to hold above ₹3,600 and slips back inside the flag, it could trigger a correction toward ₹3,400 or even ₹2,950 in a deeper retracement.
Price Action
- ■Price action is structurally positive.
- ■Forming higher highs and higher lows.
Volume Profile
- ■Volume is supportive of the price action.
- ■Wait for volume expansion on breakout.
Key Levels
No zones specified
No zones specified
Invalidation Scenario
A weekly close below the support level invalidates this structure.
EXIDE INDUSTRIES LTD
bullish fnoThe breakout was marked by wide-bodied bullish candles with strong follow-
Descending Channel Pattern [1 Year]
Thesis & Analysis
Price Action Overview: Exide Industries has been locked in a long-term descending channel for the past year, respecting the falling resistance and support trendlines. However, the recent price action shows a clear breakout from this channel, indicating a likely end to the prolonged downtrend. Following several months of base-building and higher lows, the price has finally surged past the ₹390 resistance, breaking through both the horizontal level and the upper channel line with conviction. This signals a trend reversal and marks the beginning of a new bullish phase. Candlestick Pattern: The breakout was marked by wide-bodied bullish candles with strong follow- through. There is no reversal signal yet, and momentum remains strong into the breakout. Volume Analysis: Volume has notably expanded during the breakout move, confirming strong participation and adding credibility to the breakout. Sustained high volume in follow- up sessions would further strengthen the bullish case. 2. Crucial Support and Resistance Levels Support Levels: ₹390: Fresh breakout level; immediate support to watch. ₹370: Previous consolidation zone and breakout base. ₹328: Long-term bottom and structural low. Resistance Levels: ₹420–₹430: Minor intermediate resistance based on prior price congestion. ₹460–₹480: Projected move based on channel breakout height. ₹500+: Psychological barrier and long-term structural resistance. 3. Strategic Trade Scenarios Bullish Scenario: If price holds above ₹390, the breakout remains valid, with near-term upside toward ₹430, and potentially extending to ₹460–480. Continued momentum with bullish candles would validate this trend reversal. Bearish Scenario: If Exide slips below ₹390, it may retest ₹370 as a near-term base. A breakdown below ₹370 could drag the stock back to the ₹328 zone, weakening the bullish setup
Price Action
- ■Price action is structurally positive.
- ■Forming higher highs and higher lows.
Volume Profile
- ■Volume is supportive of the price action.
- ■Wait for volume expansion on breakout.
Key Levels
No zones specified
No zones specified
Invalidation Scenario
A weekly close below the support level invalidates this structure.
OBEROI REALTY LTD
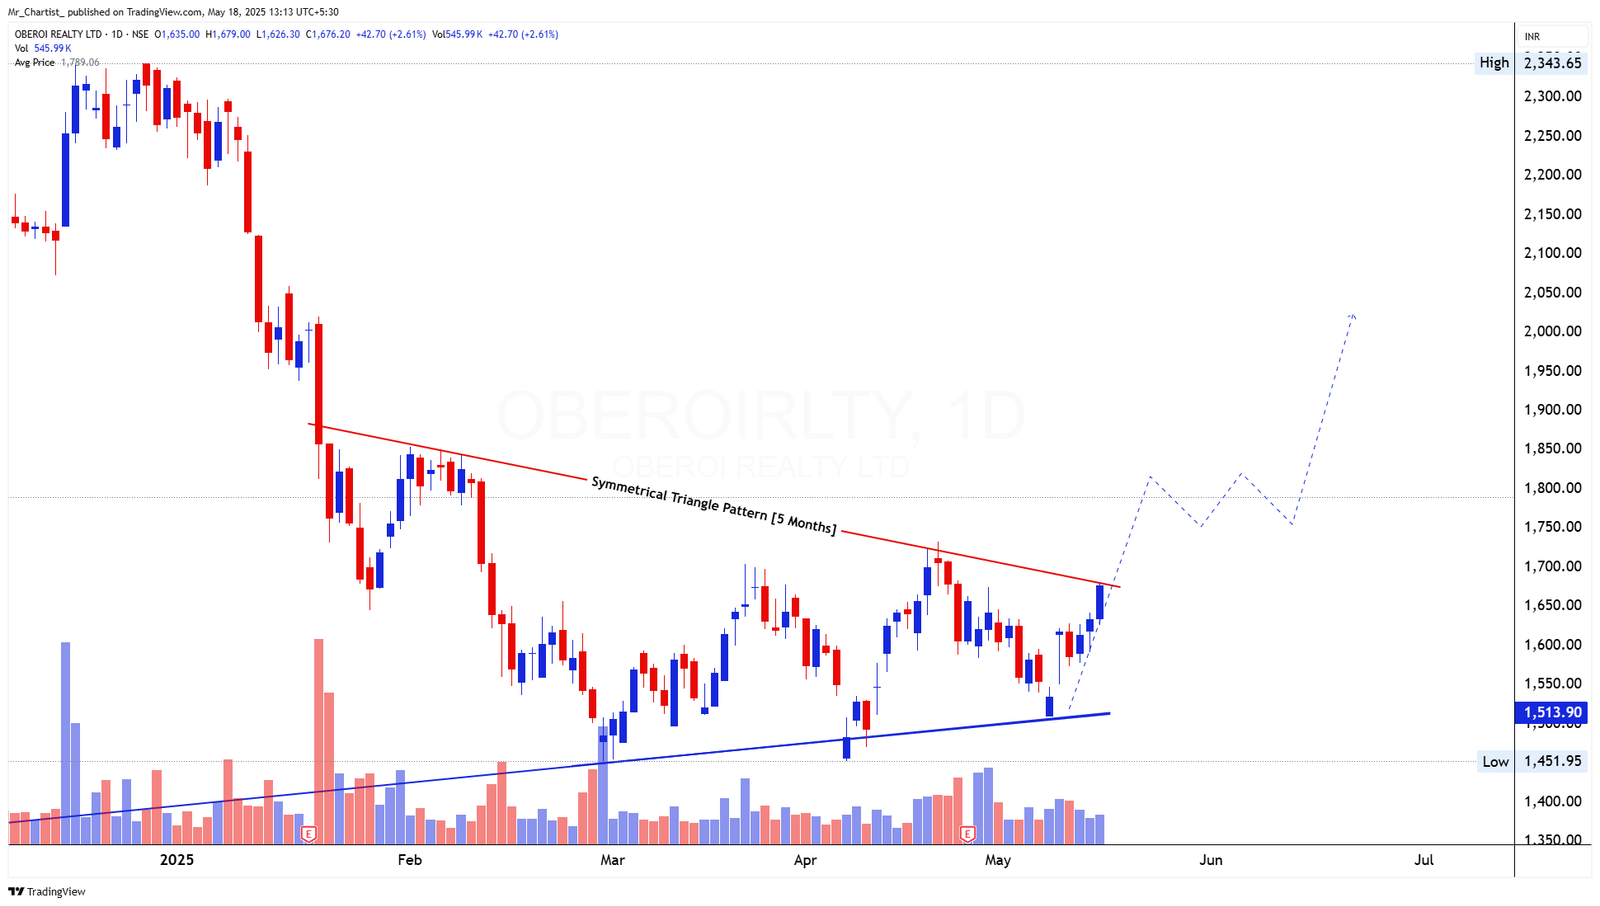
bullish fnoNo clear reversal candle yet, but the most recent weekly candles show a small rounded
Daily Chart
Thesis & Analysis
No detailed thesis provided for this setup.
Price Action
- ■Price action is structurally positive.
- ■Forming higher highs and higher lows.
Volume Profile
- ■Volume is supportive of the price action.
- ■Wait for volume expansion on breakout.
Key Levels
No zones specified
No zones specified
Invalidation Scenario
A weekly close below the support level invalidates this structure.

DEEPAK NITRITE LTD
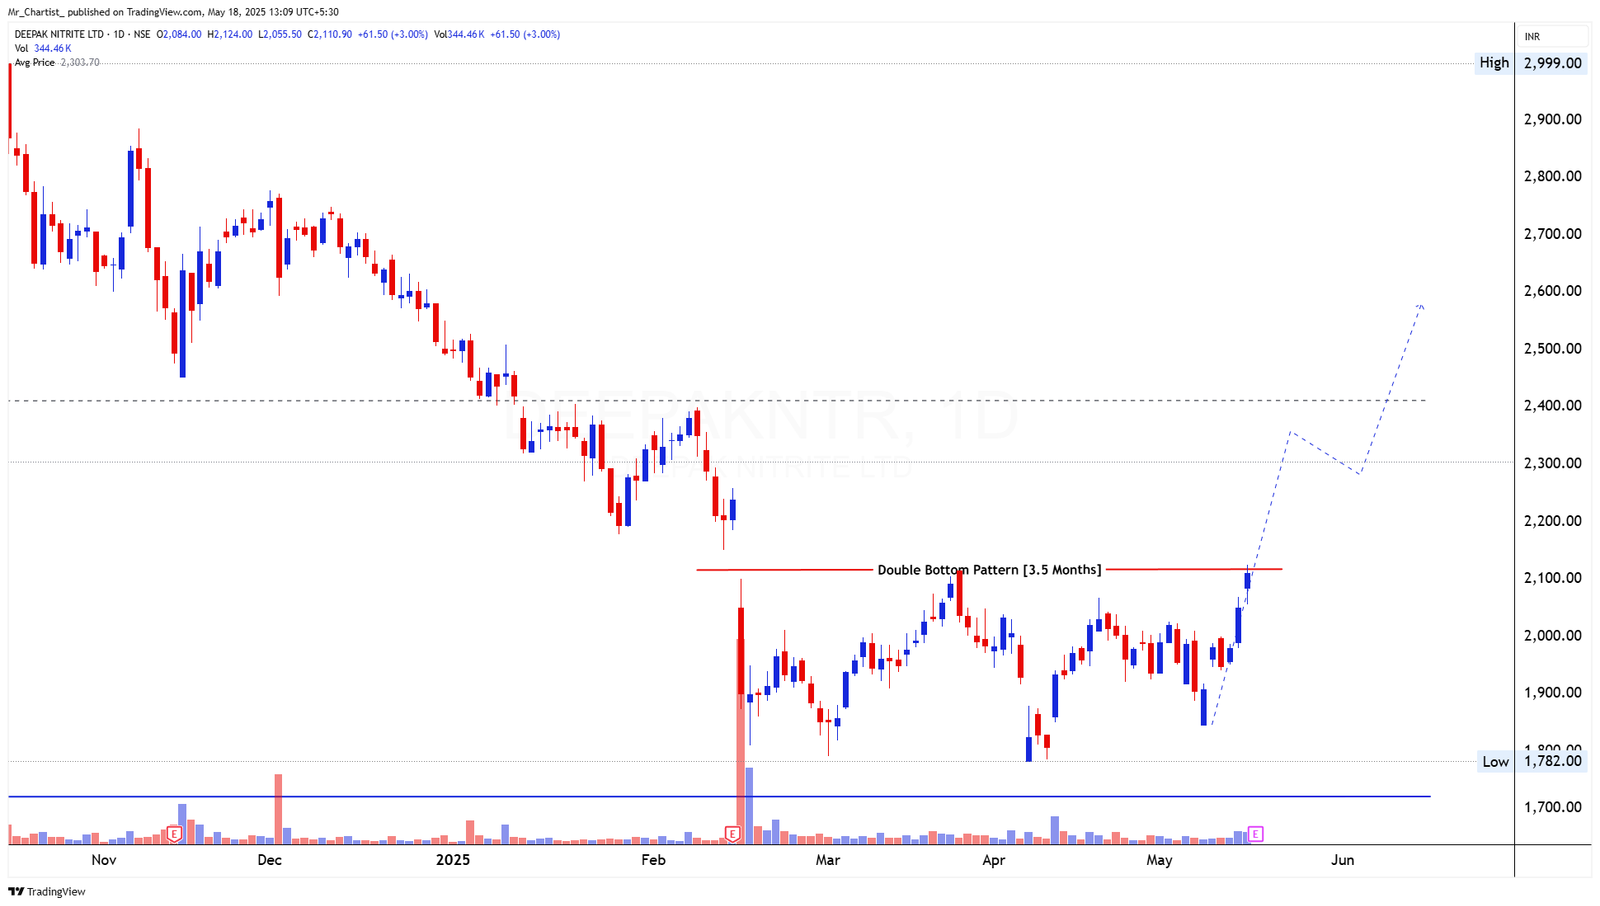
bullish fnoDaily: Bullish breakout candle from the double bottom neckline.
Daily Chart
Thesis & Analysis
No detailed thesis provided for this setup.
Price Action
- ■Price action is structurally positive.
- ■Forming higher highs and higher lows.
Volume Profile
- ■Volume is supportive of the price action.
- ■Wait for volume expansion on breakout.
Key Levels
No zones specified
No zones specified
Invalidation Scenario
A weekly close below the support level invalidates this structure.
NHPC LTD
bullish fnoA large bullish candle has formed near the neckline, hinting at a breakout attempt.
Cup and Handle Pattern [7 Months]
Thesis & Analysis
Price Action Overview: NHPC has developed a 7-month Cup and Handle pattern, a bullish continuation setup that typically signals accumulation followed by breakout potential. The rounded base (the “cup”) formed over several months, followed by a shallower dip forming the “handle.” The price is now retesting the ₹91.50 neckline resistance, where previous attempts were rejected. The handle structure has broken to the upside, and current momentum suggests a likely breakout if sustained buying continues. Candlestick Pattern: A large bullish candle has formed near the neckline, hinting at a breakout attempt. Previous rejection zones are now being tested again with strength and conviction. Volume Analysis: Volume has picked up significantly in recent sessions, especially during the latest rally forming the right side of the handle. This indicates renewed accumulation and adds strength to the pattern breakout potential. 2. Crucial Support and Resistance Levels Support Levels: ₹85–₹84: Handle breakout base and short-term demand zone. ₹78–₹76: Deeper support within the cup base. ₹71: Major swing low and cup foundation; long-term support. Resistance Levels: ₹91.50: Neckline and critical breakout zone. ₹100–₹104: Measured breakout target based on cup depth. ₹118.40: Previous high and extended resistance. 3. Strategic Trade Scenarios Bullish Scenario: If price closes above ₹91.50, it would confirm the cup and handle breakout, projecting an upside move toward ₹100–₹104, and potentially ₹118 in an extended run. Bearish Scenario: Failure to break above ₹91.50 followed by a drop below ₹85 would invalidate the immediate setup and likely trigger a pullback toward ₹78–₹76.
Price Action
- ■Price action is structurally positive.
- ■Forming higher highs and higher lows.
Volume Profile
- ■Volume is supportive of the price action.
- ■Wait for volume expansion on breakout.
Key Levels
No zones specified
No zones specified
Invalidation Scenario
A weekly close below the support level invalidates this structure.
HUDCO
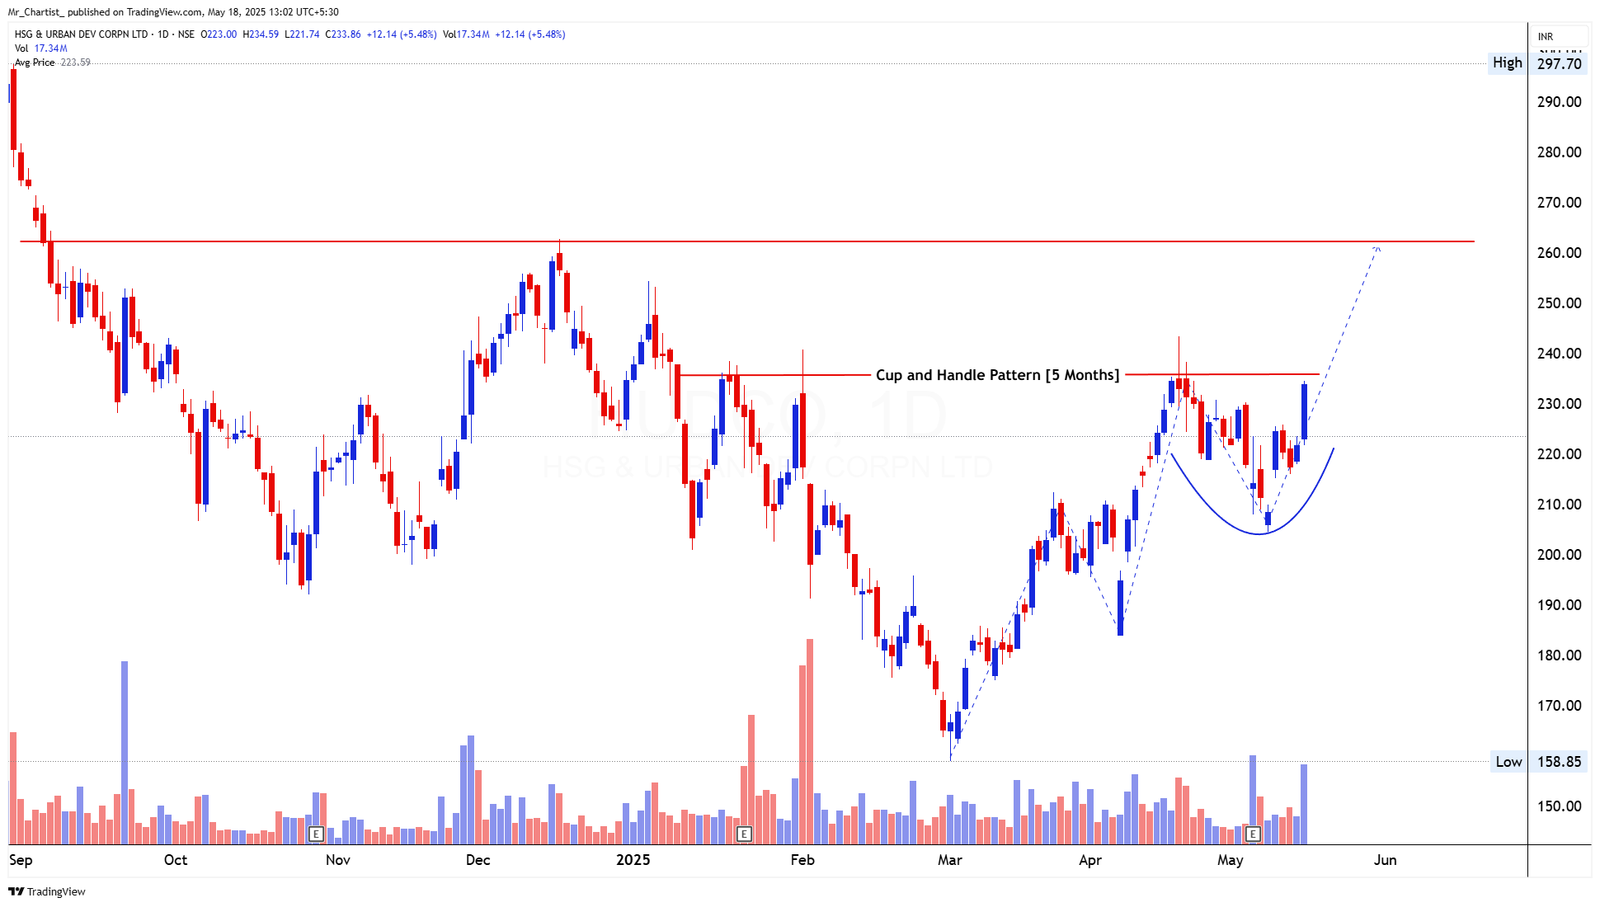
bullish fnoThe breakout candle is a bullish marubozu-type bar, closing near the high of the
Cup and Handle Pattern [5 Months]
Thesis & Analysis
Price Action Overview: HUDCO has completed a well-formed Cup and Handle pattern spanning over 5 months. The rounded base of the cup reflects long-term accumulation, while the handle dip from late April through early May is characteristic of this bullish continuation setup. The recent candle has shown a strong breakout attempt above the handle resistance around ₹230, closing with a wide-bodied bullish bar and high momentum. This signals a potential trend continuation and possible retest of prior highs. Candlestick Pattern: The breakout candle is a bullish marubozu-type bar, closing near the high of the day, and supported by strong body range – indicating institutional buying strength. Volume Analysis: There is a noticeable volume surge during the breakout, reinforcing conviction behind the move and suggesting that the price action is supported by strong demand. 2. Crucial Support and Resistance Levels Support Levels: ₹225–₹220: Recent breakout and handle resistance; now key support. ₹210–₹205: Mid-handle consolidation support. ₹190: Cup base and structural support level. Resistance Levels: ₹240: Immediate swing high resistance near pattern breakout zone. ₹260: Measured target based on cup depth; key extension level. ₹297.70: Previous high and long-term resistance. 3. Strategic Trade Scenarios Bullish Scenario: If price sustains above ₹235, it confirms the cup and handle breakout, with upside projections toward ₹260 as the first target, followed by ₹297+ if the rally extends. Bearish Scenario: A close below ₹220 could weaken the breakout structure and may lead to a corrective retest toward ₹210–₹205. A deeper failure would re-test the cup base at ₹190.
Price Action
- ■Price action is structurally positive.
- ■Forming higher highs and higher lows.
Volume Profile
- ■Volume is supportive of the price action.
- ■Wait for volume expansion on breakout.
Key Levels
No zones specified
No zones specified
Invalidation Scenario
A weekly close below the support level invalidates this structure.
CONCOR
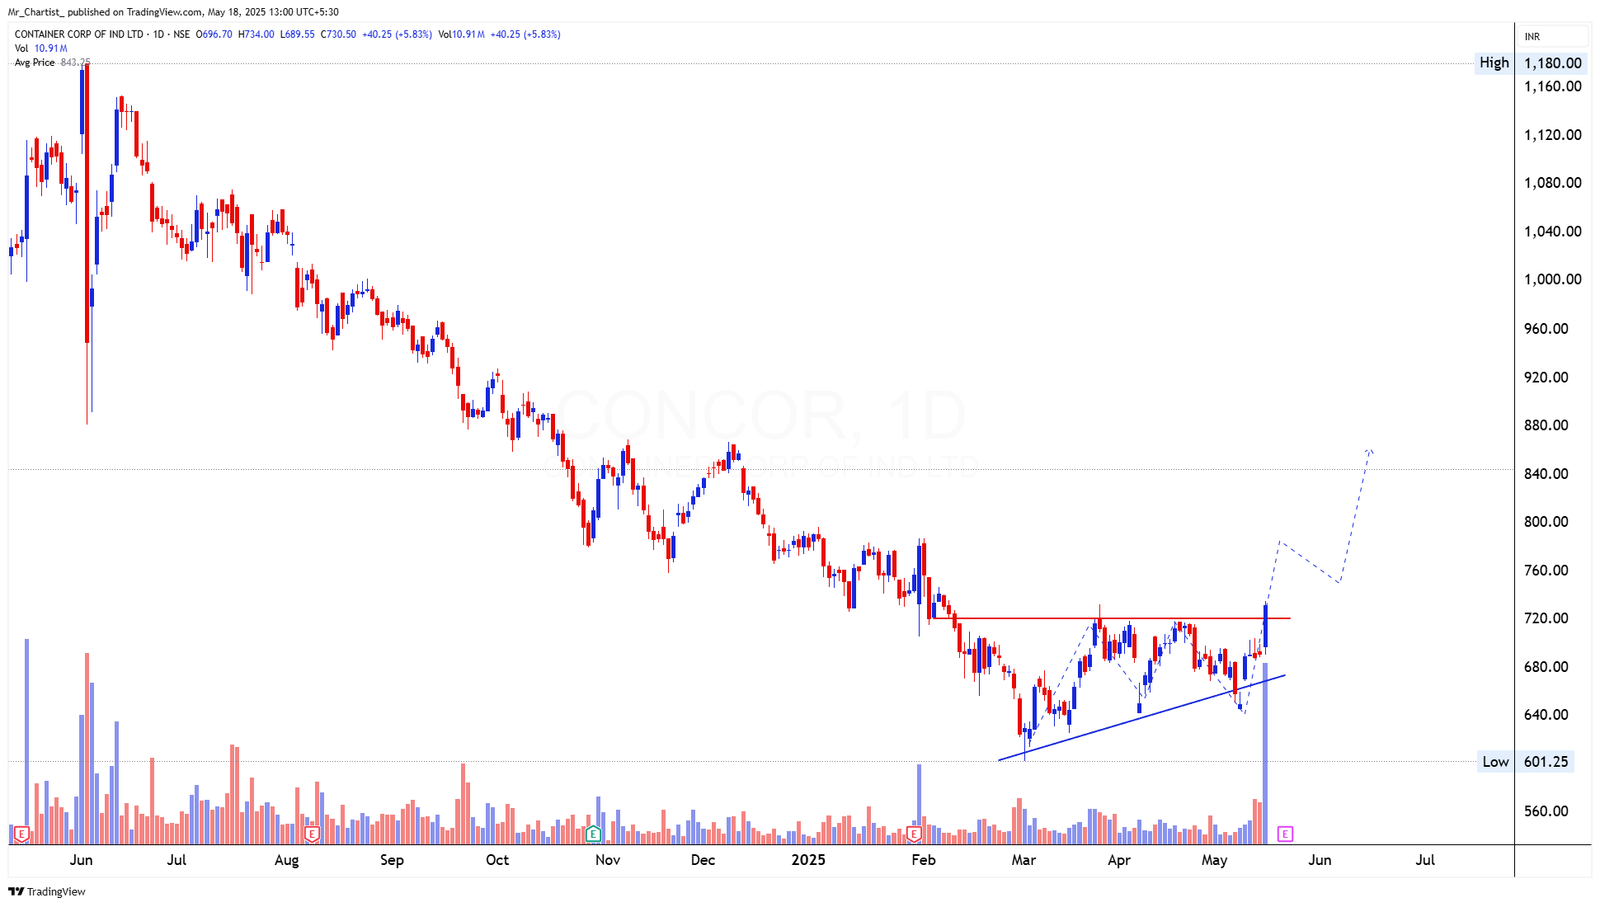
bullish fnoThe breakout candle is large and bullish, closing near the day’s high. It invalidates
Ascending Triangle Pattern [3 Months]
Thesis & Analysis
Price Action Overview: CONCOR has developed a classic Ascending Triangle Pattern over the past 3 months, with horizontal resistance at around ₹720–₹725, and a series of higher lows indicating accumulation and bullish intent. In today’s session, the price has shown a decisive breakout above the resistance, with a large bullish candle supported by a massive volume spike. This breakout indicates a shift in control from consolidation to potential trend expansion. Candlestick Pattern: The breakout candle is large and bullish, closing near the day’s high. It invalidates recent indecision and confirms the triangle pattern resolution in favor of bulls. Volume Analysis: Volume is the strongest in months, confirming the authenticity of the breakout. Rising volume with rising price often precedes a strong follow-through. 2. Crucial Support and Resistance Levels Support Levels: ₹720–₹710: Breakout zone, now acting as immediate support. ₹680–₹670: Ascending trendline zone; former consolidation base. ₹640: Deeper support and prior higher low. Resistance Levels: ₹780–₹800: First target zone based on pattern projection. ₹850–₹870: Extended breakout target from measured triangle height. ₹1,180: Previous swing high and long-term resistance. 3. Strategic Trade Scenarios Bullish Scenario: Sustaining above ₹725–₹730 confirms the ascending triangle breakout, projecting near-term targets of ₹780–₹800, with potential upside to ₹850+ in continuation. Bearish Scenario: If the breakout fails and price falls below ₹710, a false breakout scenario could unfold. Further breakdown below ₹680 would weaken the structure and invite selling pressure toward ₹640.
Price Action
- ■Price action is structurally positive.
- ■Forming higher highs and higher lows.
Volume Profile
- ■Volume is supportive of the price action.
- ■Wait for volume expansion on breakout.
Key Levels
No zones specified
No zones specified
Invalidation Scenario
A weekly close below the support level invalidates this structure.
CROMPTON
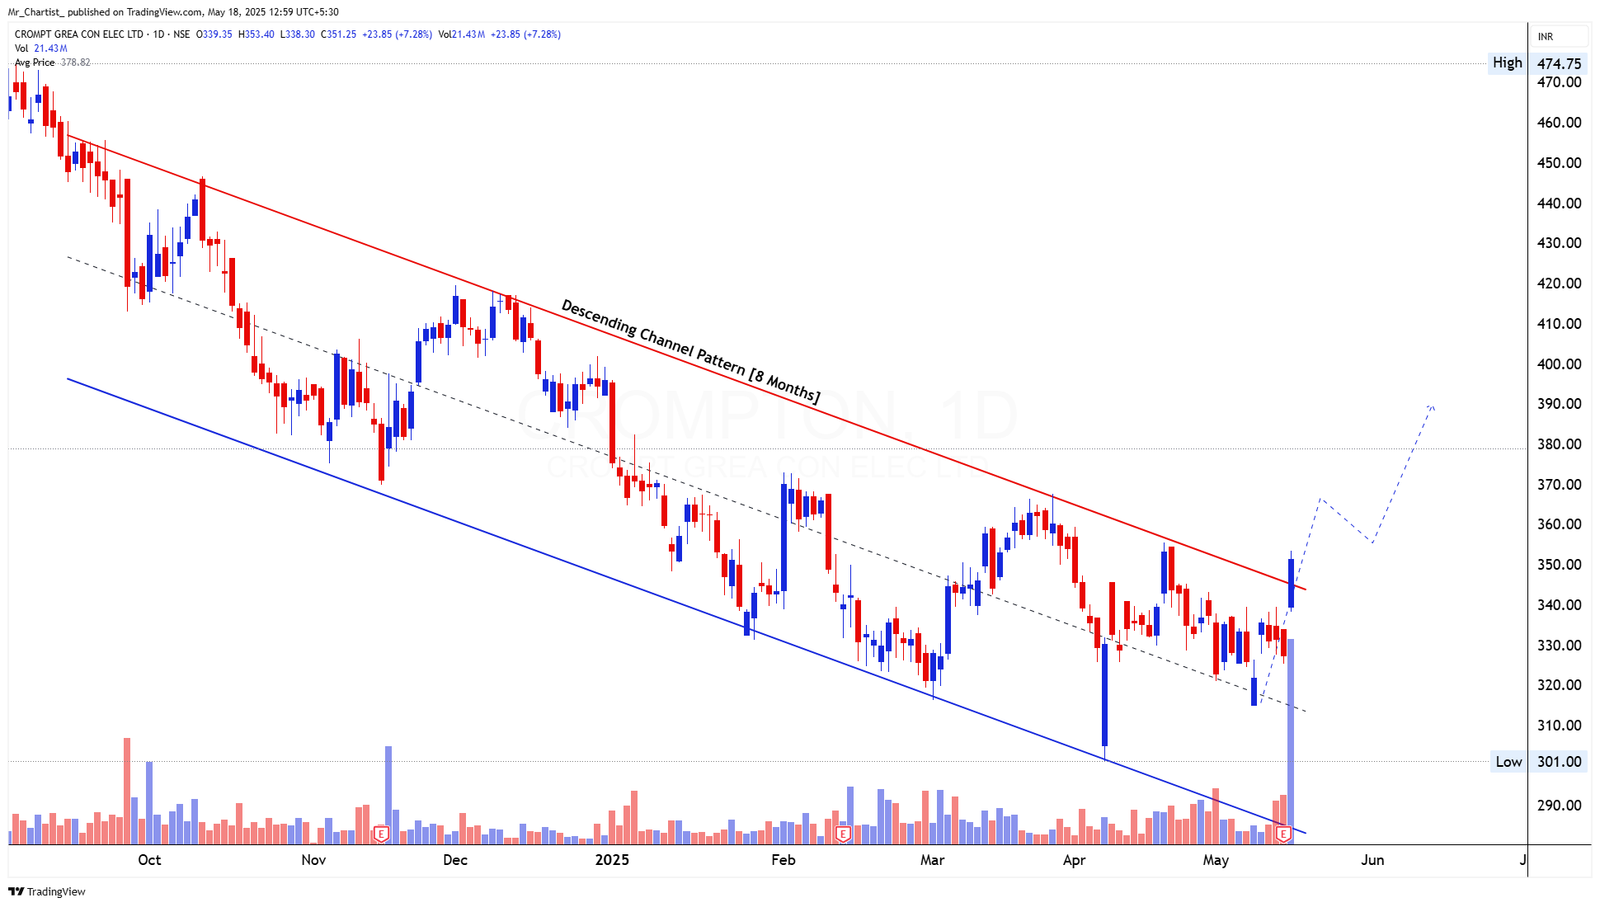
bullish fnoA large bullish candle has emerged, decisively breaking above the falling
Descending Channel Pattern [8 Months]
Thesis & Analysis
Price Action Overview: CROMPTON has been trending within a descending channel for the last 8 months, facing consistent pressure from lower highs and lower lows. However, the latest session has resulted in a strong breakout above the upper boundary of this channel, signaling a reversal from the prolonged downtrend. This breakout is supported by a dramatic recovery from the lower channel zone and a sustained push through the resistance line, shifting the bias to bullish for the near term. Candlestick Pattern: A large bullish candle has emerged, decisively breaking above the falling trendline. This candlestick represents a key breakout bar with minimal wick, indicating strong buying conviction. Volume Analysis: Volume spiked sharply during the breakout session—the highest in recent months —reinforcing the credibility of this breakout and suggesting institutional accumulation. 2. Crucial Support and Resistance Levels Support Levels: ₹340–₹335: Immediate breakout support zone; a critical retest area. ₹320: Former consolidation base within the channel. ₹301: Channel bottom and recent swing low. Resistance Levels: ₹370–₹375: Minor resistance near short-term price congestion. ₹390–₹400: Measured move from channel breakout. ₹430: Previous major swing high and long-term resistance. 3. Strategic Trade Scenarios Bullish Scenario: If the stock holds above ₹340, the breakout remains intact, opening upside potential toward ₹375–₹390, and further toward ₹400+ on sustained momentum. Bearish Scenario: A drop below ₹335 could signal a failed breakout, potentially leading to a retest of ₹320 or even back to the ₹301 support base.
Price Action
- ■Price action is structurally positive.
- ■Forming higher highs and higher lows.
Volume Profile
- ■Volume is supportive of the price action.
- ■Wait for volume expansion on breakout.
Key Levels
No zones specified
No zones specified
Invalidation Scenario
A weekly close below the support level invalidates this structure.

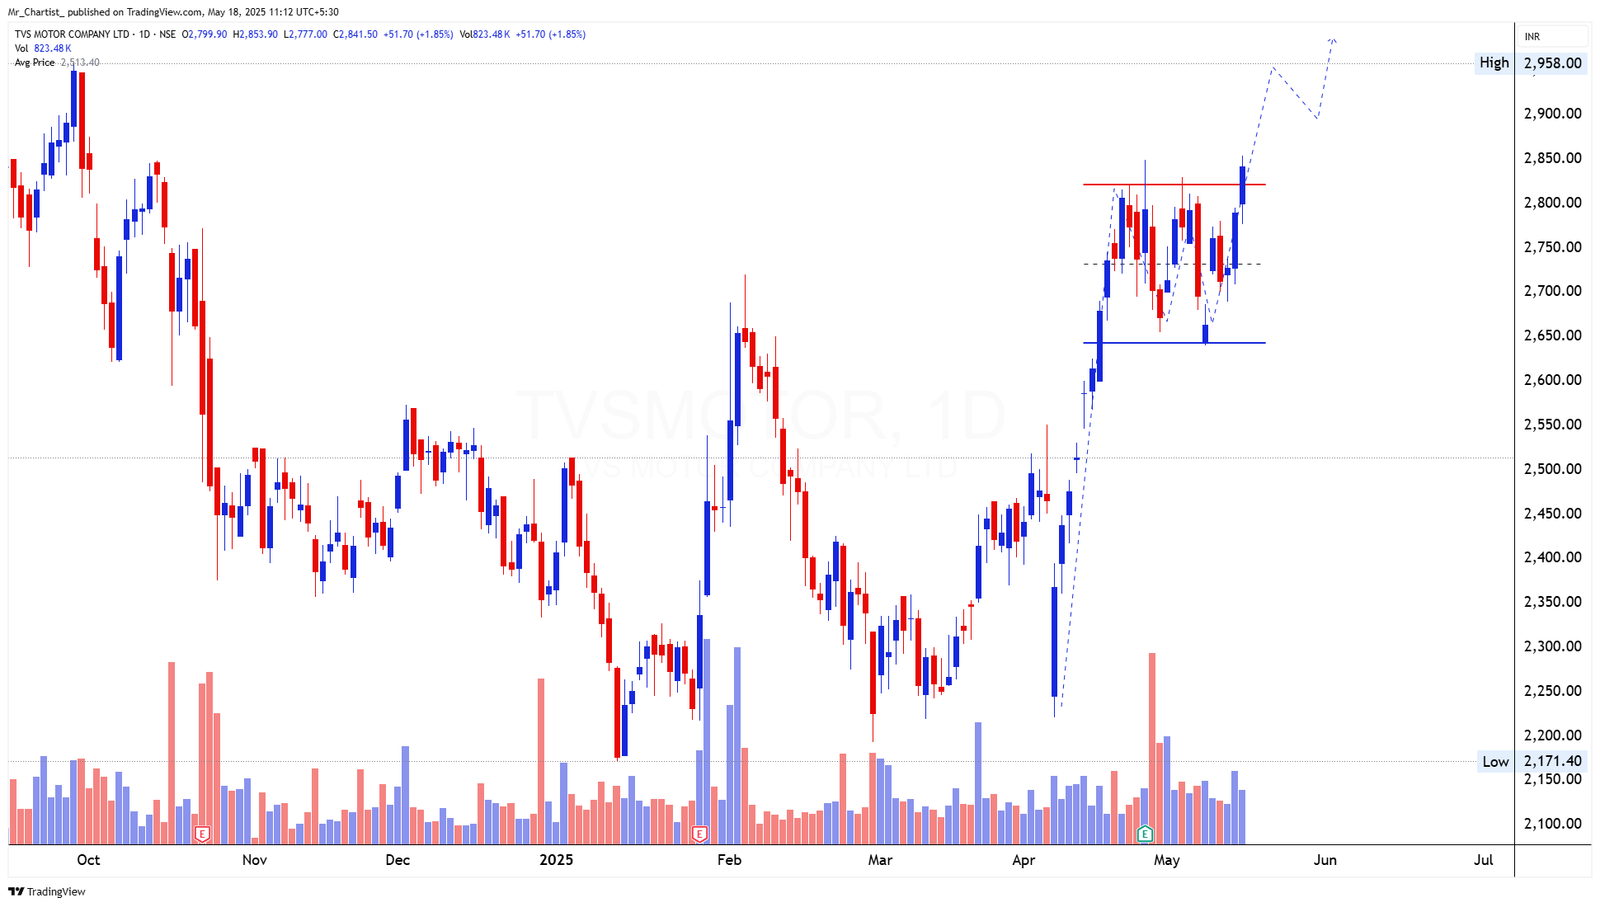
TVSMOTOR
bullish fnoA bullish engulfing-type breakout candle has emerged near the upper boundary,
Pole and Flag Pattern [1 Month]
Thesis & Analysis
Price Action Overview: TVSMOTOR formed a Pole and Flag pattern, where the strong vertical rise from early April formed the "pole", followed by a sideways consolidation phase between ₹2,650 and ₹2,850, forming the "flag". The current candle has attempted a breakout from the flag structure, signaling potential resumption of the prior uptrend. The price has closed at the upper edge of the flag zone, setting up for a possible continuation toward new highs. Candlestick Pattern: A bullish engulfing-type breakout candle has emerged near the upper boundary, indicating renewed bullish interest after weeks of range-bound movement. Volume Analysis: Volume shows a pick-up on breakout attempts, though consistent volume expansion during follow-through will be important for sustained momentum. 2. Crucial Support and Resistance Levels Support Levels: ₹2,750–₹2,720: Mid-flag support; minor pullback zone. ₹2,650: Flag base and critical support level. ₹2,400: Pre-breakout zone and structural base of pole. Resistance Levels: ₹2,850: Immediate resistance; flag breakout trigger. ₹2,930–₹2,950: All-time high and measured move zone. ₹3,000+: Psychological and round-number resistance. 3. Strategic Trade Scenarios Bullish Scenario: If TVSMOTOR sustains above ₹2,850, it confirms the flag breakout with a target range of ₹2,930–₹2,950, extending toward ₹3,000+. Sustained momentum and increasing volume would validate the breakout strength. Bearish Scenario: A failure to hold ₹2,850 and break below ₹2,750 may trigger a deeper pullback toward the ₹2,650 flag base. A drop below this zone would negate the pattern.
Price Action
- ■Price action is structurally positive.
- ■Forming higher highs and higher lows.
Volume Profile
- ■Volume is supportive of the price action.
- ■Wait for volume expansion on breakout.
Key Levels
No zones specified
No zones specified
Invalidation Scenario
A weekly close below the support level invalidates this structure.
TITAGARH
bullish fnoA large bullish Marubozu has formed on both daily and weekly charts, suggesting no
Rectangle Pattern [3 Months] + Horizontal
Thesis & Analysis
Support Retest [2 Years – Weekly] Price Action Overview: On the daily timeframe, TITAGARH has broken out of a 3-month Rectangle Pattern with sharp upside momentum. The stock had been consolidating in a narrow band between ₹675 and ₹835, forming a textbook range-bound setup. Today’s breakout above ₹835 was explosive, marking a strong shift from accumulation to breakout phase. On the weekly chart, this surge comes directly from a long-term horizontal support zone around ₹675–₹700, which has held firm for over 2 years, making this breakout multi-timeframe significant. Candlestick Pattern: A large bullish Marubozu has formed on both daily and weekly charts, suggesting no selling resistance during the breakout session. Volume Analysis: Volume exploded on both timeframes—daily and weekly—confirming the strength and validity of the breakout. This marks institutional-grade buying interest. 2. Crucial Support and Resistance Levels Support Levels: ₹835–₹820: Rectangle breakout zone; immediate support on retest. ₹780: Mid-range minor support. ₹675–₹700: Multi-month/weekly horizontal support base. Resistance Levels: ₹1,000: Psychological round number and pattern extension target. ₹1,140–₹1,180: Intermediate resistance from earlier congestion zones. ₹1,370: Previous major swing high. 3. Strategic Trade Scenarios Bullish Scenario: A sustained close above ₹835–₹850 confirms the Rectangle breakout with immediate targets at ₹1,000, and medium-term potential to ₹1,140+. Follow- through volume and higher closes will strengthen the setup. Bearish Scenario: Failure to hold ₹820 on pullbacks could invite retest toward ₹780–₹750. Breach below ₹700 would be structurally damaging and negate the breakout.
Price Action
- ■Price action is structurally positive.
- ■Forming higher highs and higher lows.
Volume Profile
- ■Volume is supportive of the price action.
- ■Wait for volume expansion on breakout.
Key Levels
No zones specified
No zones specified
Invalidation Scenario
A weekly close below the support level invalidates this structure.
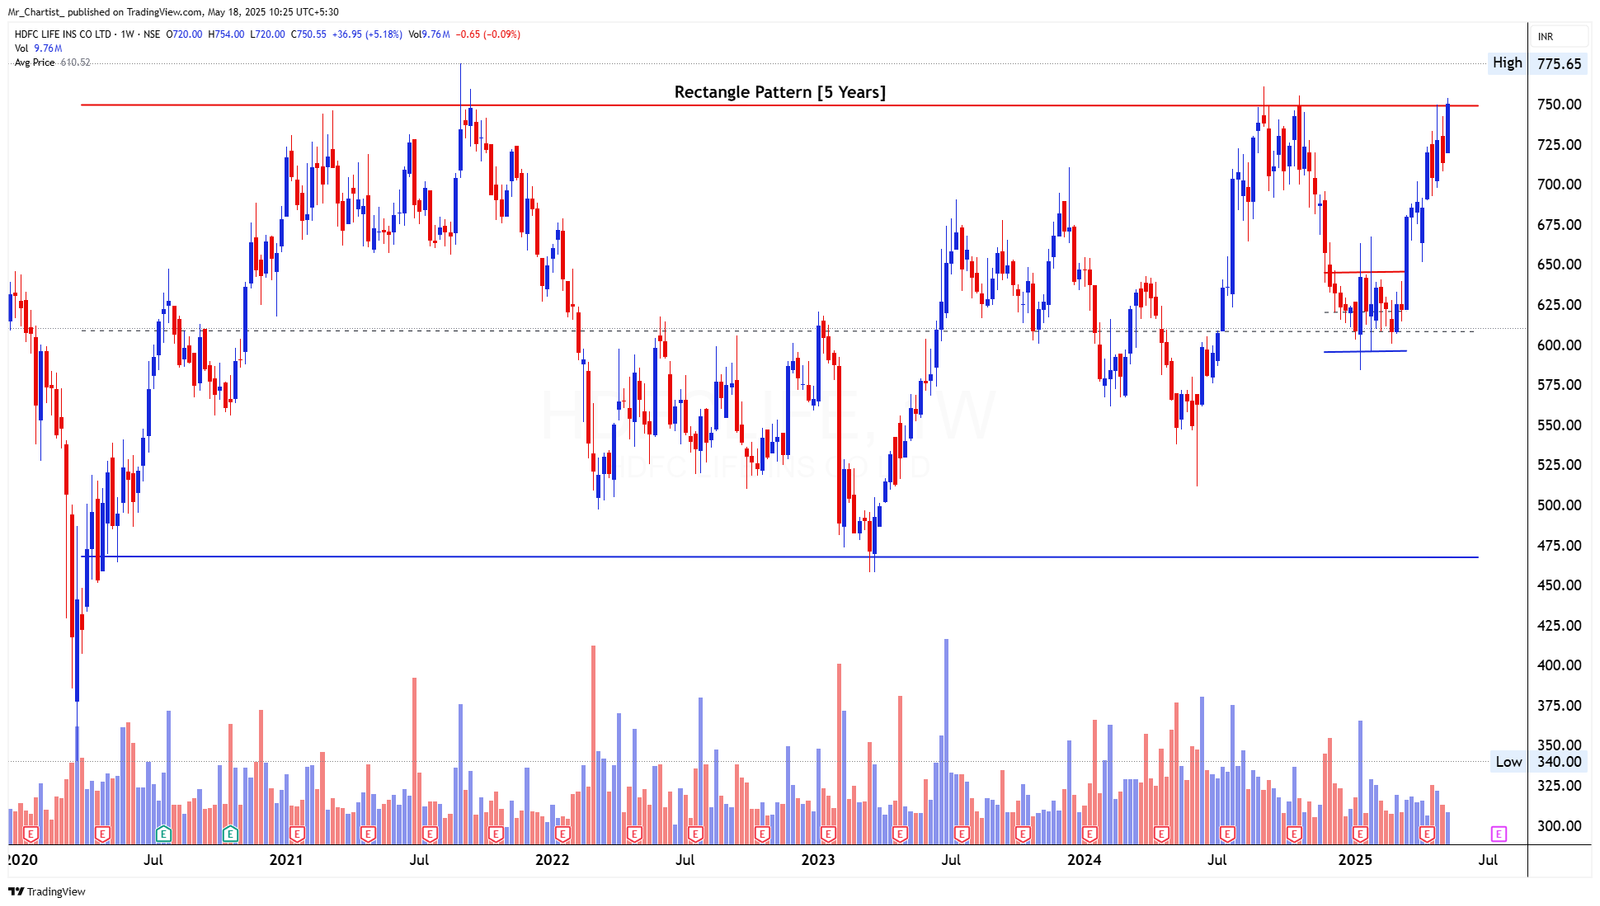
HDFC LIFE
bullish fnoThe latest weekly candle has a small body with upper wick, indicating supply
Rectangle Pattern [5 Years]
Thesis & Analysis
Price Action Overview: HDFC Life has been trading within a broad 5-year Rectangle Pattern, bound between the ₹475–₹775 range. The stock is now approaching the upper boundary of this long-standing consolidation structure, a zone where prior rallies have historically failed. The current price action shows a strong upward leg over the past several months, now testing the crucial resistance zone at ₹750–₹775. Candlestick Pattern: The latest weekly candle has a small body with upper wick, indicating supply pressure near the top of the range. There is no decisive bearish pattern yet, but the hesitation reflects caution among buyers near long-term resistance. Volume Analysis: Volume has steadily increased over recent weeks, supporting the advance. However, a volume spike alongside a breakout would be necessary to confirm a shift out of the 5-year range. 2. Crucial Support and Resistance Levels Support Levels: ₹720–₹700: Recent swing low and short-term support. ₹640: Mid-range support from multiple bounces in the past 2 years. ₹600: Base zone from which the current rally emerged. Resistance Levels: ₹750–₹775: Long-term Rectangle top and critical breakout zone. Above ₹775: Uncharted territory with open sky to prior all-time highs; would imply a regime shift in long-term structure. 3. Strategic Trade Scenarios Bullish Scenario: If HDFC Life manages to break above ₹775 on a weekly closing basis, with volume expansion, it would mark a breakout from the 5-year range, opening up upside toward ₹880–₹900+ in the medium term. Sustaining above ₹750 will be key for validation. Bearish Scenario: Failure to clear ₹775 could result in a pullback toward ₹720–₹700. A close below ₹700 may extend the correction toward ₹640, keeping it inside the range and neutralizing bullish momentum.
Price Action
- ■Price action is structurally positive.
- ■Forming higher highs and higher lows.
Volume Profile
- ■Volume is supportive of the price action.
- ■Wait for volume expansion on breakout.
Key Levels
No zones specified
No zones specified
Invalidation Scenario
A weekly close below the support level invalidates this structure.
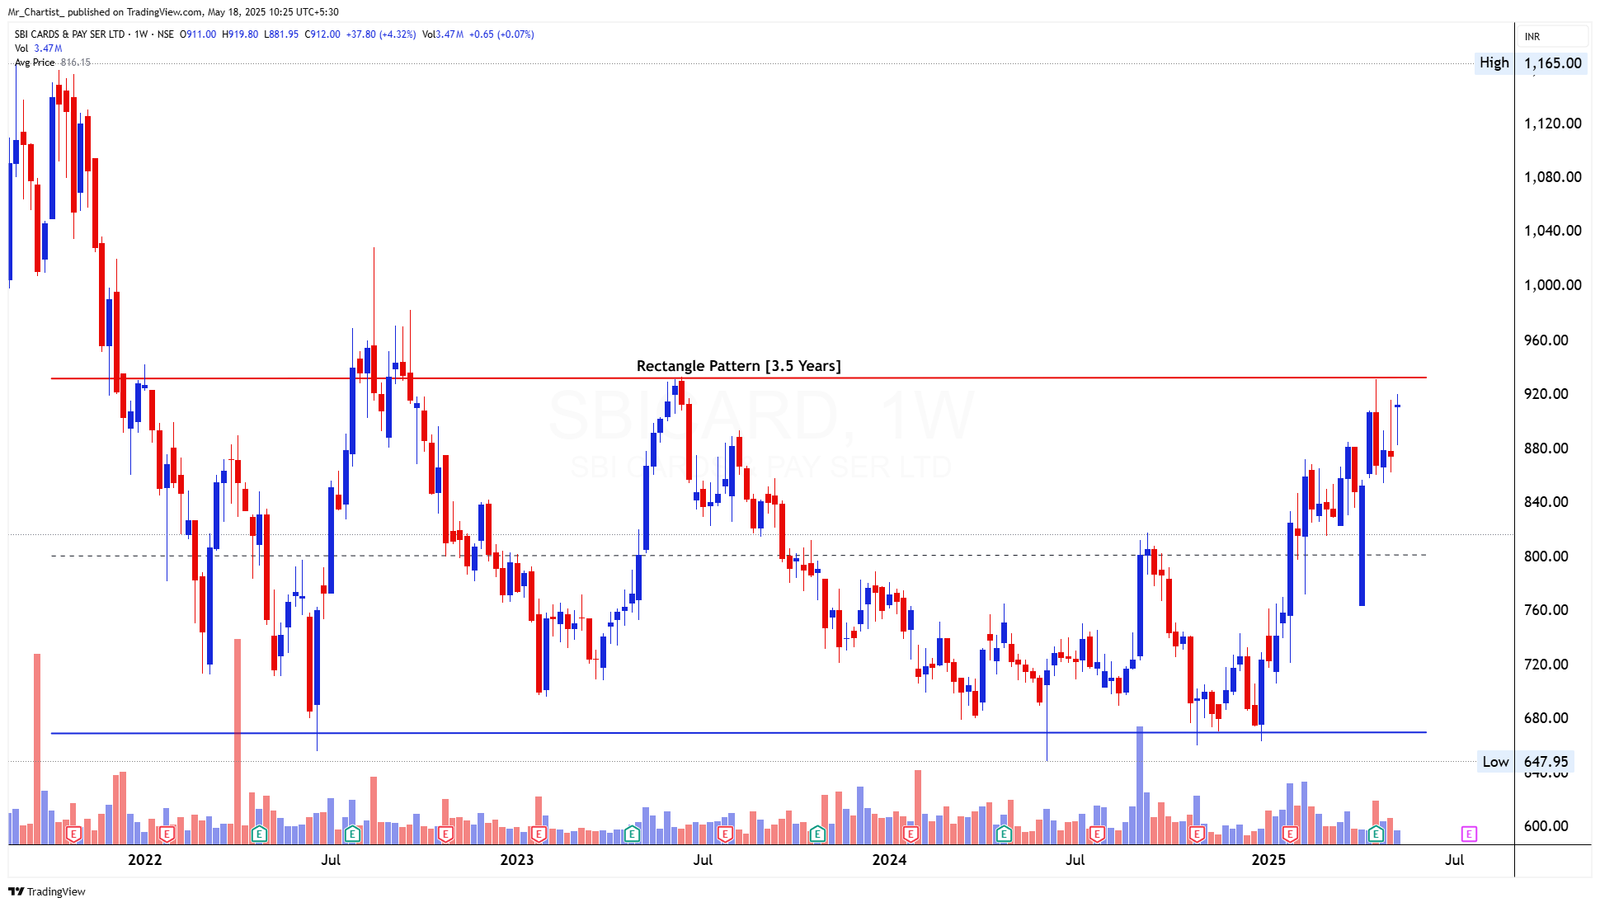
SBICARD
bullish fnoNo clear reversal pattern is visible yet, but the presence of an upper wick at the
Rectangle Pattern [3.5 Years]
Thesis & Analysis
Price Action Overview: SBICARD has been trading within a well-defined Rectangle Pattern for the past 3.5 years, with clear boundaries near ₹645 on the lower side and ₹925 on the upper side. The current price action shows that the stock is once again testing the resistance zone near ₹925, where it has reversed multiple times historically. Recent candles demonstrate strong upward momentum, with the price rallying from the ₹800 region to near the pattern top. However, the current candle shows a slight upper wick, suggesting some supply emergence near resistance. Candlestick Pattern: No clear reversal pattern is visible yet, but the presence of an upper wick at the resistance zone suggests short-term caution. A strong bullish candle with a full body is awaited to confirm breakout strength. Volume Analysis: Volume has been gradually increasing during the recent advance, a constructive sign. A volume surge during breakout above ₹925 would validate a true escape from this long consolidation range. 2. Crucial Support and Resistance Levels Support Levels: ₹860–₹850: Recent swing low zone, near-term support. ₹800: Mid-point consolidation zone. ₹645–₹650: Multi-year base of the rectangle and long-term floor. Resistance Levels: ₹925: Rectangle pattern ceiling and current price hurdle. Above ₹925: Could signal a multi-year breakout with long-term bullish implications. No major resistance till prior all-time highs near ₹1,050+. 3. Strategic Trade Scenarios Bullish Scenario: If SBICARD breaks out above ₹925 with strong volume and weekly close confirmation, it would mark a breakout from a 3.5-year range. Potential targets in such a scenario open toward ₹1,050–₹1,080, with strength extending further over time. Bearish Scenario: Failure to cross ₹925 may result in a pullback toward ₹860 or even ₹800. A close below ₹800 would again trap the price inside the rectangle, prolonging consolidation and weakening immediate bullish momentum.
Price Action
- ■Price action is structurally positive.
- ■Forming higher highs and higher lows.
Volume Profile
- ■Volume is supportive of the price action.
- ■Wait for volume expansion on breakout.
Key Levels
No zones specified
No zones specified
Invalidation Scenario
A weekly close below the support level invalidates this structure.
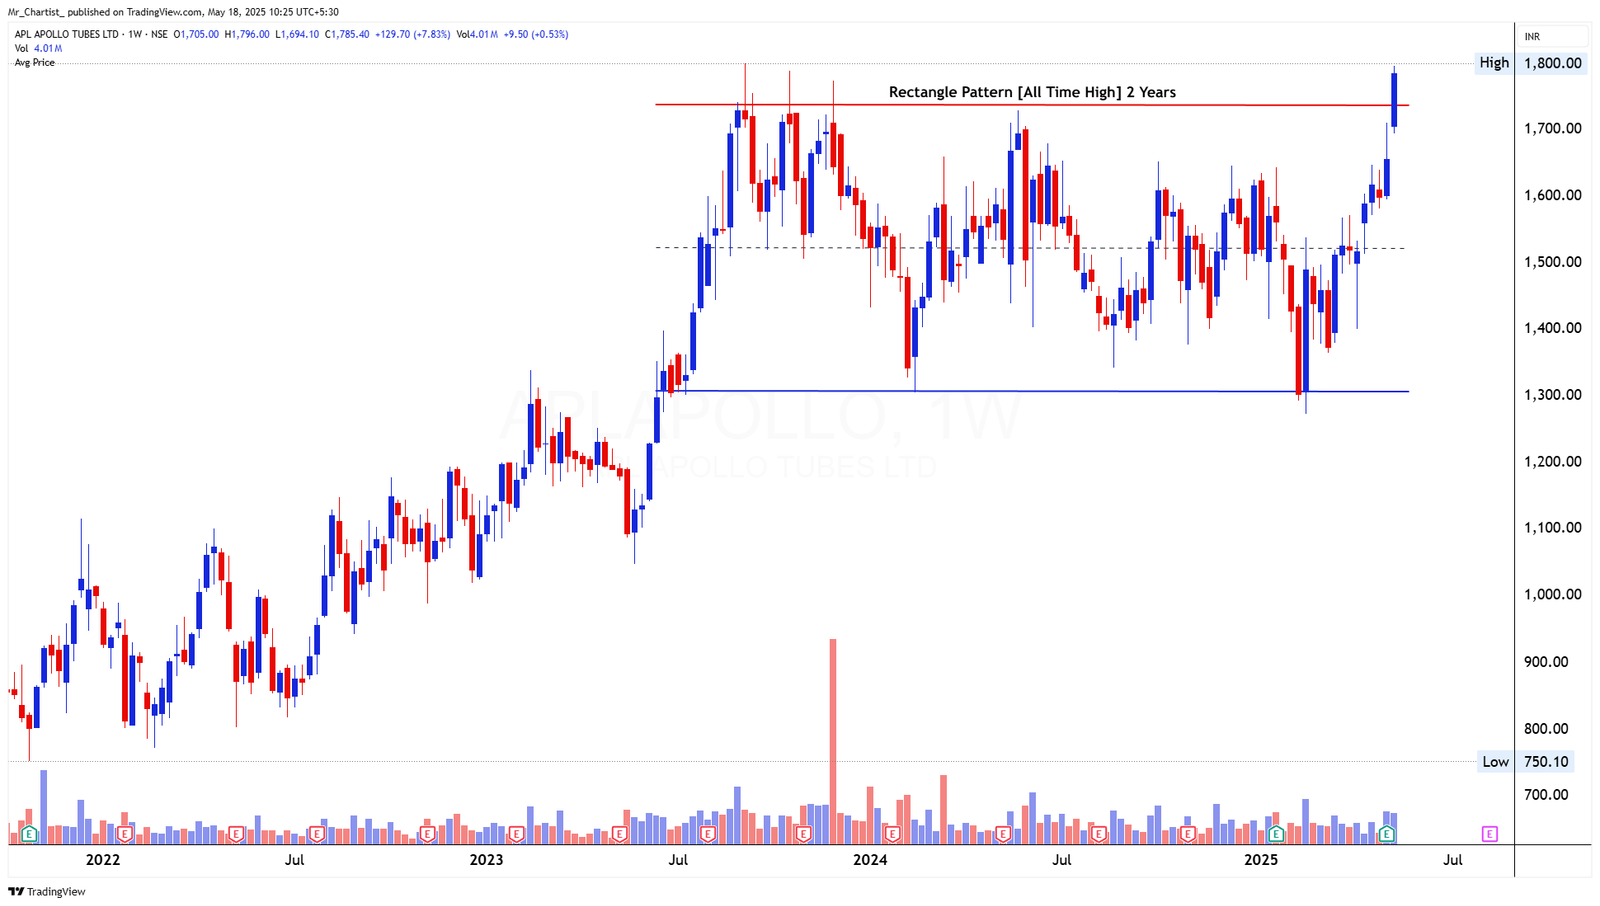
APLAPOLLO
bullish fnoDouble Bottom Breakout
Rectangle Pattern [All-Time High | 2 Years]
Thesis & Analysis
Price Action Overview: APL Apollo has successfully broken out of a long-standing Rectangle Consolidation that lasted around 2 years, with the upper resistance boundary near ₹1,750. The breakout comes after repeated tests of this level, with the current weekly candle decisively closing above the prior all-time highs. Candlestick Behavior: The breakout candle is bullish with a wide range body, supported by a strong follow- through from recent sessions. This indicates sustained buying pressure and potential initiation of a fresh uptrend. Volume Analysis: There is a visible volume spike accompanying the breakout, confirming institutional participation and validating the breakout strength. The pattern shows classical breakout behavior — compression, followed by an expansion in both price and volume. 2. Crucial Support and Resistance Levels Support Levels: ₹1,750: Previous resistance, now acting as immediate support post-breakout. ₹1,620: Mid-range zone during consolidation. ₹1,320: Pattern base, strong long-term support. Resistance Levels: None nearby – as this is a fresh all-time high breakout, the chart is in open skies. Fibonacci extensions or channel projections may now be used to estimate upside targets. 3. Strategic Trade Scenarios Primary Setup (Bullish Breakout Continuation): APLAPOLLO remains structurally bullish. Sustaining above ₹1,750 confirms the breakout from the 2-year range, opening up potential upside toward ₹1,950–₹2,100 based on pattern height projections. Trigger: Sustained price action above ₹1,750 with continued volume confirmation. Target Zones: ₹1,950 (initial), ₹2,100 (extended). Alternative Scenario (False Breakout Risk): Failure to hold above ₹1,750 could lead to a pullback or retest of the breakout zone. If price falls below ₹1,750 on weekly close, re-entry into the rectangle may occur, with a potential retracement toward ₹1,620.
Price Action
- ■Price action is structurally positive.
- ■Forming higher highs and higher lows.
Volume Profile
- ■Volume is supportive of the price action.
- ■Wait for volume expansion on breakout.
Key Levels
No zones specified
No zones specified
Invalidation Scenario
A weekly close below the support level invalidates this structure.
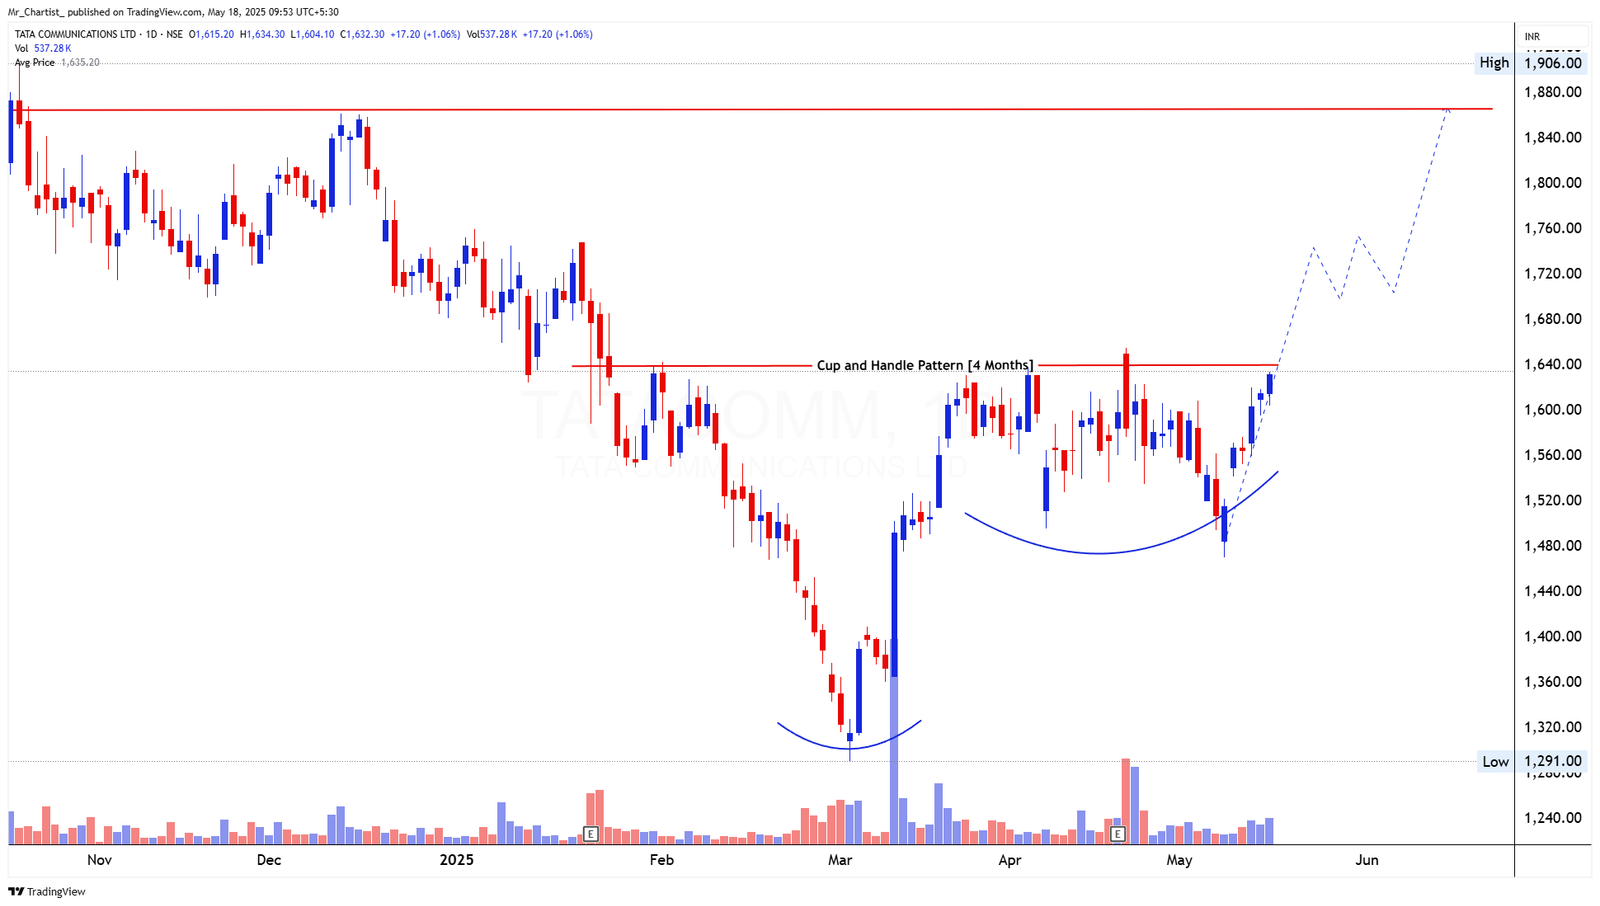
TATACOMM
bullish fnoDouble Bottom Breakout
Daily Chart
Thesis & Analysis
No detailed thesis provided for this setup.
Price Action
- ■Price action is structurally positive.
- ■Forming higher highs and higher lows.
Volume Profile
- ■Volume is supportive of the price action.
- ■Wait for volume expansion on breakout.
Key Levels
No zones specified
No zones specified
Invalidation Scenario
A weekly close below the support level invalidates this structure.
Chart Image Not Extracted
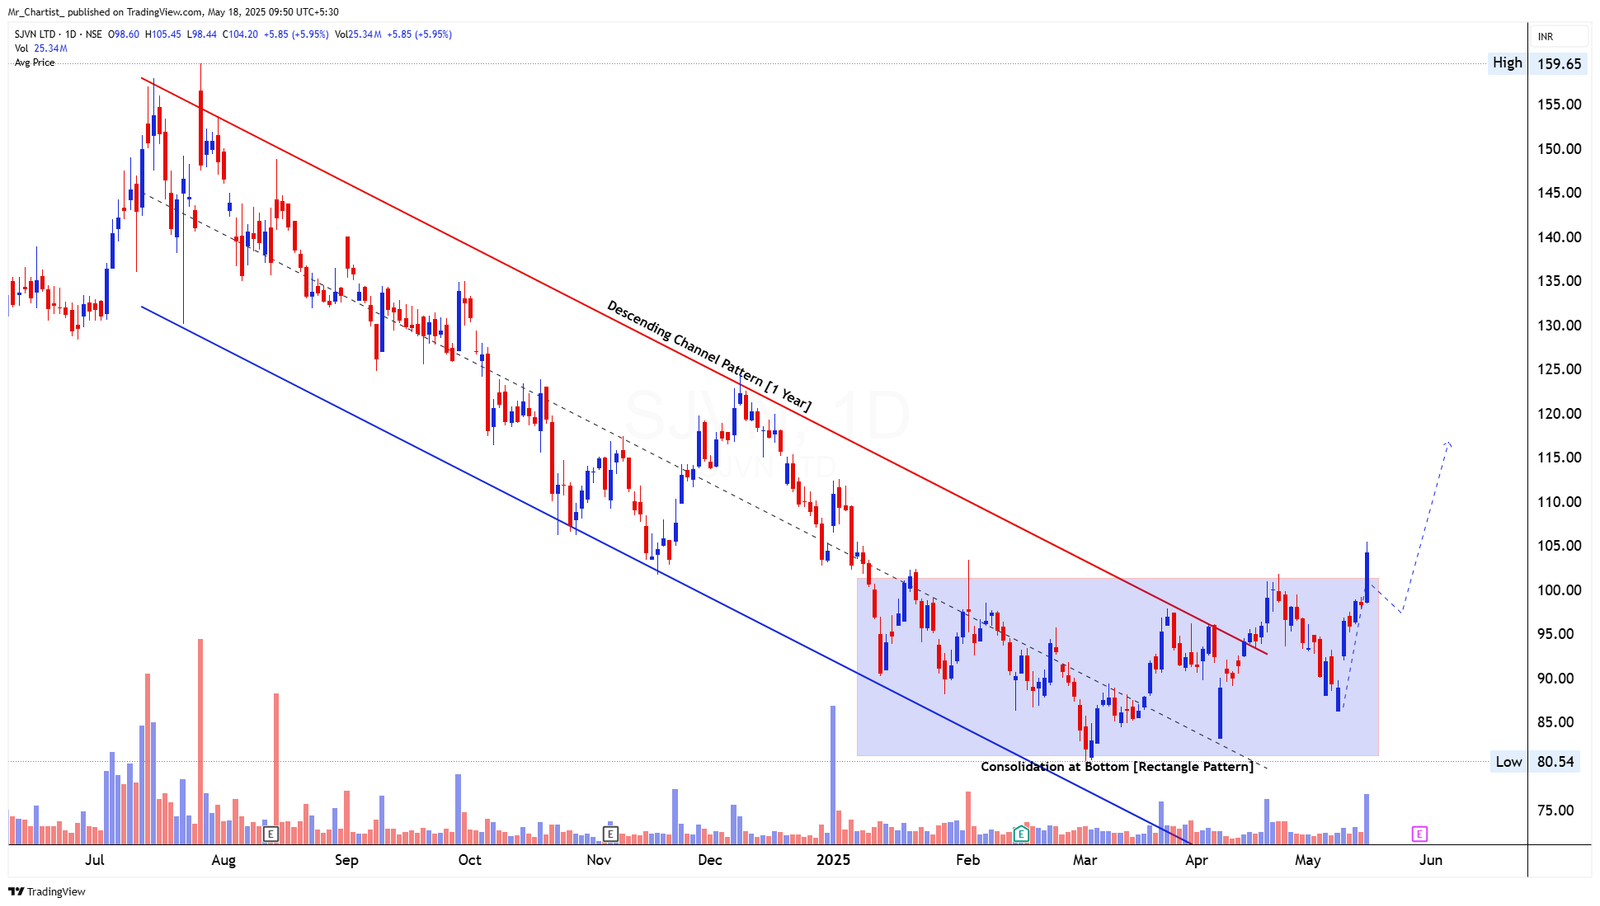
SJVN
bullish fnoDouble Bottom Breakout
Daily Chart
Thesis & Analysis
No detailed thesis provided for this setup.
Price Action
- ■Price action is structurally positive.
- ■Forming higher highs and higher lows.
Volume Profile
- ■Volume is supportive of the price action.
- ■Wait for volume expansion on breakout.
Key Levels
No zones specified
No zones specified
Invalidation Scenario
A weekly close below the support level invalidates this structure.
Bearish Charts [F&O]
Short setups indicating weakness
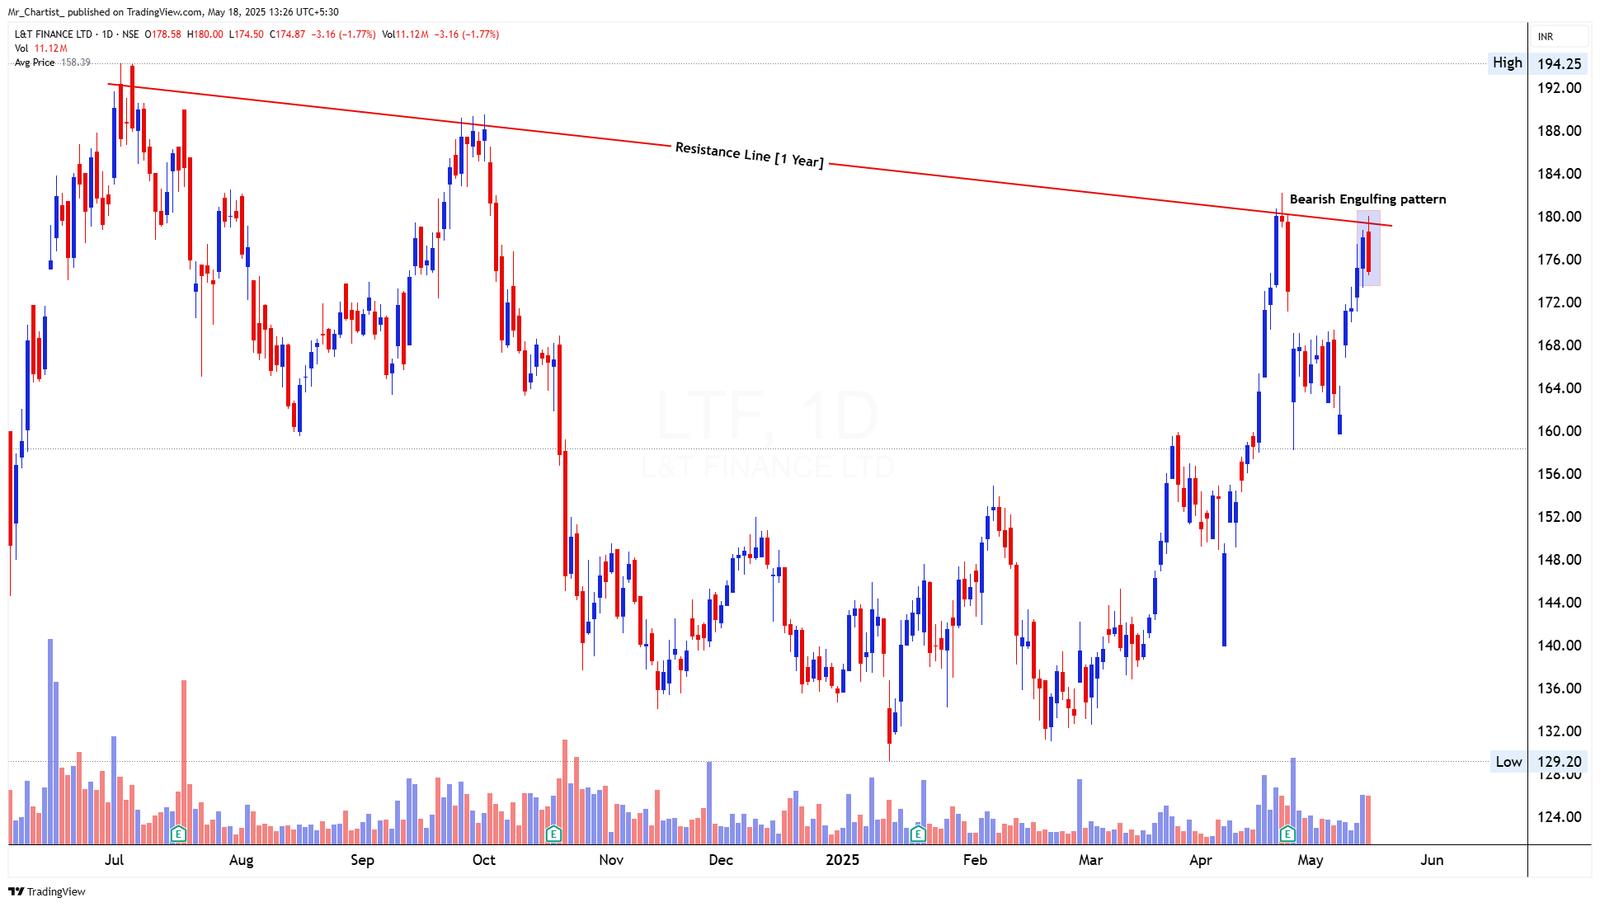
L&T FINANCE (LTF)
bearish fnoDouble Bottom Breakout
Daily Chart
Thesis & Analysis
No detailed thesis provided for this setup.
Price Action
- ■Price action is structurally positive.
- ■Forming higher highs and higher lows.
Volume Profile
- ■Volume is supportive of the price action.
- ■Wait for volume expansion on breakout.
Key Levels
No zones specified
No zones specified
Invalidation Scenario
A weekly close below the support level invalidates this structure.
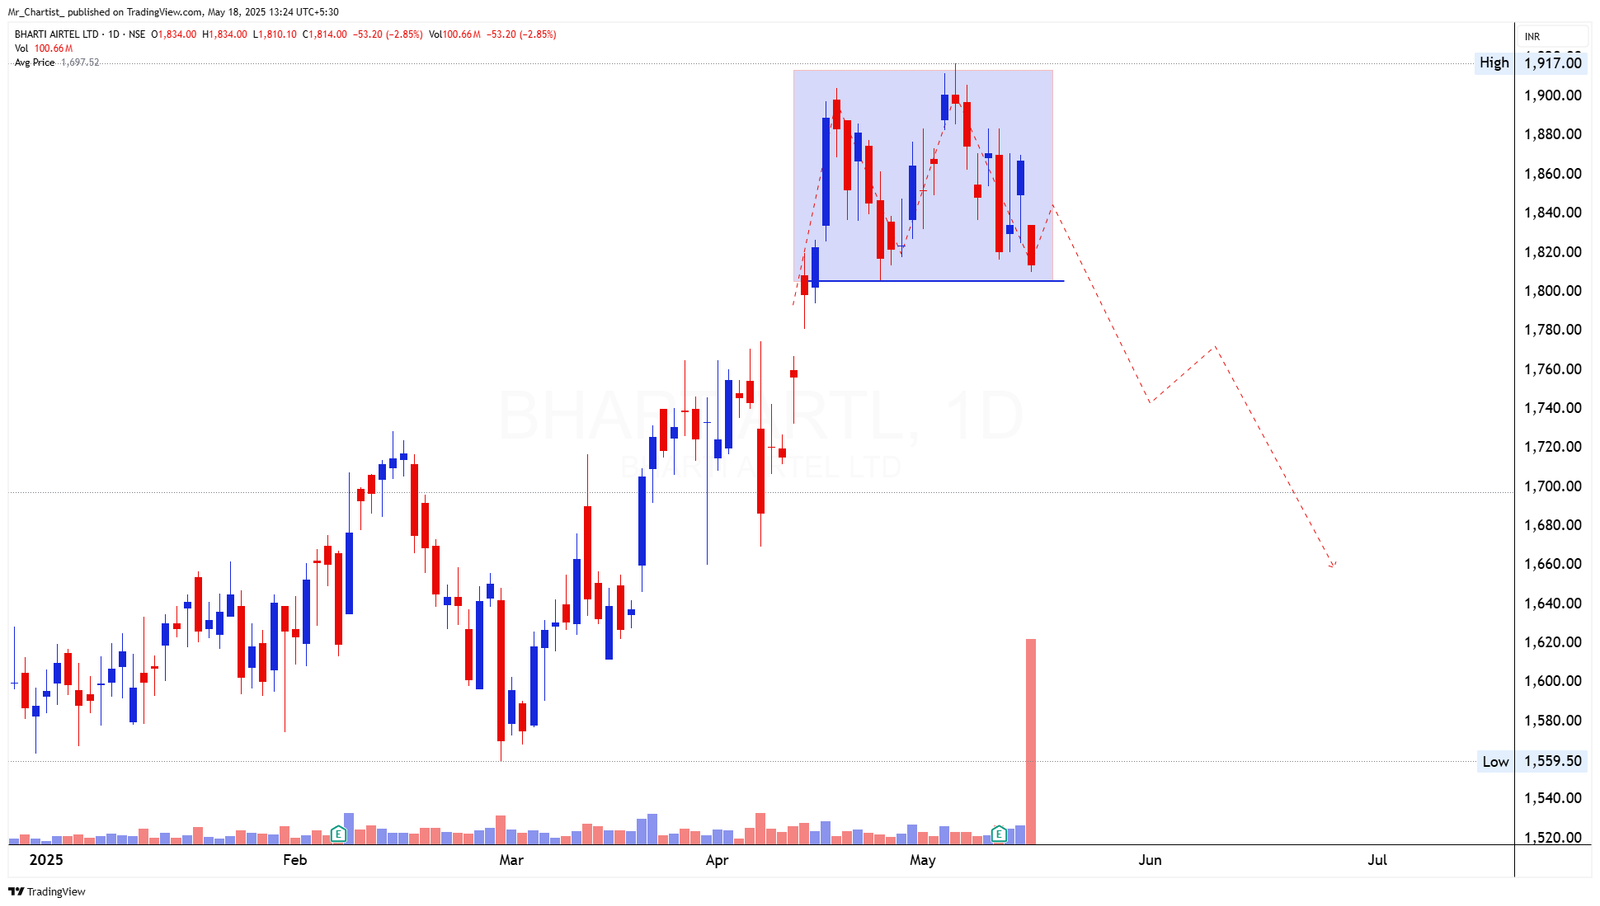
BHARTI AIRTEL
bearish fnoDouble Bottom Breakout
Daily Chart
Thesis & Analysis
No detailed thesis provided for this setup.
Price Action
- ■Price action is structurally positive.
- ■Forming higher highs and higher lows.
Volume Profile
- ■Volume is supportive of the price action.
- ■Wait for volume expansion on breakout.
Key Levels
No zones specified
No zones specified
Invalidation Scenario
A weekly close below the support level invalidates this structure.
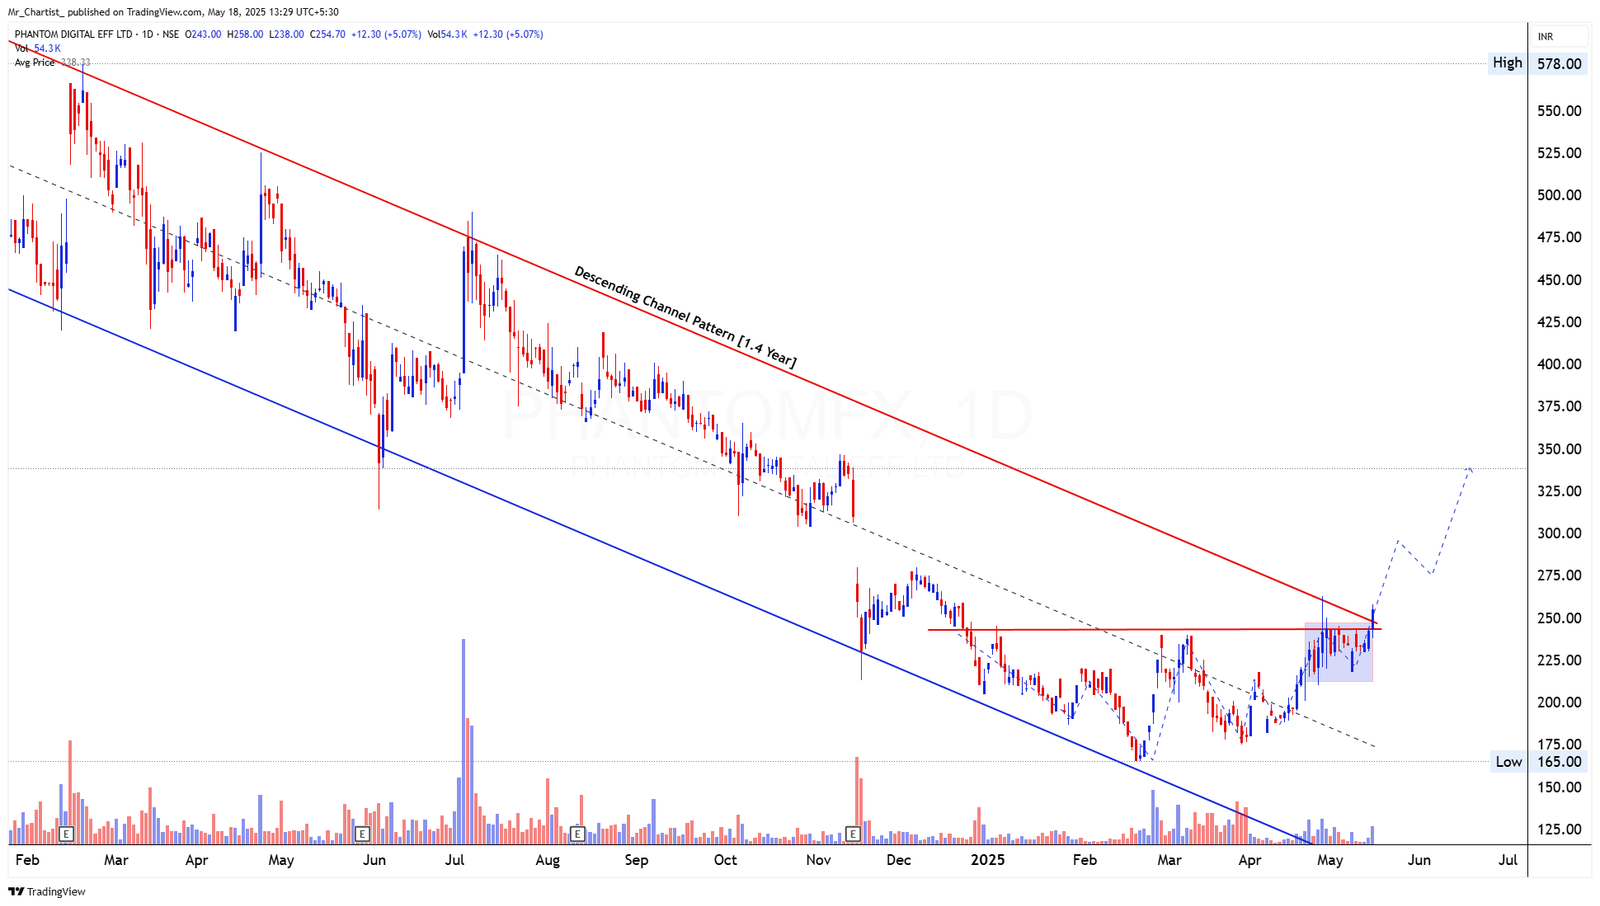
PHANTOMFX
bearish fnoDouble Bottom Breakout
Daily Chart
Thesis & Analysis
No detailed thesis provided for this setup.
Price Action
- ■Price action is structurally positive.
- ■Forming higher highs and higher lows.
Volume Profile
- ■Volume is supportive of the price action.
- ■Wait for volume expansion on breakout.
Key Levels
No zones specified
No zones specified
Invalidation Scenario
A weekly close below the support level invalidates this structure.
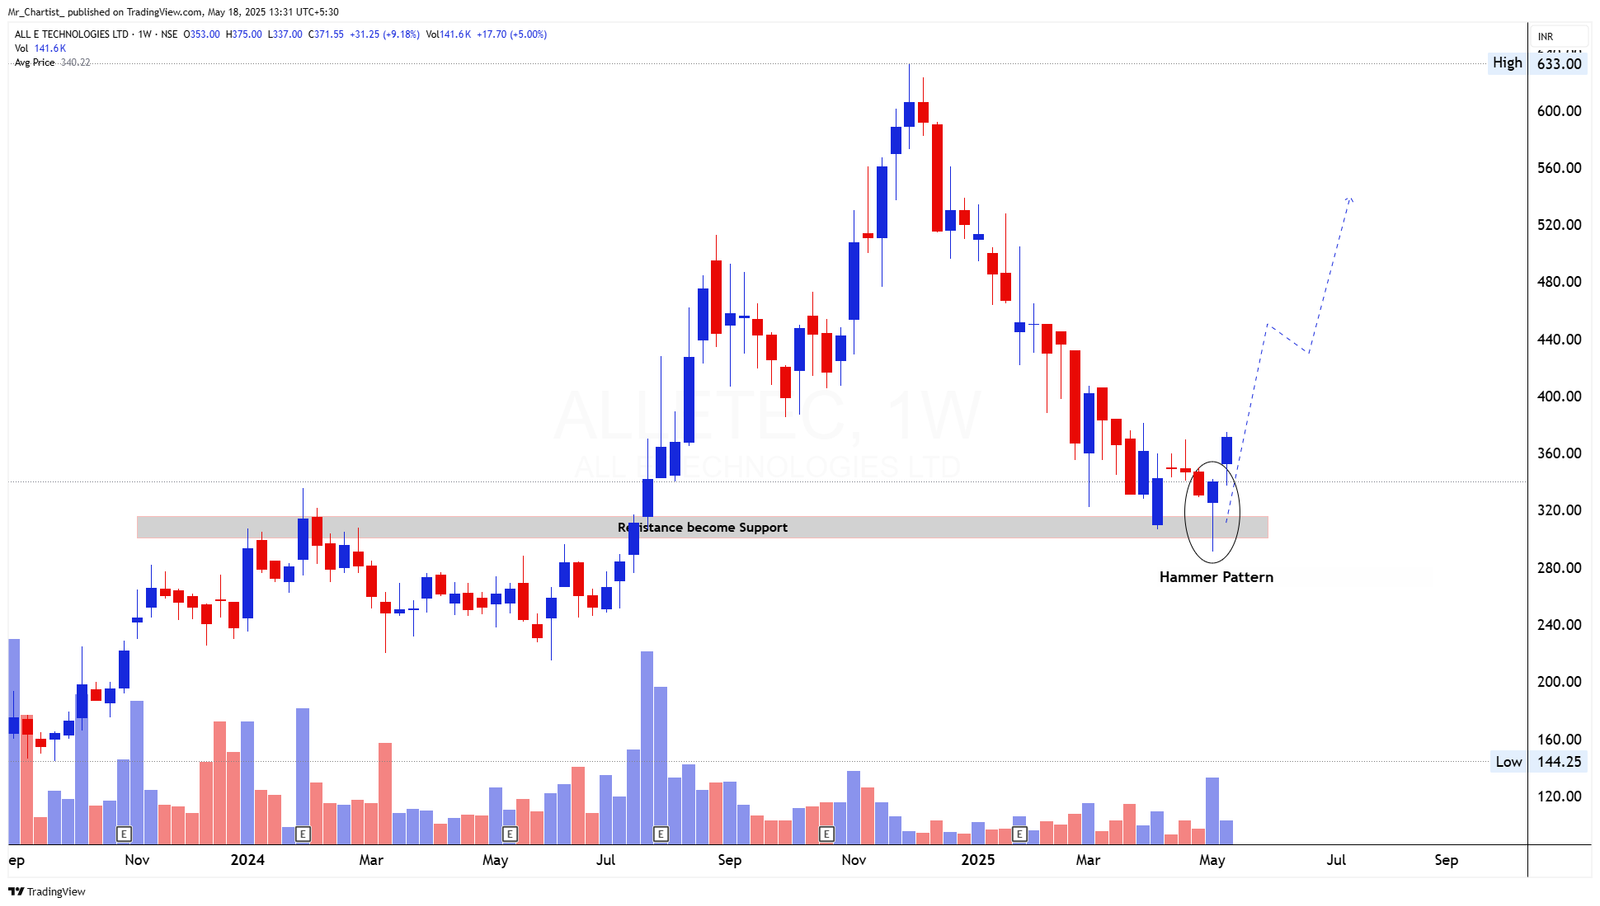
ALLETEC
bearish fnoDouble Bottom Breakout
Daily Chart
Thesis & Analysis
No detailed thesis provided for this setup.
Price Action
- ■Price action is structurally positive.
- ■Forming higher highs and higher lows.
Volume Profile
- ■Volume is supportive of the price action.
- ■Wait for volume expansion on breakout.
Key Levels
No zones specified
No zones specified
Invalidation Scenario
A weekly close below the support level invalidates this structure.
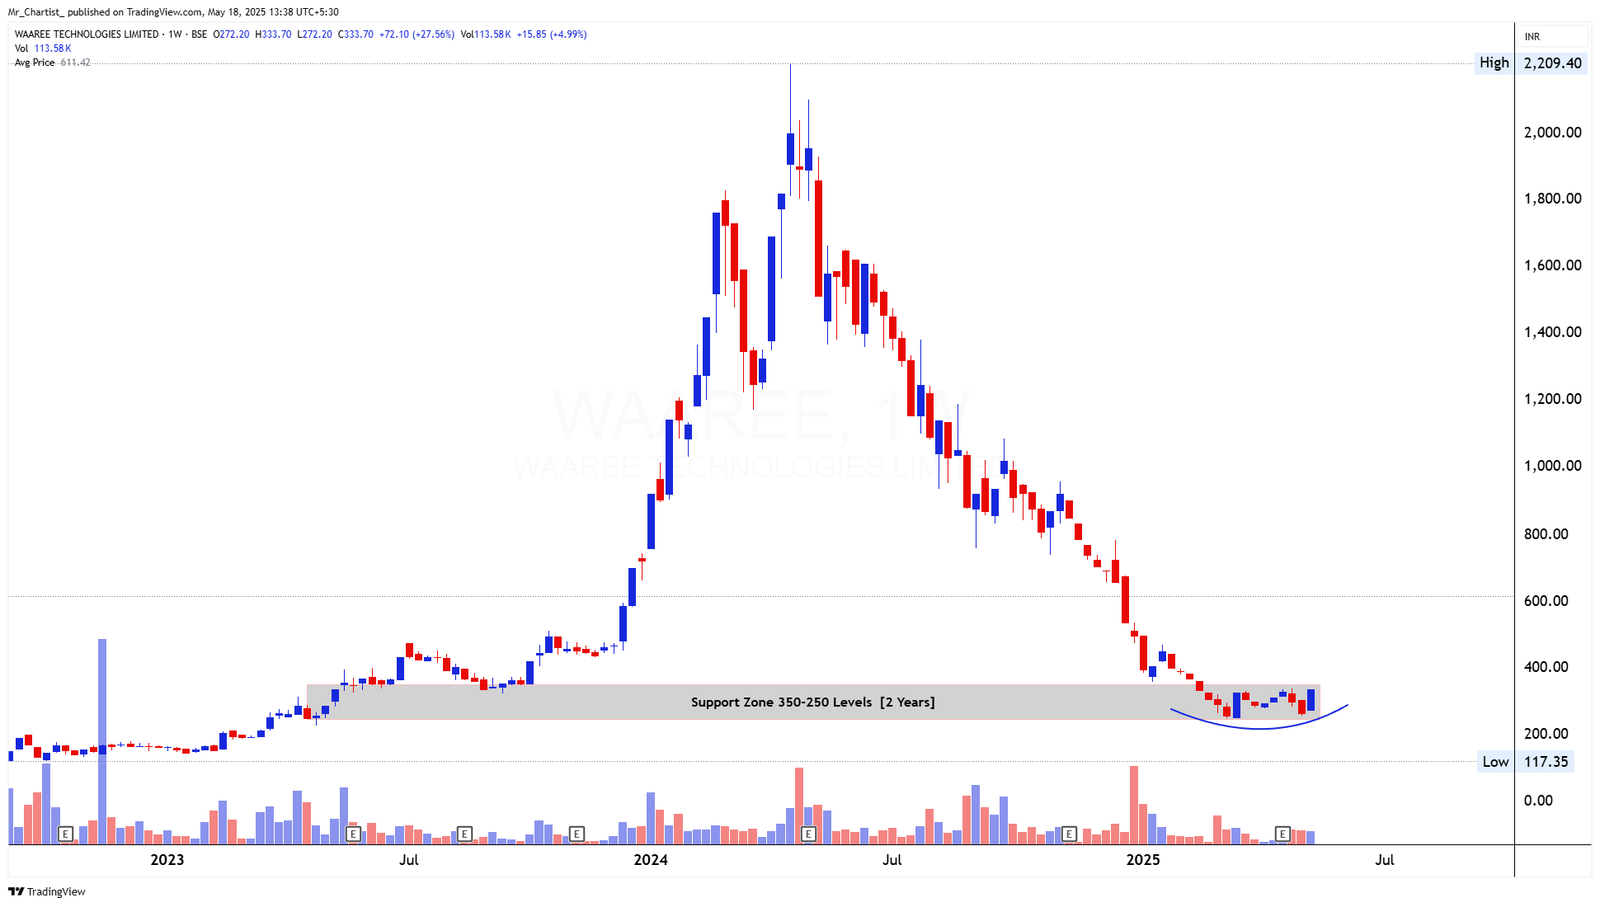
WAAREE
bearish fnoDouble Bottom Breakout
Daily Chart
Thesis & Analysis
No detailed thesis provided for this setup.
Price Action
- ■Price action is structurally positive.
- ■Forming higher highs and higher lows.
Volume Profile
- ■Volume is supportive of the price action.
- ■Wait for volume expansion on breakout.
Key Levels
No zones specified
No zones specified
Invalidation Scenario
A weekly close below the support level invalidates this structure.
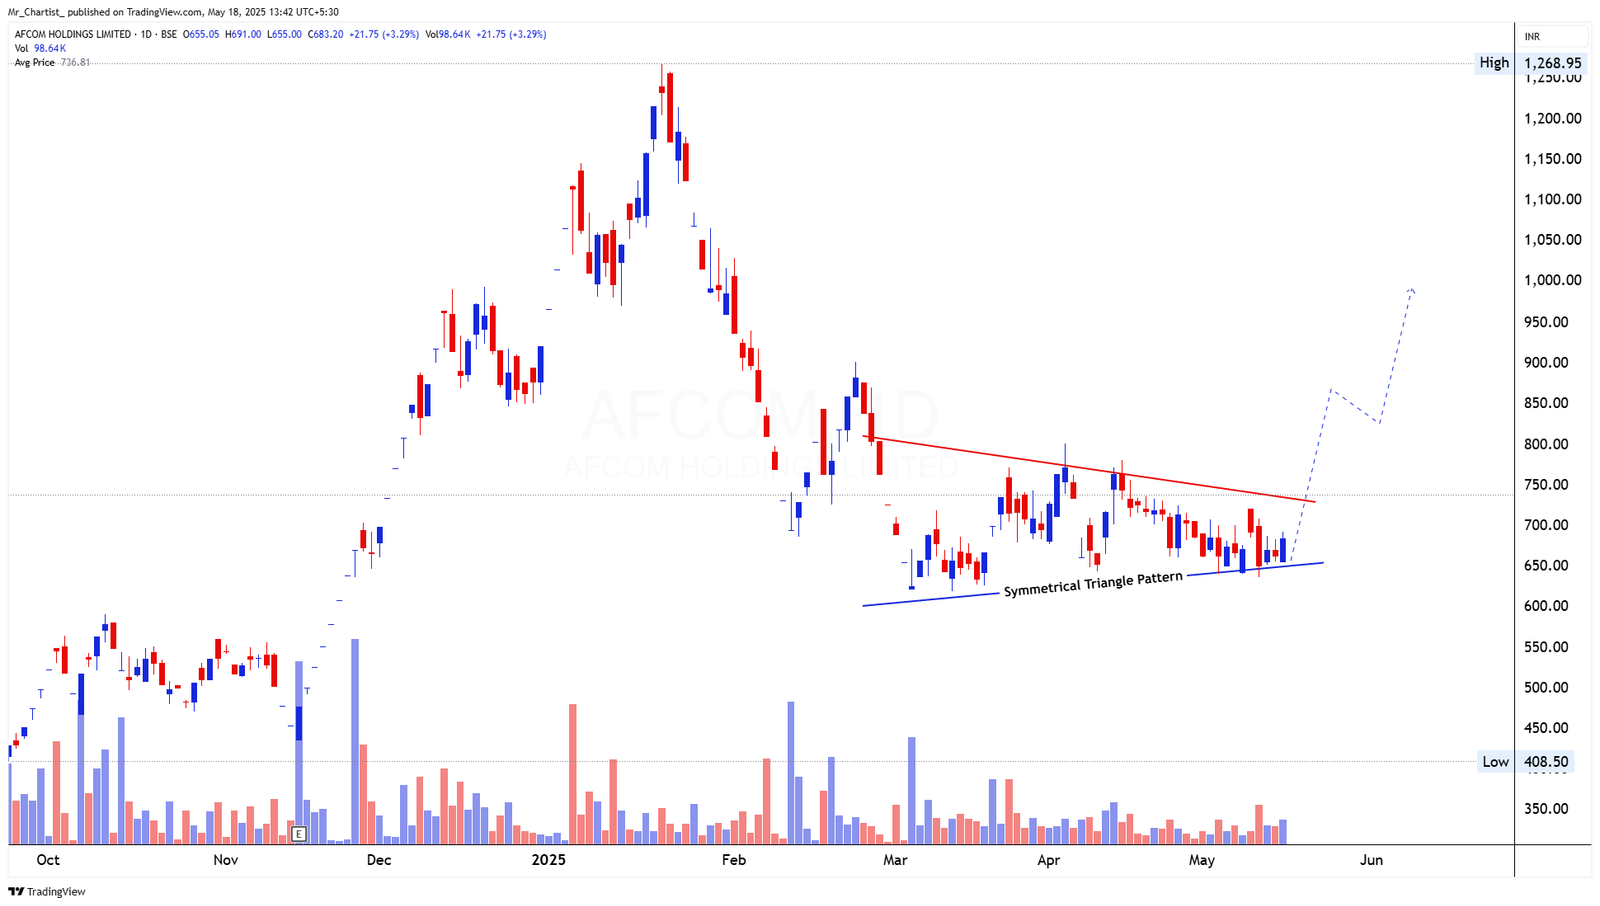
AFCOM
bearish fnoDouble Bottom Breakout
Daily Chart
Thesis & Analysis
No detailed thesis provided for this setup.
Price Action
- ■Price action is structurally positive.
- ■Forming higher highs and higher lows.
Volume Profile
- ■Volume is supportive of the price action.
- ■Wait for volume expansion on breakout.
Key Levels
No zones specified
No zones specified
Invalidation Scenario
A weekly close below the support level invalidates this structure.
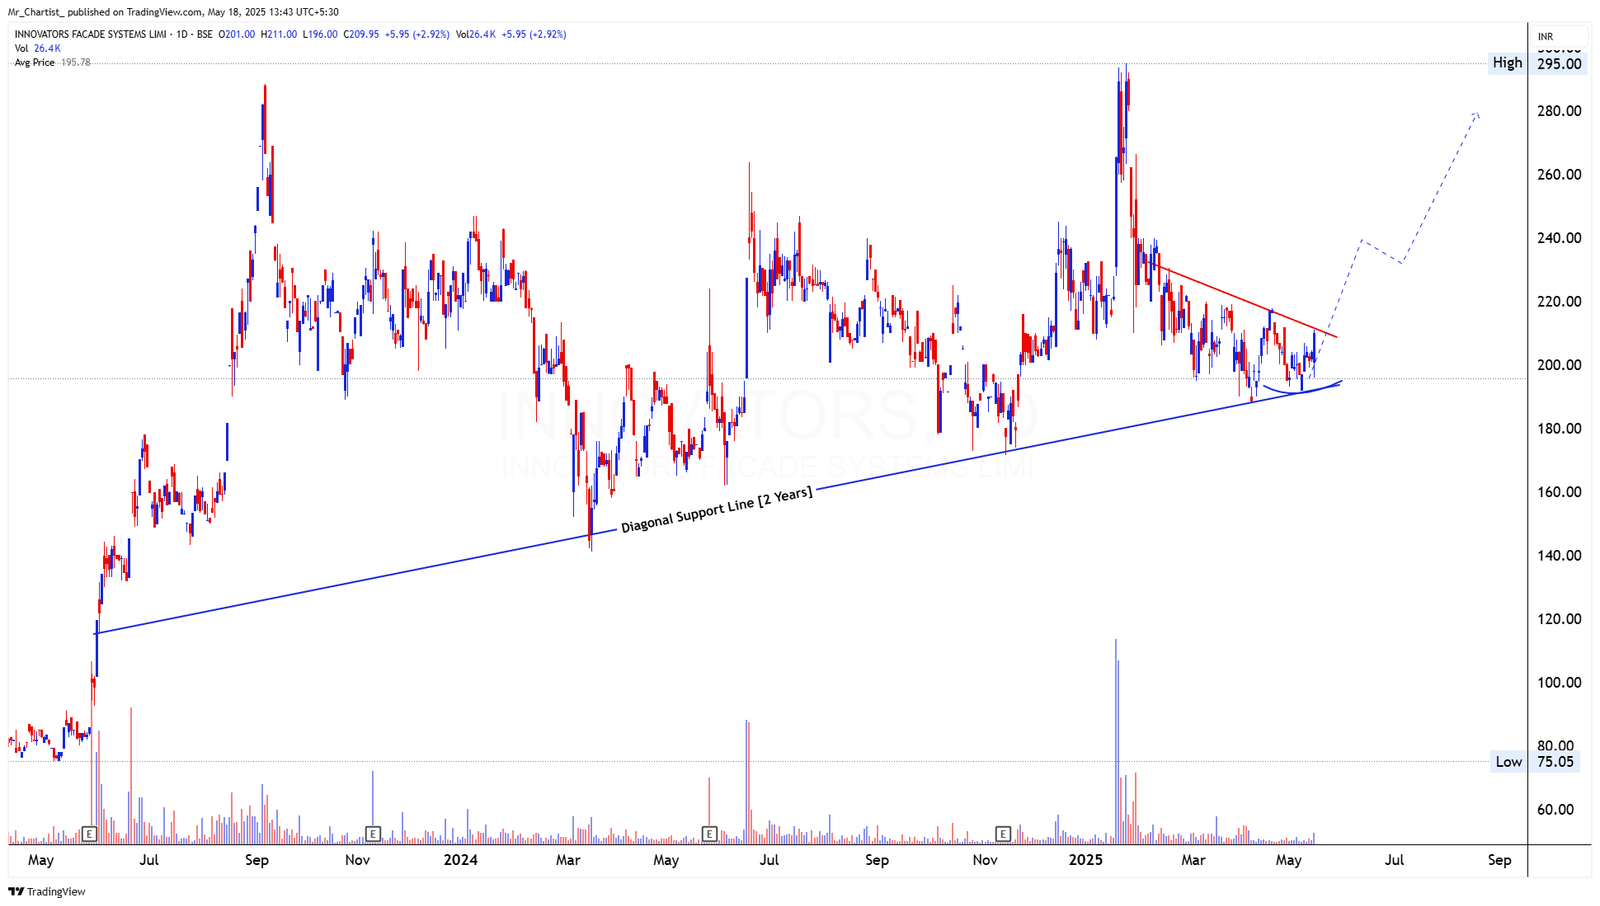
INNOVATORS FACADE
bearish fnoDouble Bottom Breakout
Daily Chart
Thesis & Analysis
No detailed thesis provided for this setup.
Price Action
- ■Price action is structurally positive.
- ■Forming higher highs and higher lows.
Volume Profile
- ■Volume is supportive of the price action.
- ■Wait for volume expansion on breakout.
Key Levels
No zones specified
No zones specified
Invalidation Scenario
A weekly close below the support level invalidates this structure.
BHARTI AIRTEL
bearish fnoDouble Bottom Breakout
Daily Chart
Thesis & Analysis
No detailed thesis provided for this setup.
Price Action
- ■Price action is structurally positive.
- ■Forming higher highs and higher lows.
Volume Profile
- ■Volume is supportive of the price action.
- ■Wait for volume expansion on breakout.
Key Levels
No zones specified
No zones specified
Invalidation Scenario
A weekly close below the support level invalidates this structure.
Chart Image Not Extracted
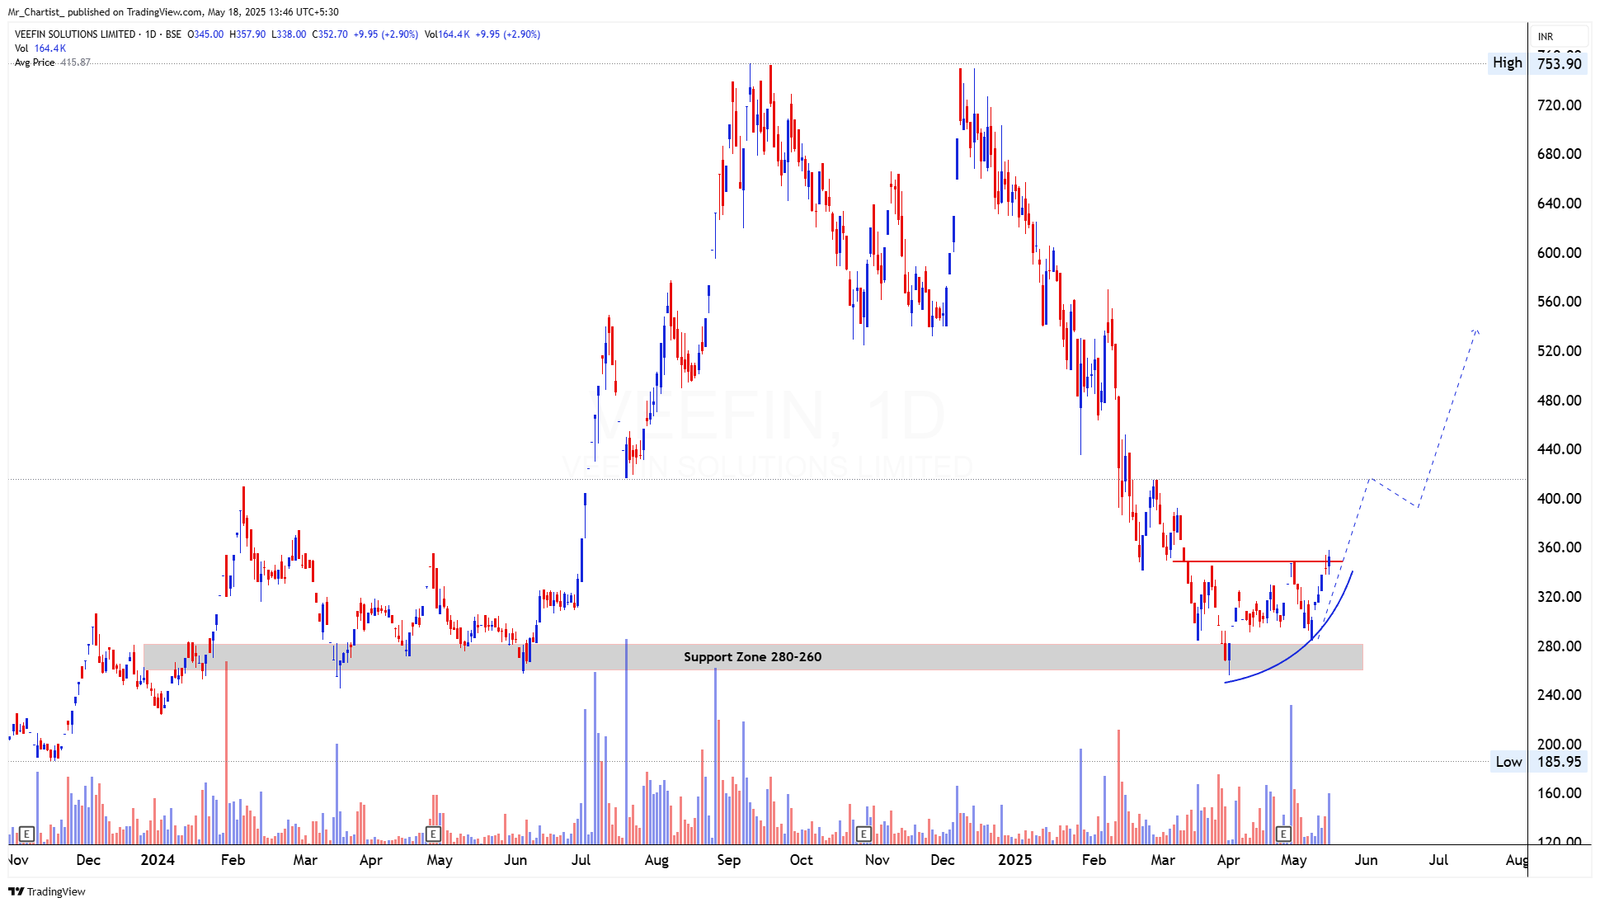
VEEFIN
bearish fnoDouble Bottom Breakout
Daily Chart
Thesis & Analysis
No detailed thesis provided for this setup.
Price Action
- ■Price action is structurally positive.
- ■Forming higher highs and higher lows.
Volume Profile
- ■Volume is supportive of the price action.
- ■Wait for volume expansion on breakout.
Key Levels
No zones specified
No zones specified
Invalidation Scenario
A weekly close below the support level invalidates this structure.
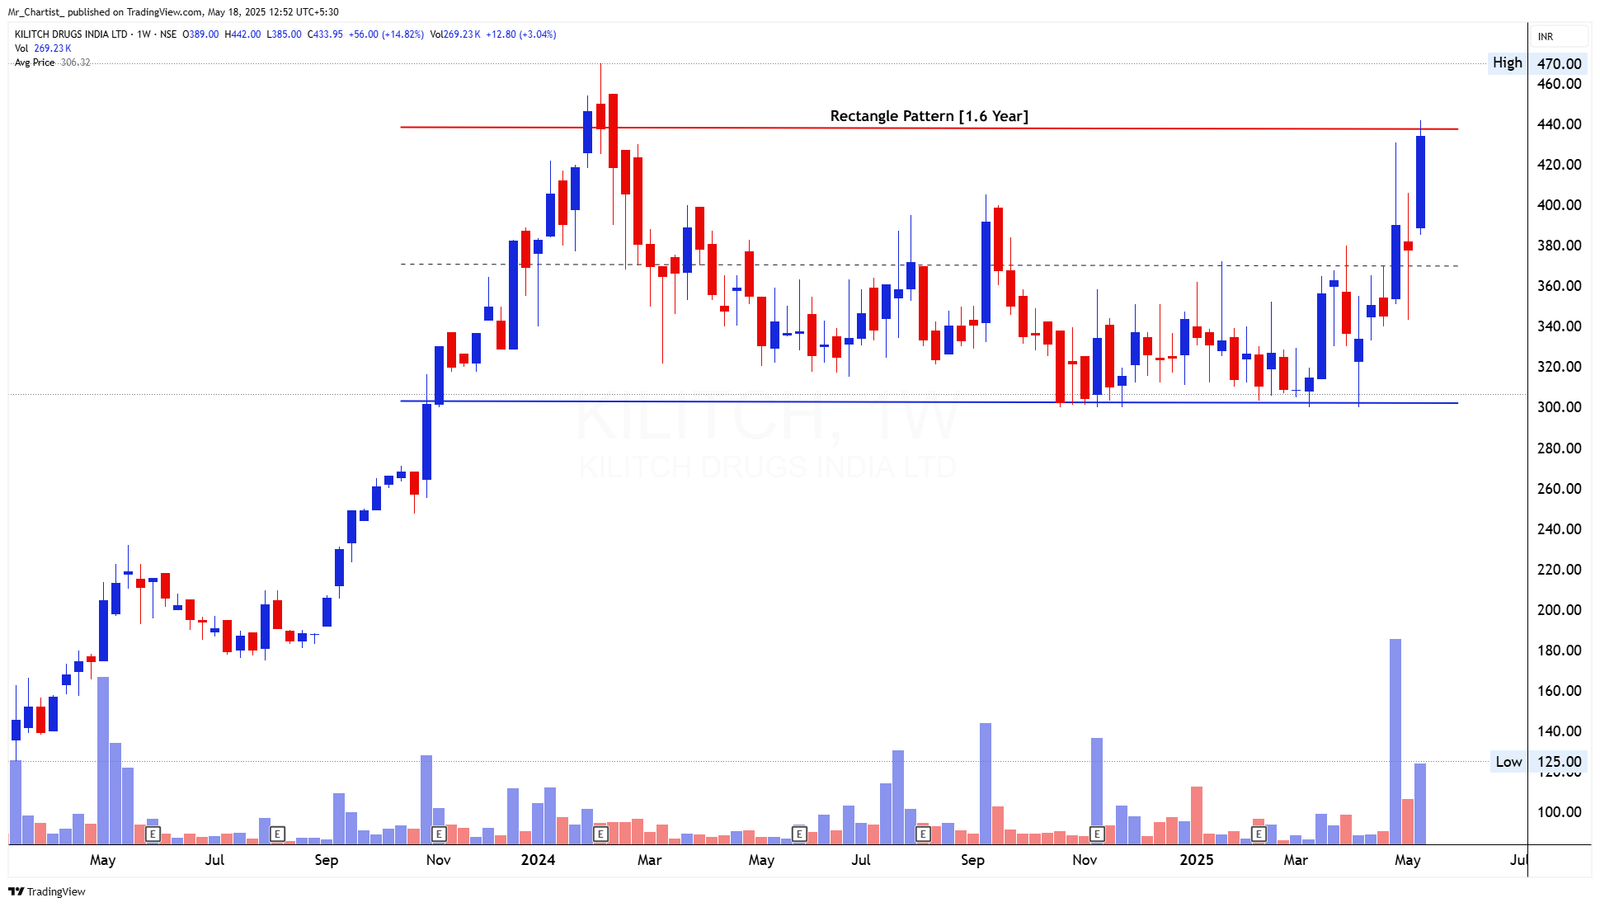
KILITCH
bearish fnoDouble Bottom Breakout
Daily Chart
Thesis & Analysis
No detailed thesis provided for this setup.
Price Action
- ■Price action is structurally positive.
- ■Forming higher highs and higher lows.
Volume Profile
- ■Volume is supportive of the price action.
- ■Wait for volume expansion on breakout.
Key Levels
No zones specified
No zones specified
Invalidation Scenario
A weekly close below the support level invalidates this structure.
VEERENRGY
bearish fnoDouble Bottom Breakout
Daily Chart
Thesis & Analysis
No detailed thesis provided for this setup.
Price Action
- ■Price action is structurally positive.
- ■Forming higher highs and higher lows.
Volume Profile
- ■Volume is supportive of the price action.
- ■Wait for volume expansion on breakout.
Key Levels
No zones specified
No zones specified
Invalidation Scenario
A weekly close below the support level invalidates this structure.
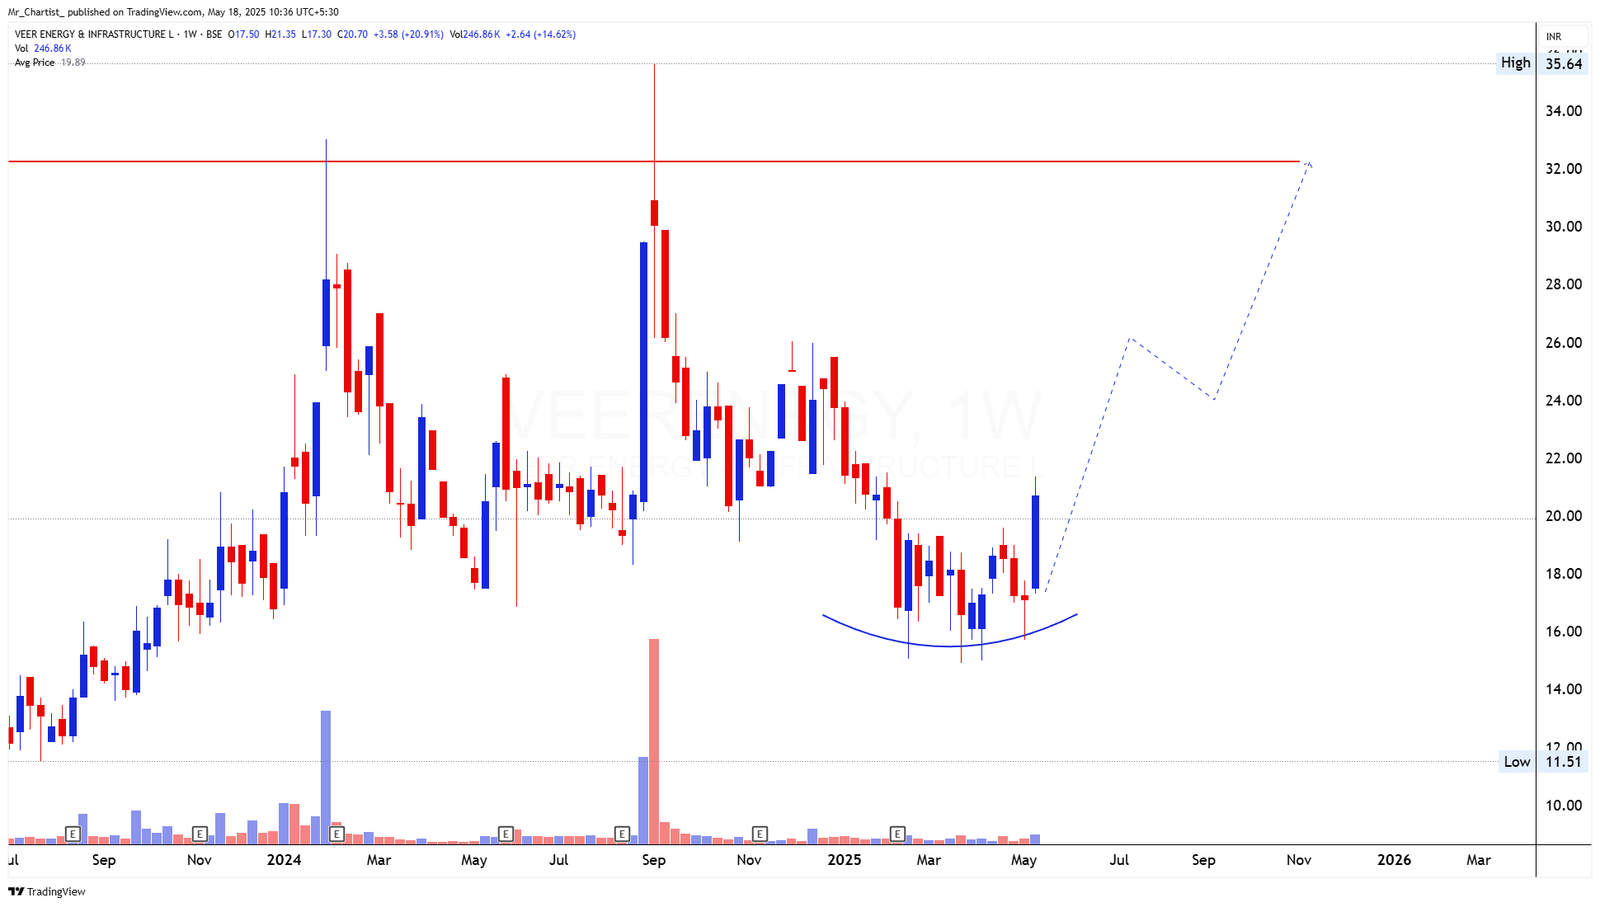
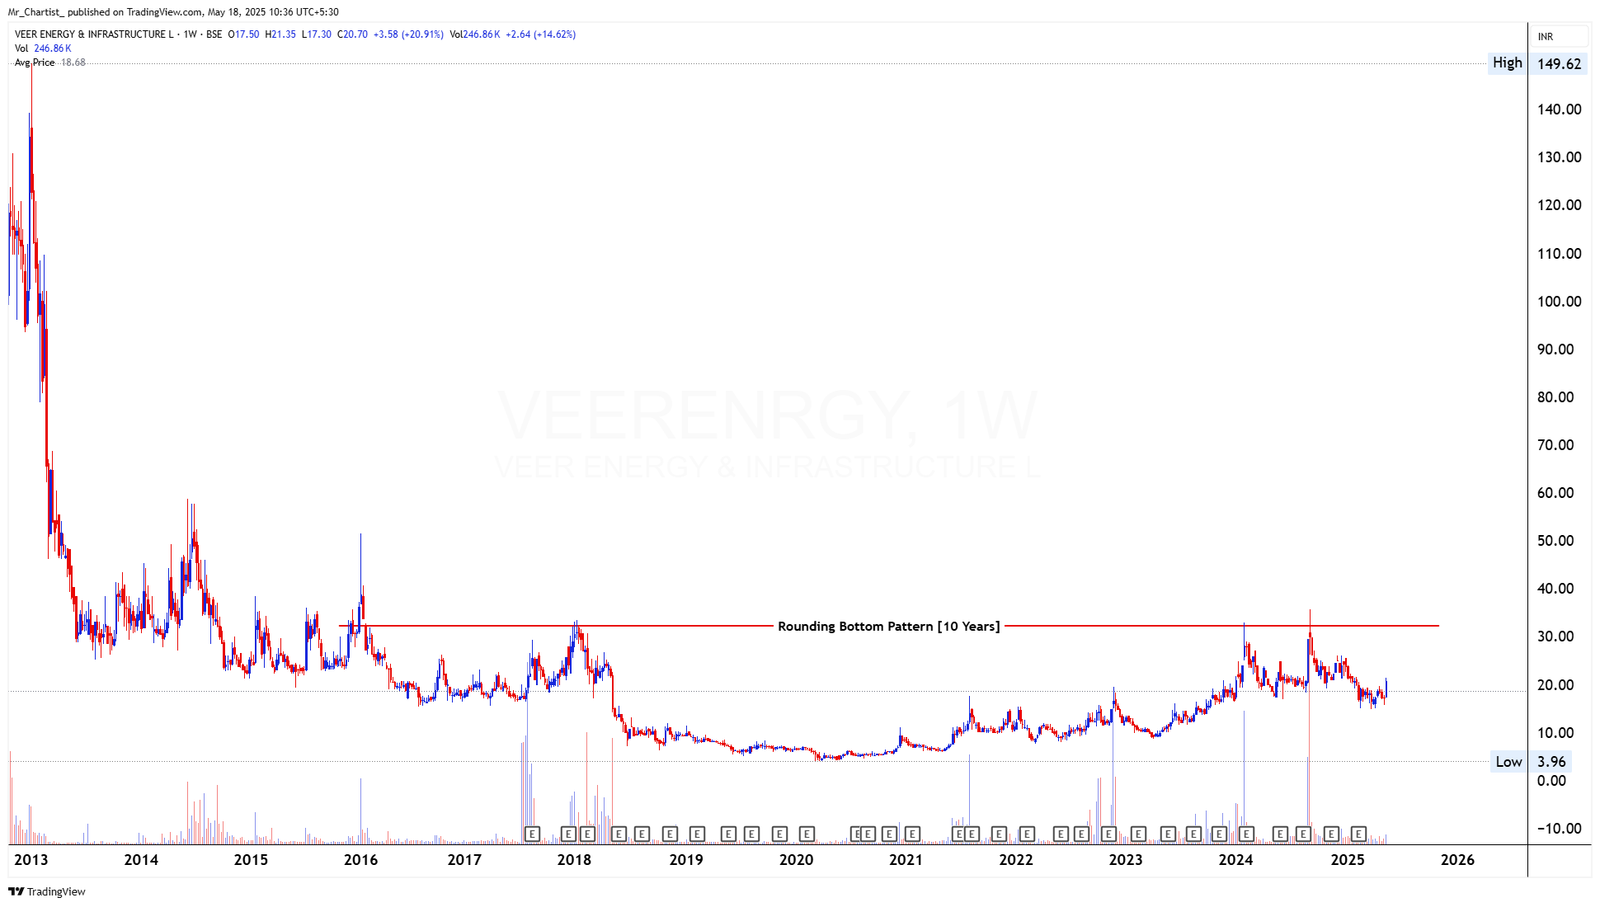
VEERENRGY
bearish fnoThe current weekly candle is a wide-bodied bullish bar, following multiple weeks
Rounding Bottom Pattern [10 Years]
Thesis & Analysis
Price Action Overview: VEERENRGY has been forming a multi-year rounding bottom base, with a flat neckline resistance around ₹32. Over the last several quarters, the stock has shown signs of accumulation within the ₹12–₹20 range, stabilizing after a prolonged downtrend. In recent weeks, price has rebounded sharply from the lower consolidation band near ₹16, forming a strong bullish candle. This move suggests early momentum building for a potential breakout toward the neckline zone. Candlestick Pattern: The current weekly candle is a wide-bodied bullish bar, following multiple weeks of lower wicks—indicating demand absorption and rejection of lower levels. Volume Analysis: Volume has expanded significantly on the latest up-move, suggesting rising participation and growing interest as price nears critical structural resistance. 2. Crucial Support and Resistance Levels Support Levels: ₹18: Immediate swing low and breakout base ₹15: Lower consolidation zone ₹12: Historical demand area and long-term base Resistance Levels: ₹24: Intermediate high and minor supply zone ₹28–₹32: Long-term neckline of the rounding bottom pattern ₹35+: Breakout extension zone if neckline clears 3. Strategic Trade Scenarios Bullish Scenario: A sustained move above ₹24 with follow-through could initiate a test of the ₹28– ₹32 neckline. A breakout above this 10-year resistance base would signal a major structural reversal with further upside potential toward ₹40+. Bearish Scenario: Failure to hold above ₹18 could lead to a retest of the ₹15–₹12 support band. Only a breakdown below ₹12 would invalidate the long-term rounding base structure and reintroduce bearish control.
Price Action
- ■Price action is structurally positive.
- ■Forming higher highs and higher lows.
Volume Profile
- ■Volume is supportive of the price action.
- ■Wait for volume expansion on breakout.
Key Levels
No zones specified
No zones specified
Invalidation Scenario
A weekly close below the support level invalidates this structure.
ONWARD TECHNOLOGIES
bearish fnoDouble Bottom Breakout
Daily Chart
Thesis & Analysis
No detailed thesis provided for this setup.
Price Action
- ■Price action is structurally positive.
- ■Forming higher highs and higher lows.
Volume Profile
- ■Volume is supportive of the price action.
- ■Wait for volume expansion on breakout.
Key Levels
No zones specified
No zones specified
Invalidation Scenario
A weekly close below the support level invalidates this structure.
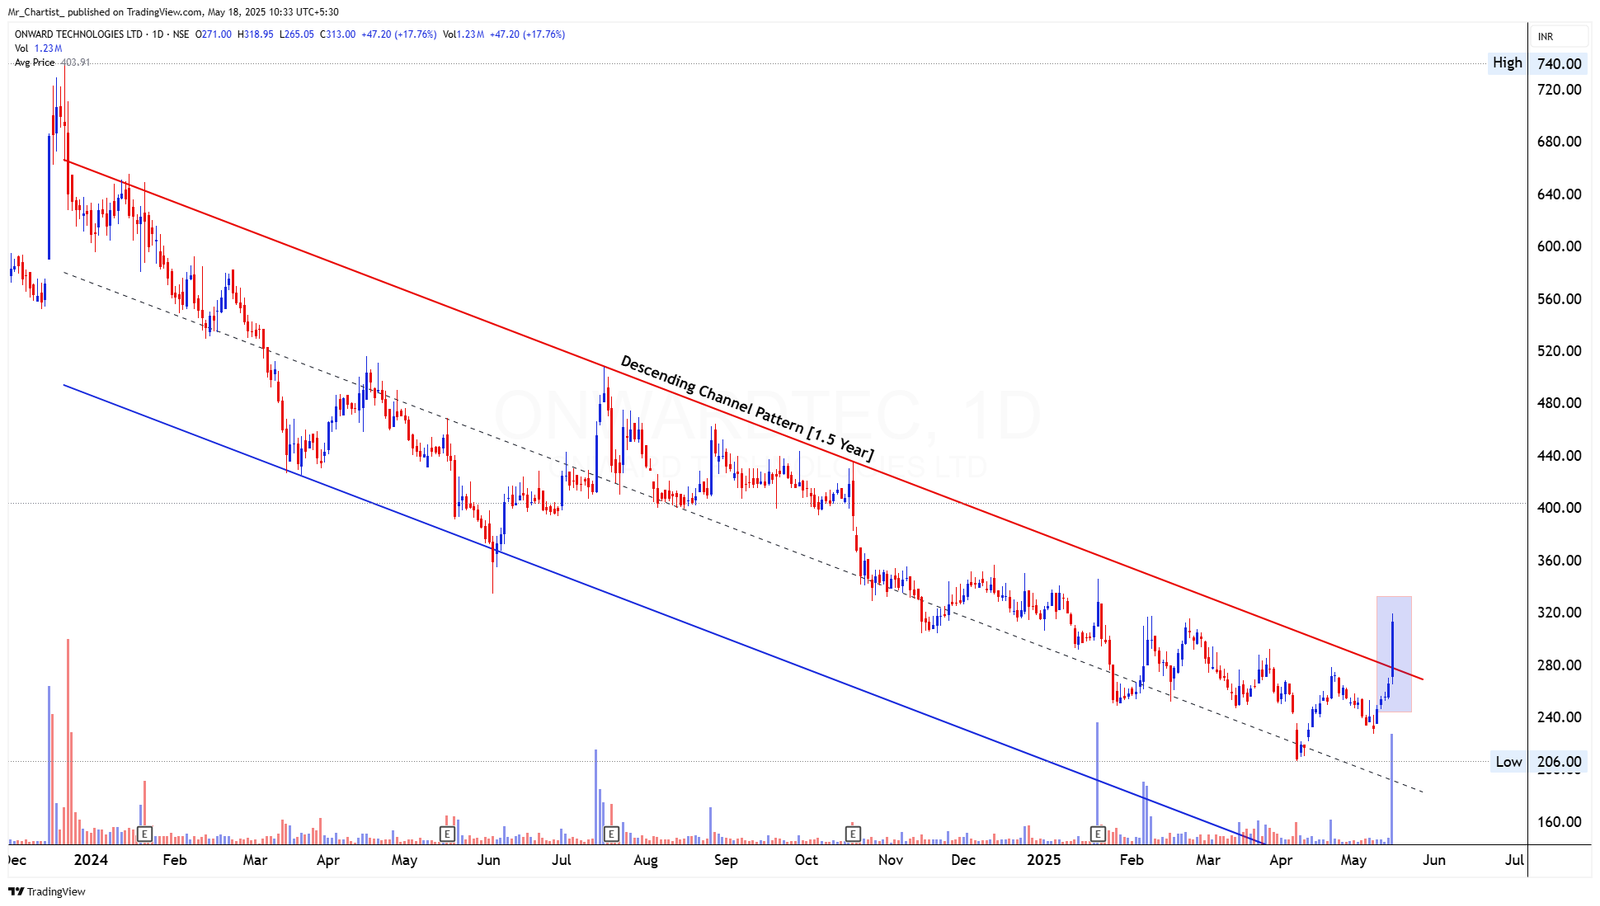
ONWARD TECHNOLOGIES
bearish fnoA large bullish candle has formed, engulfing the prior 5–6 sessions’ range. This
Descending Channel Pattern [1.5 Years]
Thesis & Analysis
Price Action Overview: ONWARDTEC has been moving within a well-defined descending channel since early 2023, making a series of lower highs and lower lows. However, in the last few sessions, the price has staged a strong upward breakout through the upper channel resistance line, indicating a potential shift in long-term trend direction. The breakout is clean and supported by a wide-range bullish candle, closing significantly above the channel's upper boundary—a structure that had capped all prior rallies. Candlestick Pattern: A large bullish candle has formed, engulfing the prior 5–6 sessions’ range. This breakout candle suggests strong conviction from buyers and a possible end to the prolonged downtrend. Volume Analysis: Volume surged sharply during the breakout, confirming strength and participation from institutional or momentum-driven activity. This breakout is well-supported by demand. 2. Crucial Support and Resistance Levels Support Levels: ₹290: Breakout retest zone and immediate support ₹270: Consolidation region pre-breakout ₹240: Lower pivot from recent swing base Resistance Levels: ₹340: Minor resistance from historical gap area ₹370–₹390: Supply zone from September 2023 cluster ₹420+: Extension target if momentum continues 3. Strategic Trade Scenarios Bullish Scenario: As long as price sustains above ₹290, the breakout structure remains valid. Follow- through toward ₹340 and ₹370+ is likely if momentum persists. A retest with consolidation above the breakout line would add further strength to the bullish case. Bearish Scenario: If price fails to hold above ₹290 and slips below ₹270, it could signal a false breakout. Breakdown below ₹240 would invalidate the bullish setup and possibly lead to re-entry into the channel.
Price Action
- ■Price action is structurally positive.
- ■Forming higher highs and higher lows.
Volume Profile
- ■Volume is supportive of the price action.
- ■Wait for volume expansion on breakout.
Key Levels
No zones specified
No zones specified
Invalidation Scenario
A weekly close below the support level invalidates this structure.
BPL LTD
bearish fnoDouble Bottom Breakout
Daily Chart
Thesis & Analysis
No detailed thesis provided for this setup.
Price Action
- ■Price action is structurally positive.
- ■Forming higher highs and higher lows.
Volume Profile
- ■Volume is supportive of the price action.
- ■Wait for volume expansion on breakout.
Key Levels
No zones specified
No zones specified
Invalidation Scenario
A weekly close below the support level invalidates this structure.
BPL LTD
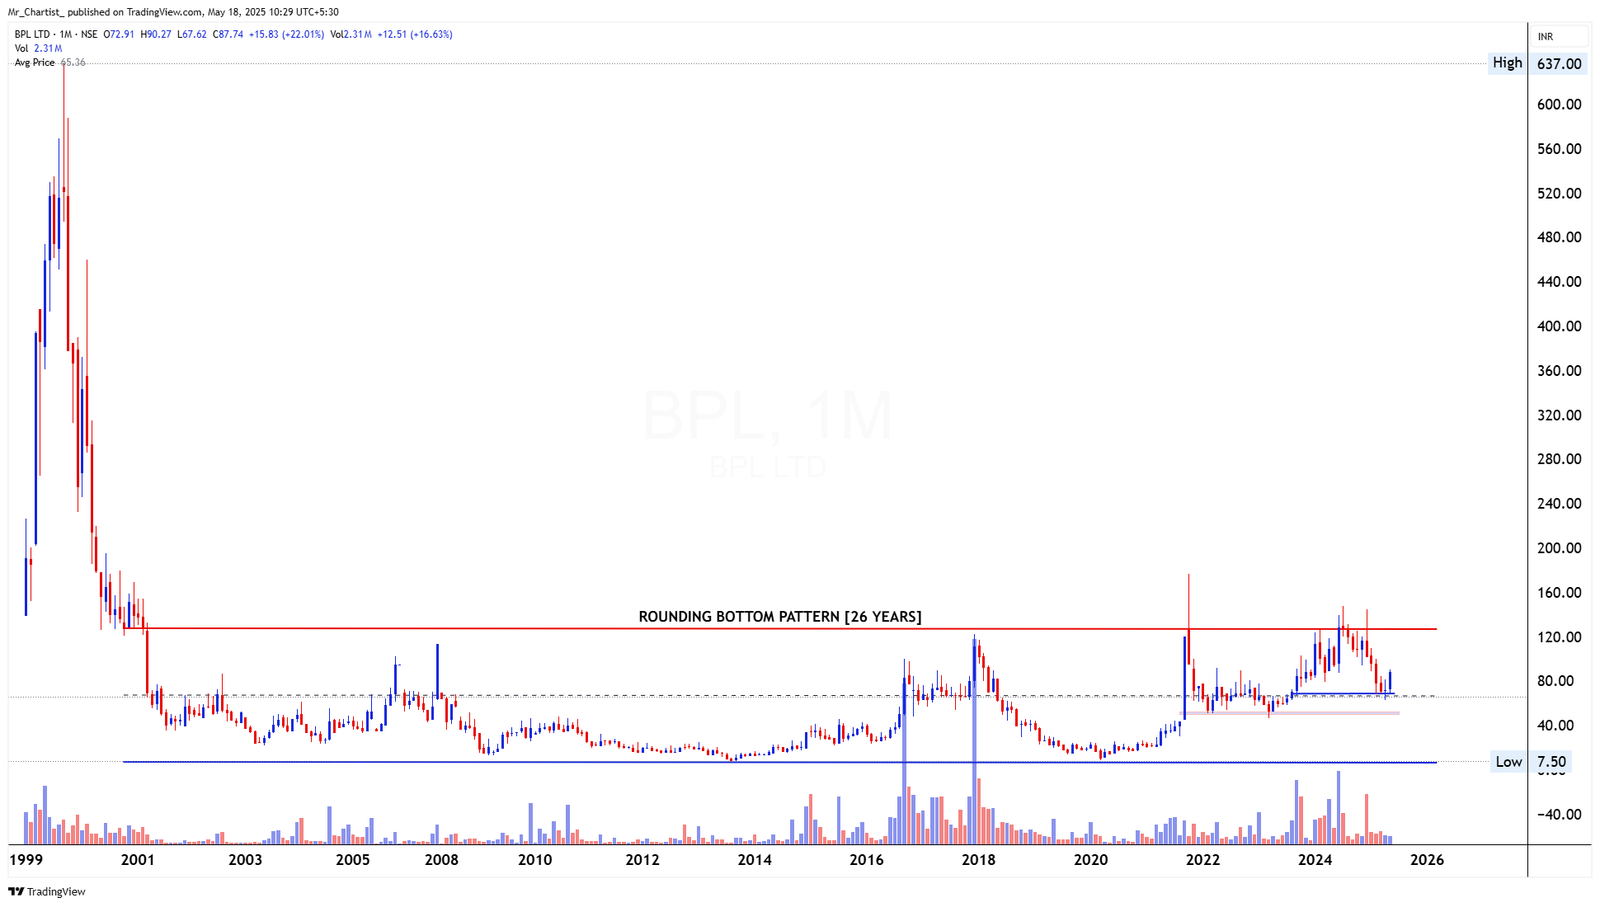
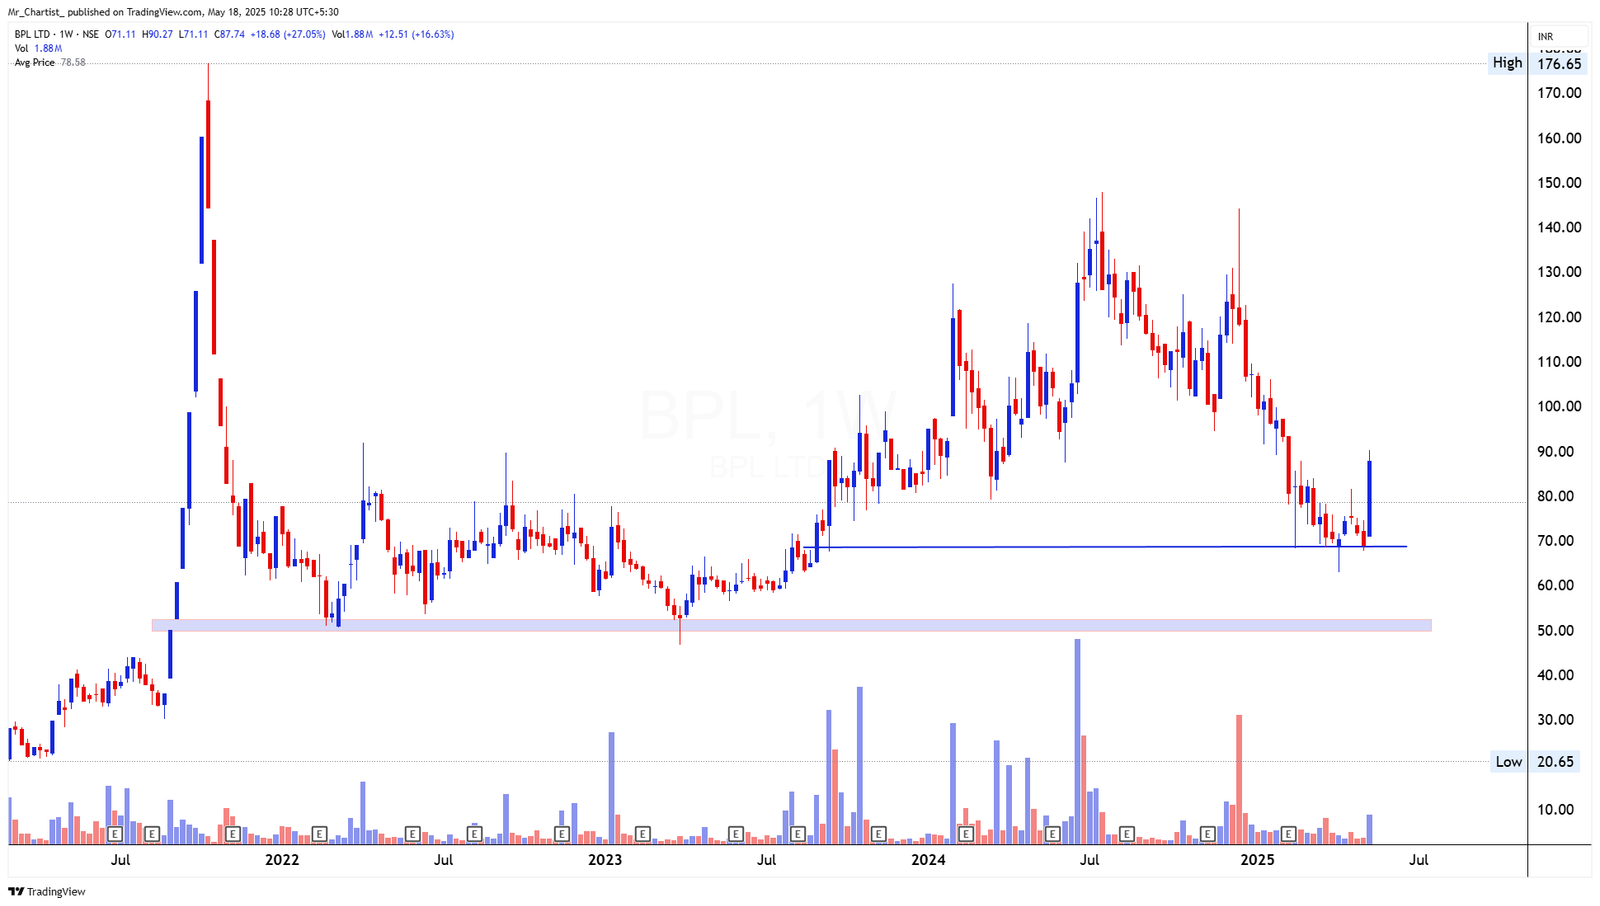
bearish fnoDouble Bottom Breakout
Rounding Bottom Pattern [26 Years]
Thesis & Analysis
Price Action Overview: BPL has been forming a massive rounding bottom base for over two decades. The monthly chart reveals a gradual curve-like recovery after years of range- bound action between ₹15 and ₹120. More recently, price respected long-term horizontal support near ₹68–₹70 and bounced sharply. On the weekly chart, the stock formed a base near this same zone before registering a breakout with a wide bullish candle. This rebound from structural support aligns with the broader rounding bottom setup nearing potential breakout phase. Candlestick Behavior: Strong weekly bullish candle off support. Long lower wicks on previous weeks also indicated absorption of supply at key support. Volume Analysis: Substantial volume surge in the recent weekly breakout reinforces the validity of the reversal attempt. Participation is increasing near critical levels. 2. Crucial Support and Resistance Levels Support Levels: ₹70–₹68: Multi-year structural support zone ₹55–₹50: Prior accumulation base and consolidation low Resistance Levels: ₹120–₹125: Multiple peaks from 2021–2023; neckline of rounding bottom ₹150+: Breakout zone above 26-year pattern; historical price congestion 3. Strategic Trade Scenarios Bullish Scenario: A close above ₹120 would trigger a confirmed breakout from the 26-year rounding bottom, potentially unlocking long-term upside toward ₹150 and above. Sustained price strength with volume follow-through would validate the move. Bearish Scenario: If price fails to sustain above ₹85–₹90 and breaks back below ₹70, it could revisit the broader base support at ₹55. Breakdown below ₹50 would invalidate the current structure.
Price Action
- ■Price action is structurally positive.
- ■Forming higher highs and higher lows.
Volume Profile
- ■Volume is supportive of the price action.
- ■Wait for volume expansion on breakout.
Key Levels
No zones specified
No zones specified
Invalidation Scenario
A weekly close below the support level invalidates this structure.
PEARL POLYMERS LTD
bearish fnoDouble Bottom Breakout
Daily Chart
Thesis & Analysis
No detailed thesis provided for this setup.
Price Action
- ■Price action is structurally positive.
- ■Forming higher highs and higher lows.
Volume Profile
- ■Volume is supportive of the price action.
- ■Wait for volume expansion on breakout.
Key Levels
No zones specified
No zones specified
Invalidation Scenario
A weekly close below the support level invalidates this structure.
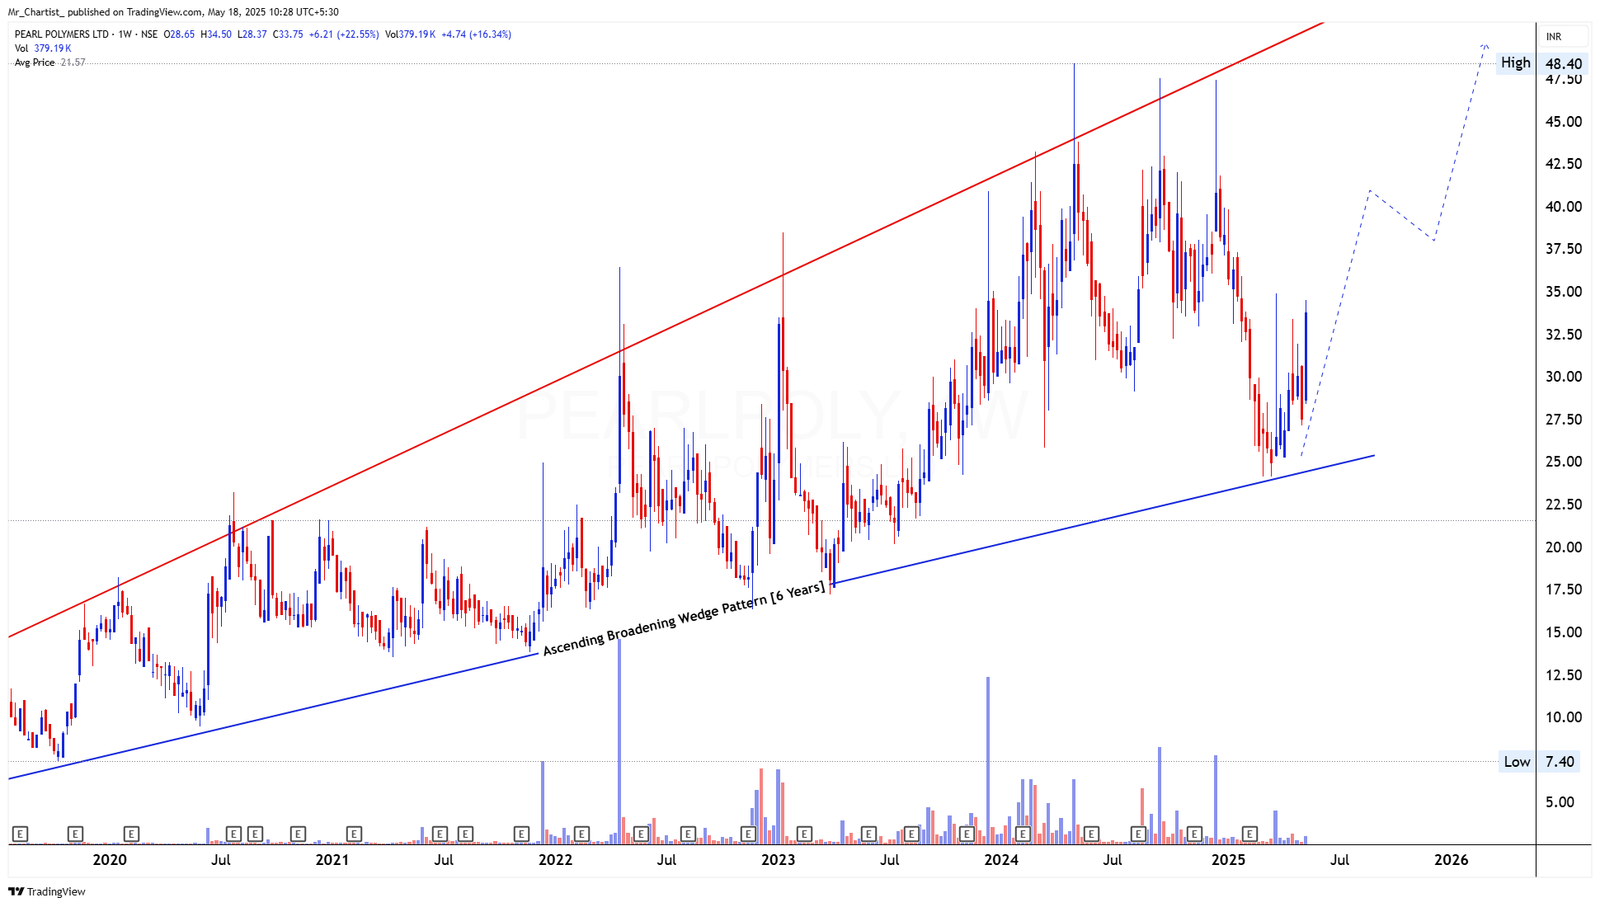
PEARL POLYMERS LTD
bearish fnoDouble Bottom Breakout
Ascending Broadening Wedge [6
Thesis & Analysis
Years] Price Action Overview: Pearl Polymers is trading within a long-term ascending broadening wedge, with price making higher highs and higher lows for the past six years. The most recent price action shows a strong bounce from the lower wedge boundary near ₹26, signaling renewed buying interest at structural support. The wide-bodied bullish candle breaking past previous week’s highs confirms momentum has shifted favorably in the near term. Candlestick Behavior: A strong bullish weekly candle has formed after a prolonged decline. This suggests a reversal from support with intent. Volume Analysis: Volume spiked significantly during the bounce, lending credibility to the move and indicating potential accumulation near the wedge support. 2. Crucial Support and Resistance Levels Support Levels: ₹26: Lower wedge boundary and recent swing low ₹22: Secondary support zone from prior wedge touchpoints Resistance Levels: ₹39–₹41: Mid-wedge supply area and minor price shelf ₹48: Upper wedge boundary; tested multiple times over past two years 3. Strategic Trade Scenarios Bullish Scenario: A sustained move above ₹35 could target the ₹39–₹41 zone, with potential to test ₹48 if follow-through volume supports the trend. Structure remains bullish within the wedge. Bearish Scenario: Failure to hold ₹30–₹28 on retests could reopen downside toward ₹26 and ₹22. Breakdown below ₹22 would invalidate the ascending wedge structure and suggest reversal risk.
Price Action
- ■Price action is structurally positive.
- ■Forming higher highs and higher lows.
Volume Profile
- ■Volume is supportive of the price action.
- ■Wait for volume expansion on breakout.
Key Levels
No zones specified
No zones specified
Invalidation Scenario
A weekly close below the support level invalidates this structure.
DREDGING CORP OF INDIA
bearish fnoDouble Bottom Breakout
Daily Chart
Thesis & Analysis
No detailed thesis provided for this setup.
Price Action
- ■Price action is structurally positive.
- ■Forming higher highs and higher lows.
Volume Profile
- ■Volume is supportive of the price action.
- ■Wait for volume expansion on breakout.
Key Levels
No zones specified
No zones specified
Invalidation Scenario
A weekly close below the support level invalidates this structure.

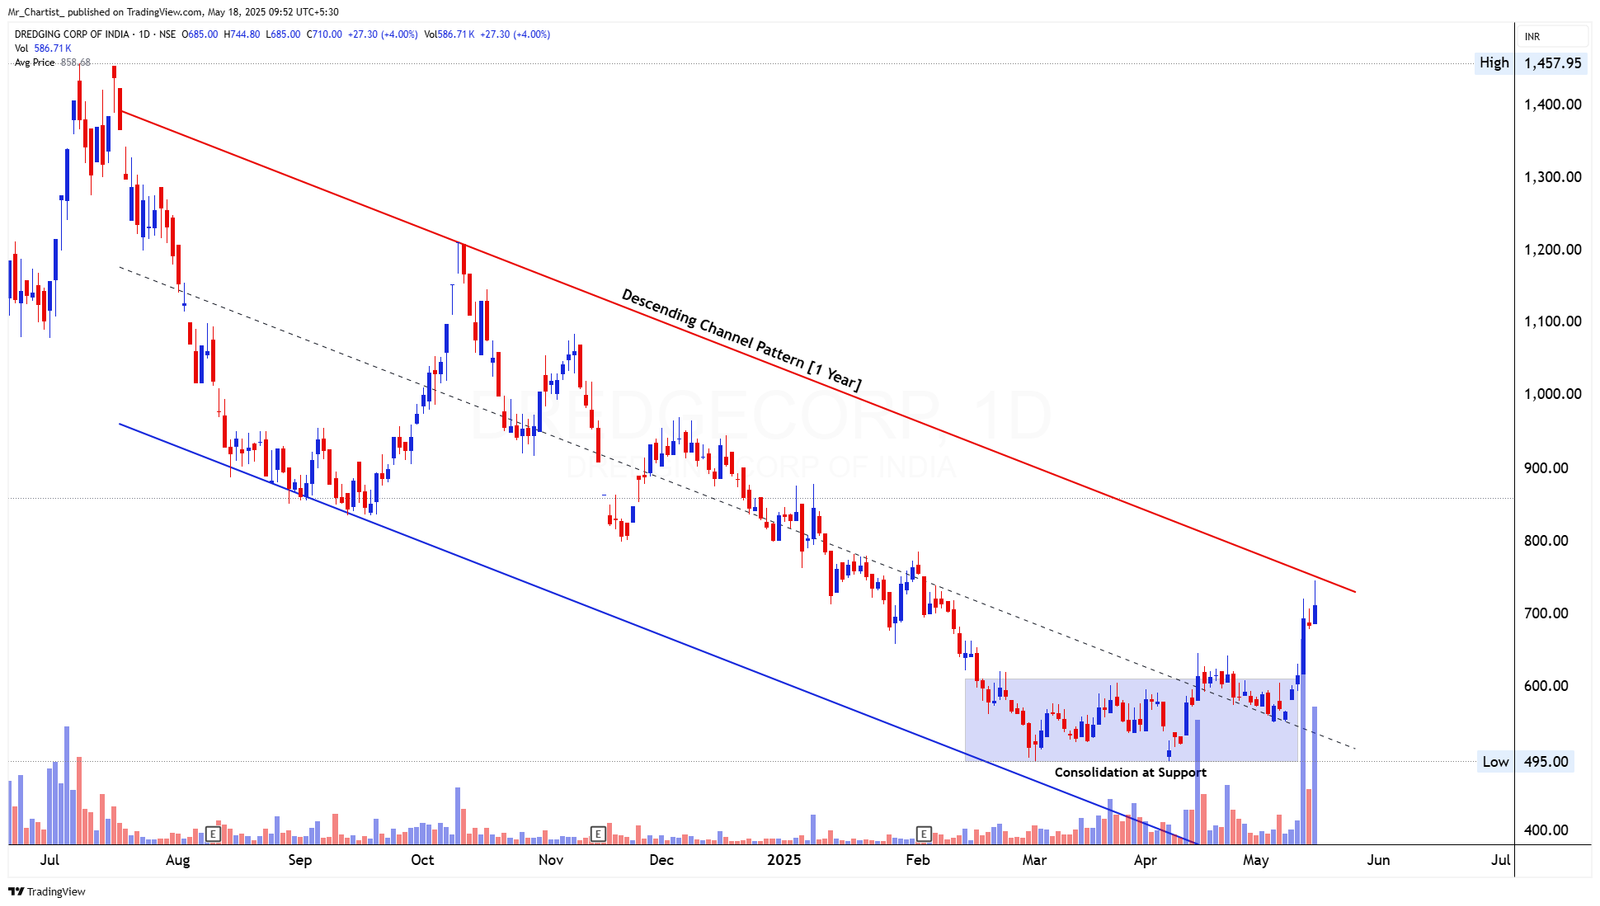
DREDGING CORP OF INDIA
bearish fnoDouble Bottom Breakout
Descending Channel Pattern [1 Year]
Thesis & Analysis
with Base Consolidation [2.5 Months] Price Action Overview: After a steady year-long decline within a descending channel, the stock recently formed a base with sideways movement near ₹570–₹600. This consolidation at support coincided with the lower channel boundary, setting up a potential reversal. The breakout from the consolidation has now propelled price out of the channel’s median line with a strong bullish candle. Candlestick Behavior: A wide-bodied bullish candle broke above the consolidation range with conviction. This candle marks the first major sign of strength after a prolonged decline. Volume Analysis: Volume surged significantly on the breakout, confirming strong participation and validating the upward momentum. 2. Crucial Support and Resistance Levels Support Levels: ₹600: Former consolidation ceiling, now acting as support ₹570: Consolidation floor ₹495: Channel base and long-term swing low Resistance Levels: ₹750: Upper channel resistance ₹800–₹820: Prior reversal zone; next key hurdle 3. Strategic Trade Scenarios Bullish Scenario: If price sustains above ₹700, a test of ₹750 followed by ₹800 appears likely. A continuation pattern above these zones may lead to a larger reversal structure in the making. Bearish Scenario: Failure to hold above ₹600 could signal a false breakout, triggering a pullback toward ₹570 or lower. Re-entry into the channel would weaken the bullish thesis.
Price Action
- ■Price action is structurally positive.
- ■Forming higher highs and higher lows.
Volume Profile
- ■Volume is supportive of the price action.
- ■Wait for volume expansion on breakout.
Key Levels
No zones specified
No zones specified
Invalidation Scenario
A weekly close below the support level invalidates this structure.
WALCHANNAG
bearish fnoDouble Bottom Breakout
Daily Chart
Thesis & Analysis
No detailed thesis provided for this setup.
Price Action
- ■Price action is structurally positive.
- ■Forming higher highs and higher lows.
Volume Profile
- ■Volume is supportive of the price action.
- ■Wait for volume expansion on breakout.
Key Levels
No zones specified
No zones specified
Invalidation Scenario
A weekly close below the support level invalidates this structure.
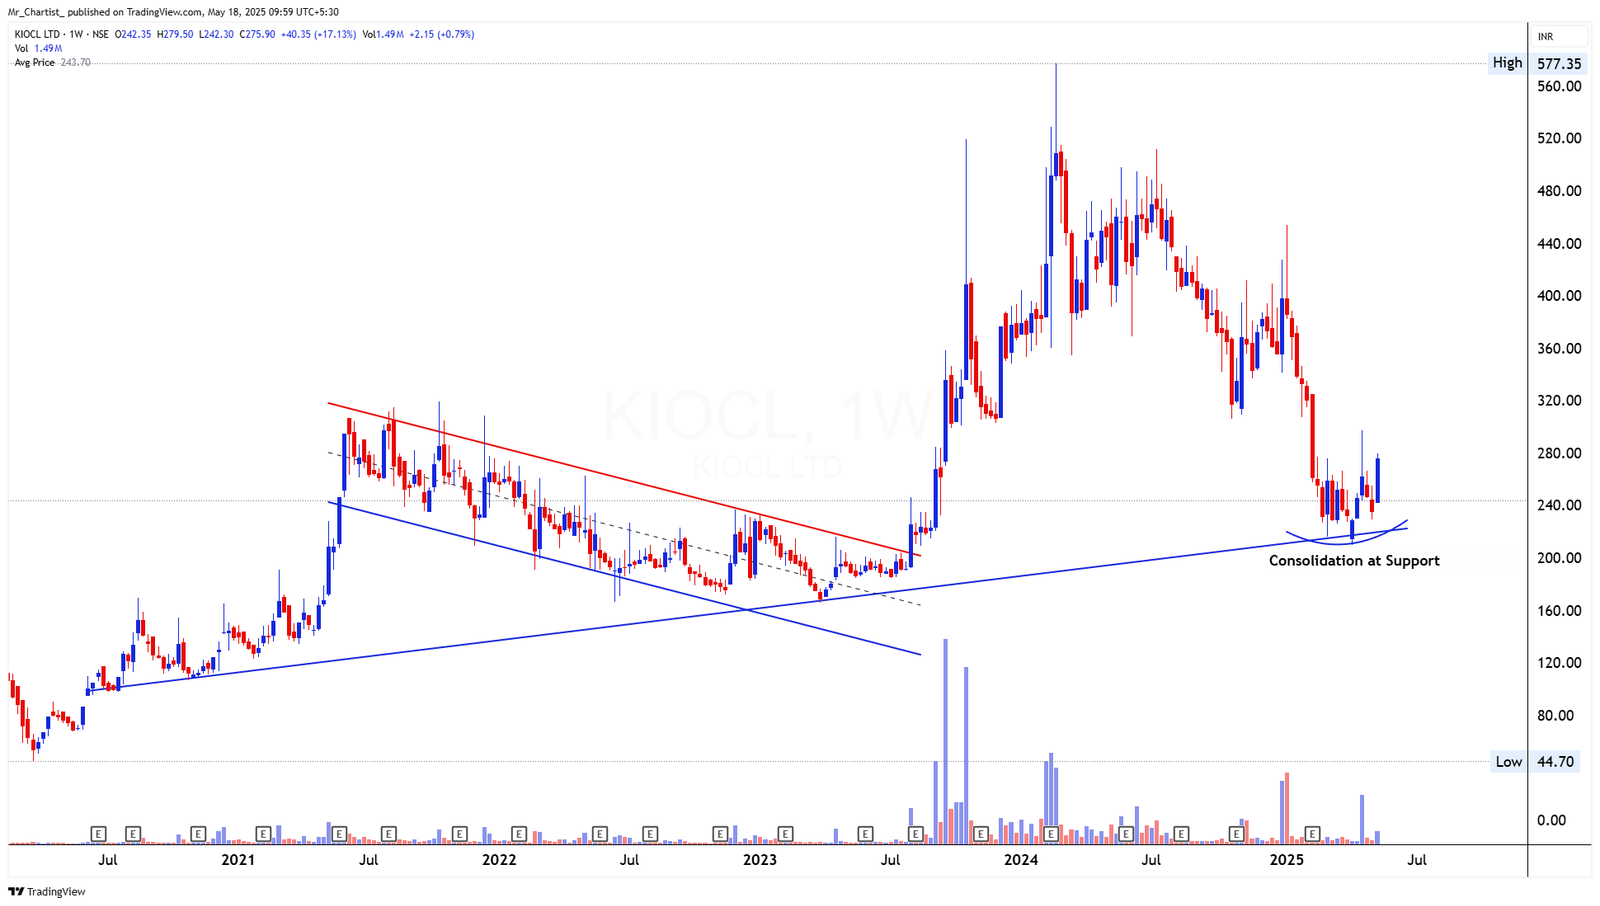
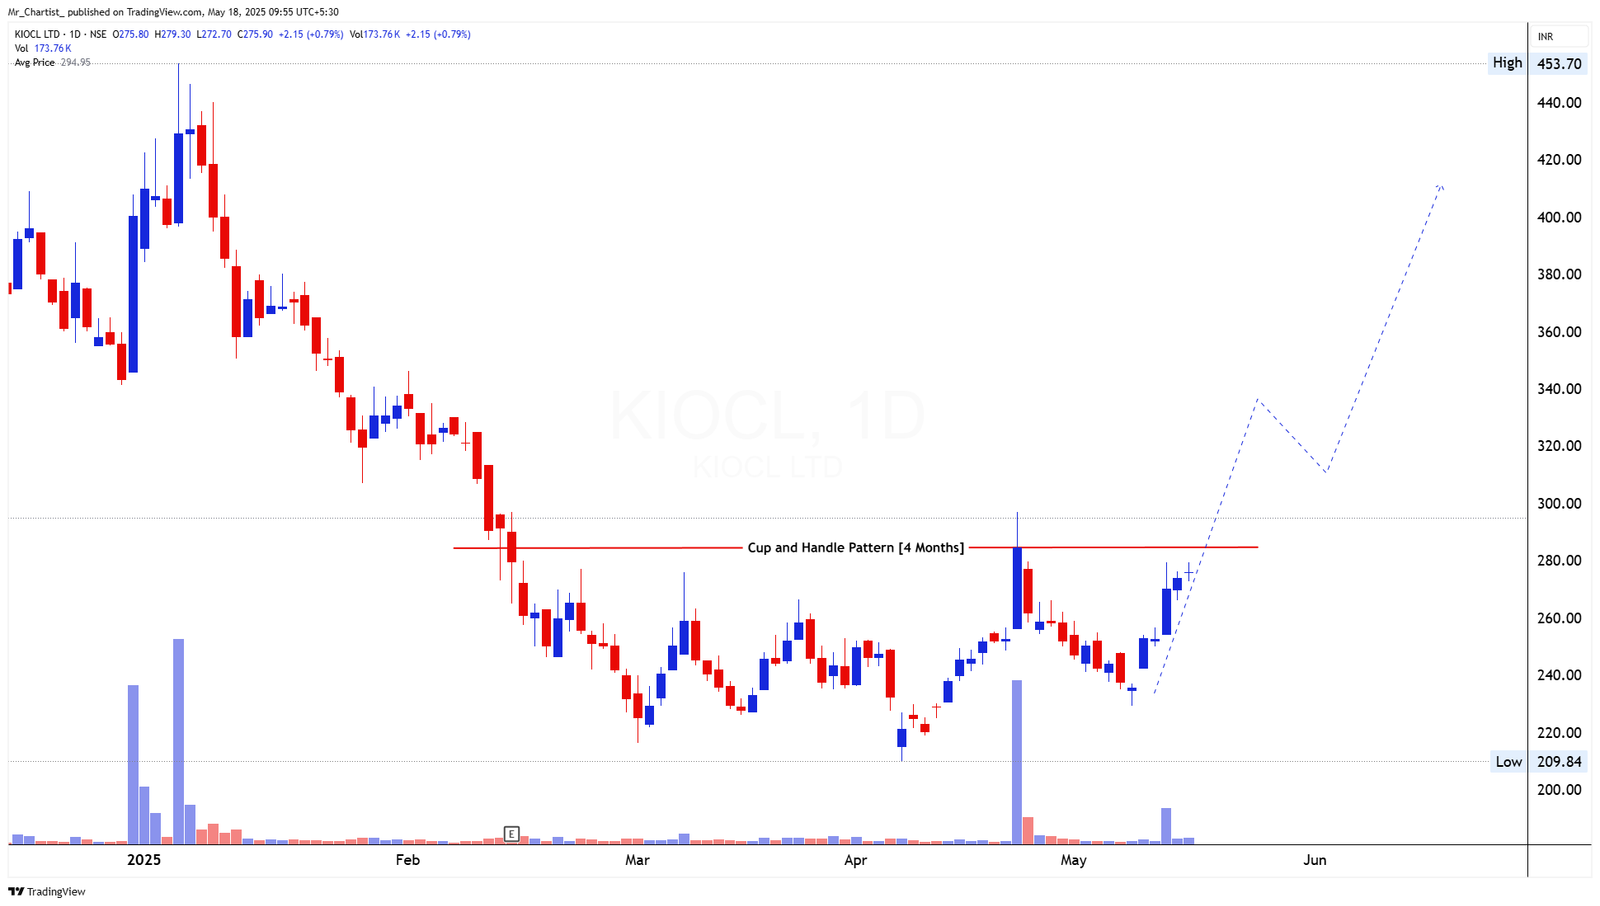
WALCHANNAG
bearish fnoDouble Bottom Breakout
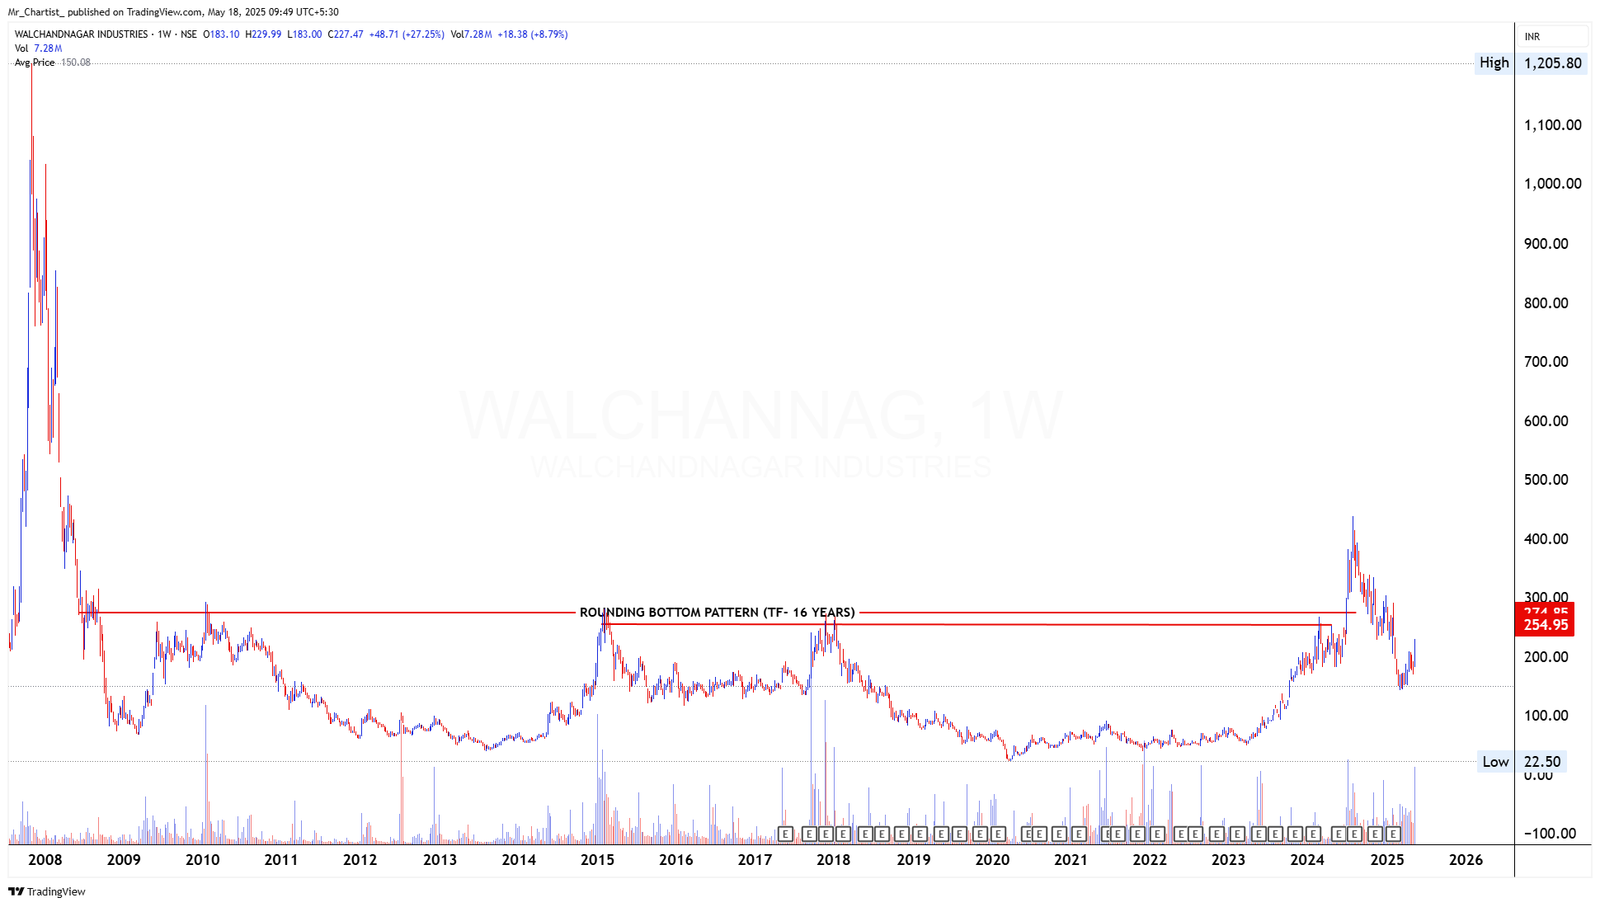
Rounding Bottom Pattern [16 Years] on the monthly chart
Thesis & Analysis
Descending Channel Pattern [1 Year] on the daily chart Price Action Overview: The long-term structure reflects a 16-year rounding bottom base with major resistance near ₹275. After the 2023 rally, prices corrected inside a well- defined descending channel. Recent price action shows a breakout above this channel with a strong bullish candle. Candlestick & Volume Insight: A long-bodied bullish candle has pierced the upper channel trendline with strong volume, indicating buying interest and early breakout confirmation from the corrective structure. 2. Crucial Support and Resistance Levels Support Levels: ₹240: Breakout zone of descending channel ₹210: Minor swing low within the pattern ₹180: Base support in case of deep pullbacks Resistance Levels: ₹275: Long-term resistance from rounding bottom neckline ₹320–₹340: Next upside cluster from historical price rejection 3. Strategic Trade Scenarios Bullish Scenario: If the price sustains above ₹240–₹250, continuation toward ₹275 and beyond could unfold. Follow-through candles and rising volume would add confidence. Bearish Scenario: A failure to sustain above ₹240 followed by a close back inside the channel could suggest a false breakout. Price might then revisit ₹210–₹180 zone for reaccumulation.
Price Action
- ■Price action is structurally positive.
- ■Forming higher highs and higher lows.
Volume Profile
- ■Volume is supportive of the price action.
- ■Wait for volume expansion on breakout.
Key Levels
No zones specified
No zones specified
Invalidation Scenario
A weekly close below the support level invalidates this structure.
HCL INSYS
bearish fnoDouble Bottom Breakout
Daily Chart
Thesis & Analysis
No detailed thesis provided for this setup.
Price Action
- ■Price action is structurally positive.
- ■Forming higher highs and higher lows.
Volume Profile
- ■Volume is supportive of the price action.
- ■Wait for volume expansion on breakout.
Key Levels
No zones specified
No zones specified
Invalidation Scenario
A weekly close below the support level invalidates this structure.
Chart Image Not Extracted
HCL INSYS
bearish fnoDouble Bottom Breakout
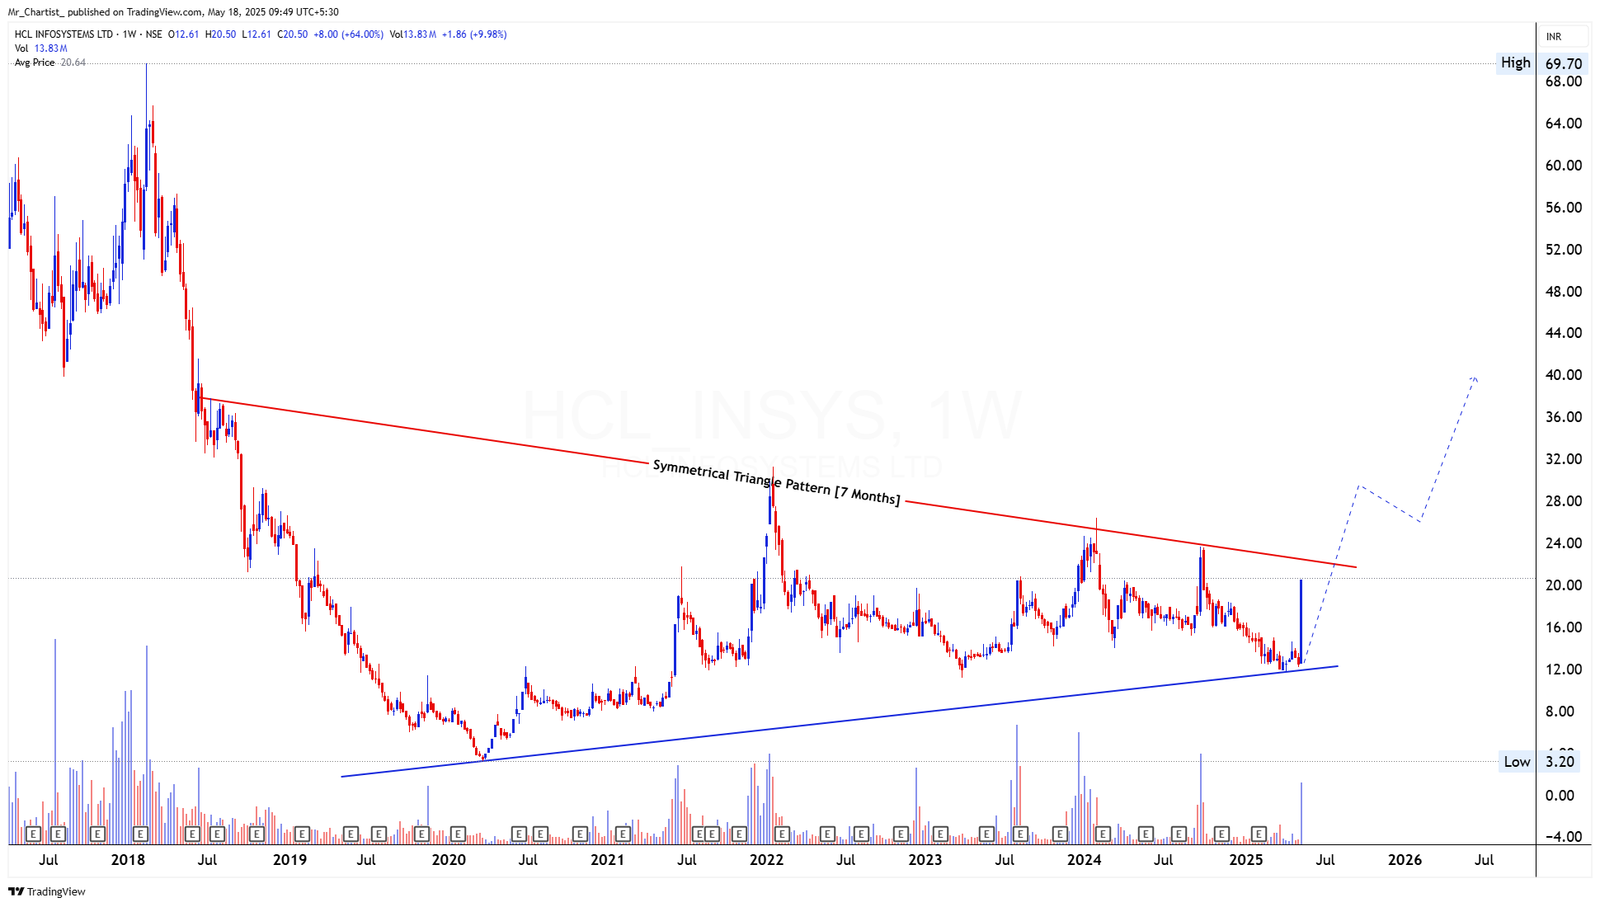
Symmetrical Triangle Pattern [7
Thesis & Analysis
Years] Price Action Overview: HCL Infosystems is attempting a breakout from a 7-years symmetrical triangle pattern, with the structure forming higher lows since late 2023. The price recently bounced sharply from the triangle’s lower boundary, approaching the upper resistance trendline near ₹22–₹24. Candlestick Behavior: A strong wide-range bullish candle has emerged near the support trendline, suggesting renewed buying momentum. The move indicates a possible breakout attempt in the coming weeks. Volume Analysis: Volume surged alongside the bullish candle, marking one of the highest weekly participation levels in recent months — a positive sign of accumulation and rising interest at lower levels. 2. Crucial Support and Resistance Levels Support Levels: ₹17.50: Immediate support zone from recent swing low. ₹13.00: Rising trendline and long-term base. Resistance Levels: ₹22.00–₹24.00: Triangle resistance trendline and breakout zone. ₹28.00: Prior swing high, potential target post-breakout. 3. Strategic Trade Scenarios Primary Setup (Bullish Triangle Breakout): A breakout above ₹24 with strong volume confirmation can trigger an upside continuation, potentially targeting ₹28 and above based on pattern projection. Trigger: Sustained close above ₹24 with volume expansion. Targets: ₹28 (initial), ₹34 (pattern-based extension). Alternative Scenario (Pullback Within Triangle): If price fails near ₹24 and reverses, a retest toward ₹17.50–₹18.00 may occur before another attempt. Breakdown below ₹17.50 would weaken the setup.
Price Action
- ■Price action is structurally positive.
- ■Forming higher highs and higher lows.
Volume Profile
- ■Volume is supportive of the price action.
- ■Wait for volume expansion on breakout.
Key Levels
No zones specified
No zones specified
Invalidation Scenario
A weekly close below the support level invalidates this structure.
APOLLO MICRO SYSTEMS
bearish fnoDouble Bottom Breakout
Daily Chart
Thesis & Analysis
No detailed thesis provided for this setup.
Price Action
- ■Price action is structurally positive.
- ■Forming higher highs and higher lows.
Volume Profile
- ■Volume is supportive of the price action.
- ■Wait for volume expansion on breakout.
Key Levels
No zones specified
No zones specified
Invalidation Scenario
A weekly close below the support level invalidates this structure.
APOLLO MICRO SYSTEMS
bearish fnoDouble Bottom Breakout
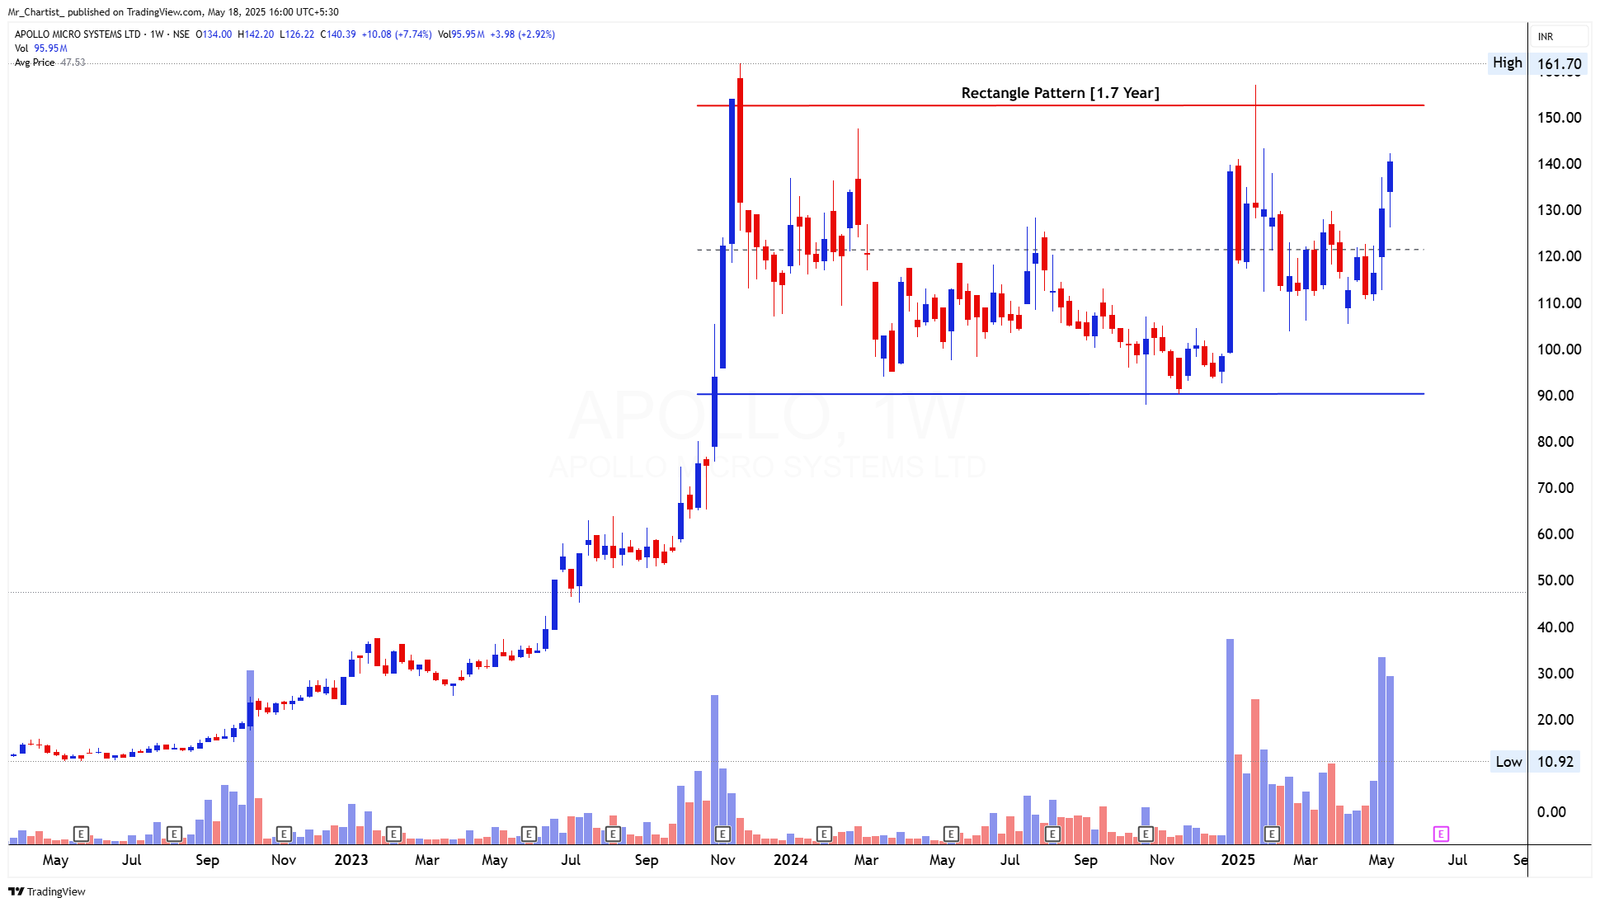
Rectangle Pattern [1.7 Years]
Thesis & Analysis
Price Action Overview: The stock has been consolidating within a defined rectangle range for nearly 1.7 years, with strong resistance around ₹150 and support near ₹93. The recent weekly candle shows a sharp bullish move from the lower support, testing the upper band again, reflecting rising momentum and accumulation at lower levels. Candlestick Behavior: Last two candles are wide-ranged and strongly bullish, indicating a surge in buying interest. Price has approached the resistance zone with strength, hinting at a potential breakout attempt if follow-through persists. Volume Analysis: Volume has expanded notably in the past two weeks, especially on bullish sessions, indicating strong participation as price moves toward the upper resistance. 2. Crucial Support and Resistance Levels Support Levels: ₹125: Mid-range support from past multiple rejections ₹93: Rectangle base and key long-term support Resistance Levels: ₹150: Rectangle top – a breakout above this confirms the range exit ₹161.70: All-time high mark; breakout zone from late 2023 3. Strategic Trade Scenarios Primary Setup (Bullish Breakout Anticipation): If the price sustains above ₹145–₹150, a breakout above the rectangle may trigger fresh upside momentum. The pattern height suggests potential towards ₹175– ₹185. Trigger: Weekly close above ₹150 with high volume Target Zones: ₹175 (initial), ₹185–₹200 (extended) Alternative Scenario (Range Continuation): If price faces rejection again at ₹150, it may drift back into the rectangle, offering a retracement towards ₹125 or ₹93. Failure Trigger: Rejection candle followed by breakdown below ₹125 Downside Levels: ₹110, then ₹93 as long-term floor
Price Action
- ■Price action is structurally positive.
- ■Forming higher highs and higher lows.
Volume Profile
- ■Volume is supportive of the price action.
- ■Wait for volume expansion on breakout.
Key Levels
No zones specified
No zones specified
Invalidation Scenario
A weekly close below the support level invalidates this structure.
TATA TECHNOLOGIES
bearish fnoDouble Bottom Breakout
Daily Chart
Thesis & Analysis
No detailed thesis provided for this setup.
Price Action
- ■Price action is structurally positive.
- ■Forming higher highs and higher lows.
Volume Profile
- ■Volume is supportive of the price action.
- ■Wait for volume expansion on breakout.
Key Levels
No zones specified
No zones specified
Invalidation Scenario
A weekly close below the support level invalidates this structure.
TATA TECHNOLOGIES
bearish fnoDouble Bottom Breakout
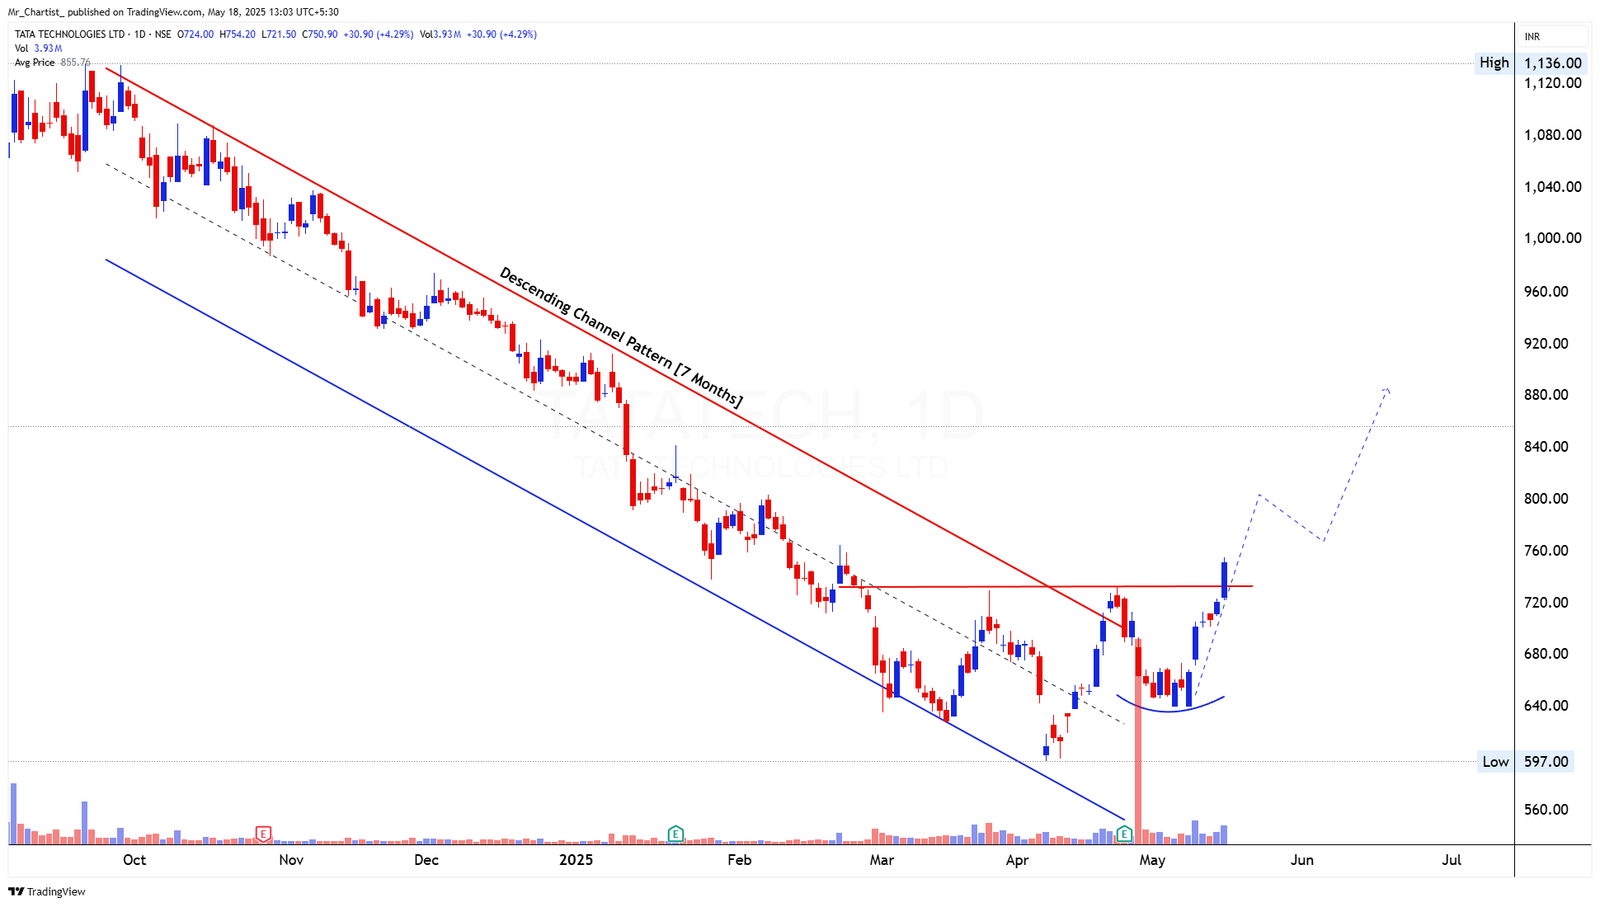
Descending Channel +Cup and Handle [7
Thesis & Analysis
Months] Price Action Overview: Tata Tech has broken out of a well-defined descending channel that had constrained price for over 7 months. After forming a rounded base near ₹640, the stock surged past the upper boundary of both the channel and a horizontal resistance near ₹735. Candlestick Behavior: The breakout candle is strong and bullish, closing well above prior resistance with a wide body, reflecting momentum-driven buying after base formation. Volume Analysis: Volume has picked up sharply over the past few sessions, particularly during the breakout, signaling high conviction behind the move and confirming the reversal from the bottom. 2. Crucial Support and Resistance Levels Support Levels: ₹735: Recent breakout zone; now acting as immediate support ₹690: Rounded base neckline ₹640: Pattern low and demand zone Resistance Levels: ₹795: Minor supply zone from mid-March ₹840–₹880: Potential upside range based on pattern projection 3. Strategic Trade Scenarios Primary Setup (Bullish Breakout Continuation): A breakout from the channel and rounding bottom hints at trend reversal. Sustaining above ₹735 keeps the structure bullish with room to test ₹795–₹880. Trigger: Daily close above ₹735 with continued volume expansion Target Zones: ₹795 (initial), ₹840–₹880 (measured move) Alternative Scenario (Failed Breakout): If the price slips back below ₹735 on weak volume, a retest toward ₹690 or ₹640 may occur before resuming higher. Failure Trigger: Breakdown below ₹690 Support Watch: ₹640 as structural pivot level
Price Action
- ■Price action is structurally positive.
- ■Forming higher highs and higher lows.
Volume Profile
- ■Volume is supportive of the price action.
- ■Wait for volume expansion on breakout.
Key Levels
No zones specified
No zones specified
Invalidation Scenario
A weekly close below the support level invalidates this structure.
SANGAMIND
bearish fnoDouble Bottom Breakout
Daily Chart
Thesis & Analysis
No detailed thesis provided for this setup.
Price Action
- ■Price action is structurally positive.
- ■Forming higher highs and higher lows.
Volume Profile
- ■Volume is supportive of the price action.
- ■Wait for volume expansion on breakout.
Key Levels
No zones specified
No zones specified
Invalidation Scenario
A weekly close below the support level invalidates this structure.

SANGAMIND
bearish fnoDouble Bottom Breakout
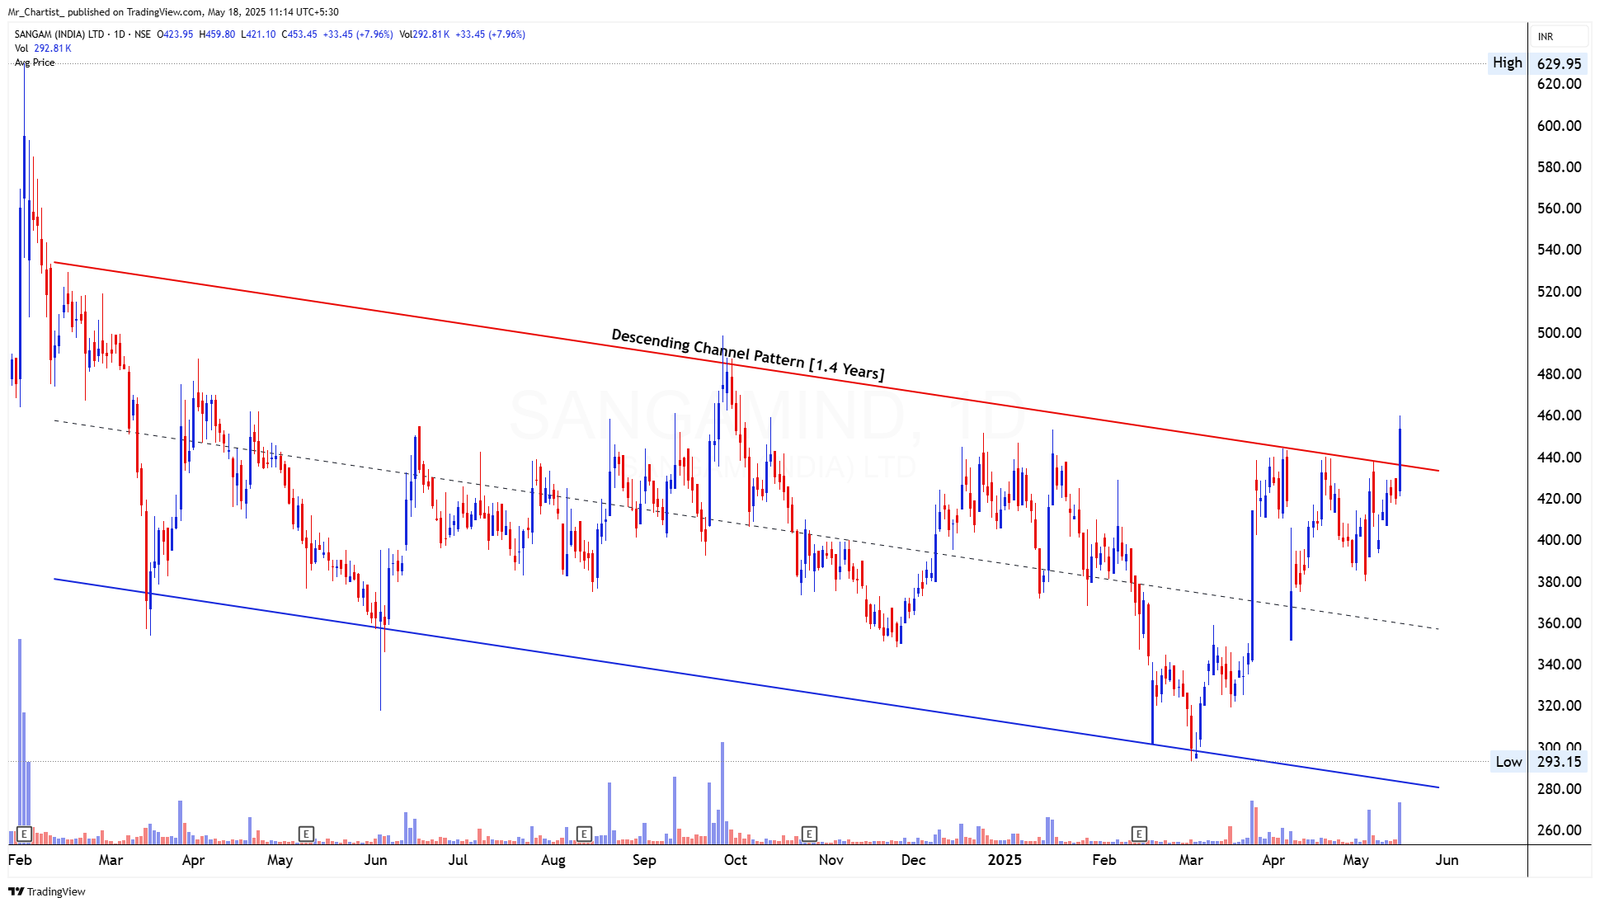
Descending Channel Pattern [1.4 Years]
Thesis & Analysis
Price Action Overview: Sangam India has broken out of a 1.4-year descending channel, piercing through the upper boundary near ₹430. The stock showed multiple rejections around this zone earlier, but the current breakout is more convincing due to bullish follow- through and volume alignment. Candlestick Behavior: A strong bullish candle has formed at the breakout point with a wide body, indicating momentum and aggressive buying interest after a prolonged range. Volume Analysis: The volume on the breakout day surged meaningfully above the recent average, confirming accumulation and validating the breakout structure. 2. Crucial Support and Resistance Levels Support Levels: ₹430: Immediate breakout level and short-term support ₹390: Mid-channel pivot zone ₹360: Prior reaction lows within the pattern Resistance Levels: ₹465–₹480: Minor hurdle from October 2023 swing ₹520–₹550: Upper target zone based on channel height projection 3. Strategic Trade Scenarios Primary Setup (Bullish Breakout): The channel breakout aligns with a trend reversal signal. Sustaining above ₹430 keeps the upward bias intact with scope to move toward ₹480–₹550. Trigger: Holding above ₹430 with steady or rising volumes Target Zones: ₹480 (initial), ₹520–₹550 (extended range) Alternative Scenario (Breakout Retest): A fallback below ₹430 may signal a retest. If the retest holds above ₹390, bullish structure remains valid. A close below ₹390 may weaken the breakout case. Failure Trigger: Breakdown below ₹390 with volume rise Support Watch: ₹360 for structure re-evaluation
Price Action
- ■Price action is structurally positive.
- ■Forming higher highs and higher lows.
Volume Profile
- ■Volume is supportive of the price action.
- ■Wait for volume expansion on breakout.
Key Levels
No zones specified
No zones specified
Invalidation Scenario
A weekly close below the support level invalidates this structure.
MEDPLUS
bearish fnoDouble Bottom Breakout
Daily Chart
Thesis & Analysis
No detailed thesis provided for this setup.
Price Action
- ■Price action is structurally positive.
- ■Forming higher highs and higher lows.
Volume Profile
- ■Volume is supportive of the price action.
- ■Wait for volume expansion on breakout.
Key Levels
No zones specified
No zones specified
Invalidation Scenario
A weekly close below the support level invalidates this structure.
MEDPLUS
bearish fnoDouble Bottom Breakout
Symmetrical Triangle Pattern [3.2 Years]
Thesis & Analysis
Price Action Overview: MEDPLUS has broken out of a multi-year symmetrical triangle, breaching the descending trendline resistance with a sharp upmove this week. This marks the first decisive attempt to exit the range since early 2022, indicating potential for a major trend shift. Candlestick Behavior: The breakout candle is large and bullish, decisively closing above the triangle resistance and surpassing all prior swing highs since early 2024. Volume Analysis: Volume has expanded significantly on the breakout, validating the strength of the move and showing signs of renewed interest after a prolonged contraction phase. 2. Crucial Support and Resistance Levels Support Levels: ₹820–₹800: Breakout retest zone ₹750: Prior swing resistance turned support ₹680: Triangle baseline and structure low Resistance Levels: ₹900–₹920: Initial reaction high zone ₹1,000+: Psychological and round-number resistance ₹1,150: Mid-2022 supply area 3. Strategic Trade Scenarios Primary Setup (Bullish Breakout): A close above the triangle peak confirms long-term breakout potential. If price sustains above ₹820, continuation toward ₹920 and ₹1,000+ is likely. Trigger: Sustained move above ₹850–₹860 Target Zones: ₹920, ₹1,000, then ₹1,150 Alternative Scenario (Breakout Retest): A pullback toward ₹800 may occur to retest the breakout line. Holding this zone keeps the bullish bias intact. A breakdown below ₹750 may delay further upside. Failure Trigger: Break below ₹750 on volume Downside Risk: ₹680 zone for deeper support
Price Action
- ■Price action is structurally positive.
- ■Forming higher highs and higher lows.
Volume Profile
- ■Volume is supportive of the price action.
- ■Wait for volume expansion on breakout.
Key Levels
No zones specified
No zones specified
Invalidation Scenario
A weekly close below the support level invalidates this structure.
SDBL
bearish fnoDouble Bottom Breakout
Daily Chart
Thesis & Analysis
No detailed thesis provided for this setup.
Price Action
- ■Price action is structurally positive.
- ■Forming higher highs and higher lows.
Volume Profile
- ■Volume is supportive of the price action.
- ■Wait for volume expansion on breakout.
Key Levels
No zones specified
No zones specified
Invalidation Scenario
A weekly close below the support level invalidates this structure.
SDBL
bearish fnoDouble Bottom Breakout
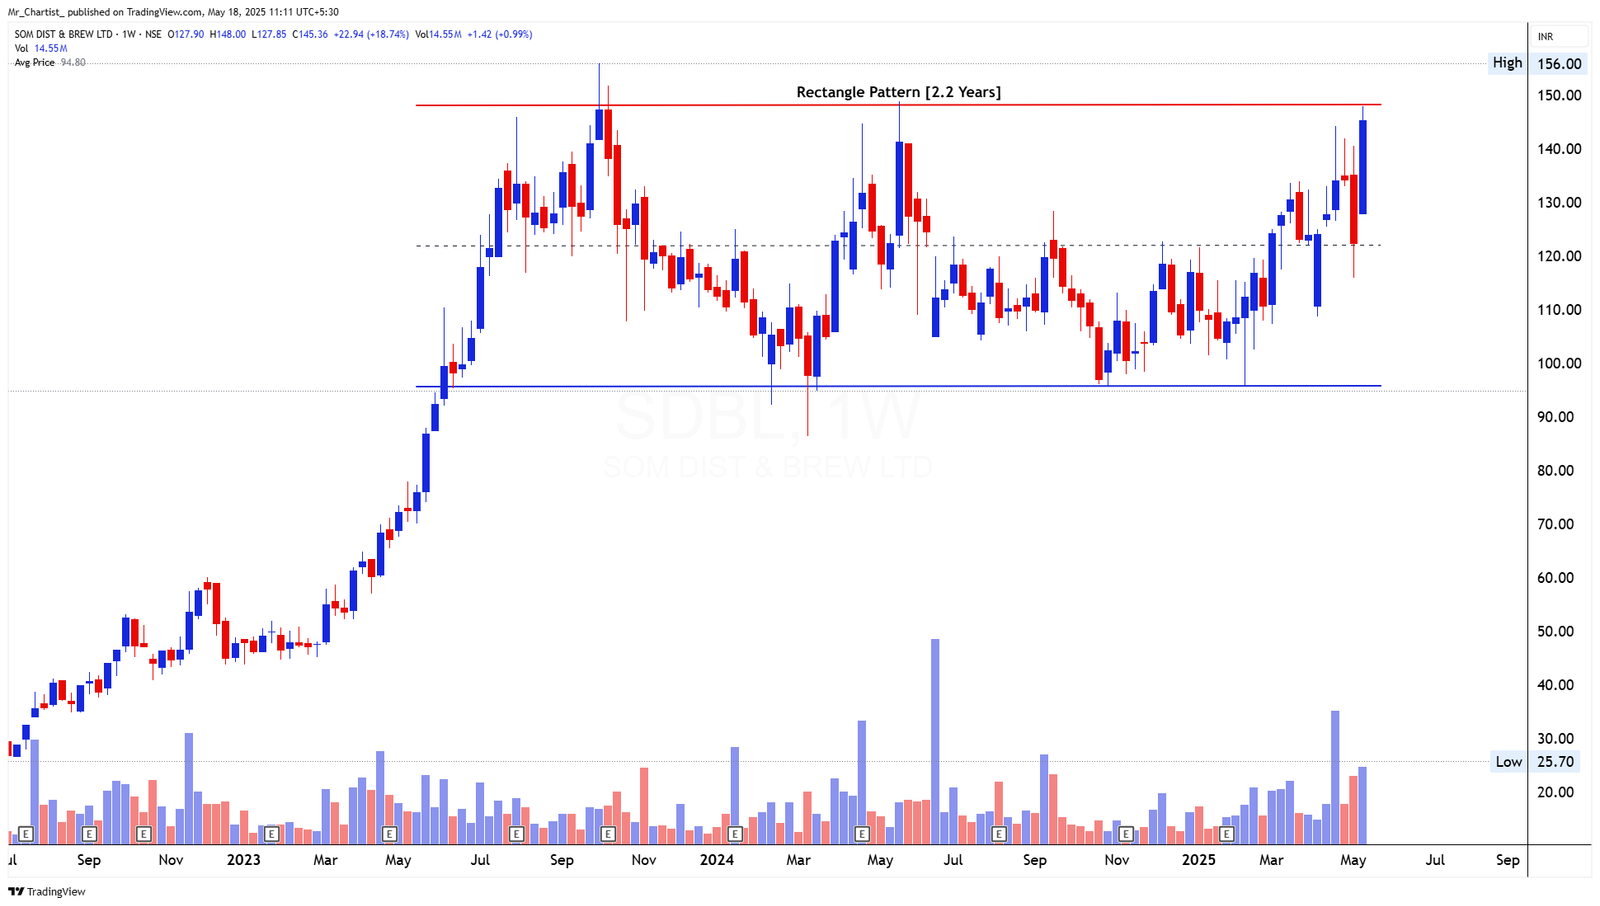
Rectangle Pattern [2.2 Years]
Thesis & Analysis
Price Action Overview: SDBL is testing the upper resistance of a broad rectangle range that has held firm since early 2023. The recent breakout attempt has come with a strong bullish candle, pushing the price toward the ₹150 zone — the highest in over two years. Candlestick Behavior: This week’s candle is wide-bodied and bullish, nearly touching the upper boundary of the rectangle. The structure reflects a strong move from the base, suggesting increased conviction among buyers. Volume Analysis: There’s a visible volume increase over the last few weeks, supporting the upward breakout attempt and indicating renewed institutional interest near the top of the range. 2. Crucial Support and Resistance Levels Support Levels: ₹130–₹125: Recent breakout zone and prior congestion ₹100: Rectangle base support ₹92: Historical range bottom and previous reaction low Resistance Levels: ₹150–₹156: Rectangle resistance zone, tested multiple times ₹175: Potential extension if breakout sustains ₹200+: Round number and psychological milestone 3. Strategic Trade Scenarios Primary Setup (Bullish Breakout Watch): A decisive breakout above ₹150–₹156 could trigger a fresh rally, with the rectangle height projecting upside toward ₹175+. Sustained price action and volume above ₹156 would validate this view. Trigger: Close above ₹156 with strong volume Target Zones: ₹175, ₹200+ Alternative Scenario (Rejection Risk): If price fails to hold above ₹150, it may face resistance-driven pullback toward ₹125–₹130. Structure remains intact unless the lower end at ₹100 is breached. Failure Trigger: Drop below ₹125 Downside Risk: ₹100 retest possible if reversal intensifies
Price Action
- ■Price action is structurally positive.
- ■Forming higher highs and higher lows.
Volume Profile
- ■Volume is supportive of the price action.
- ■Wait for volume expansion on breakout.
Key Levels
No zones specified
No zones specified
Invalidation Scenario
A weekly close below the support level invalidates this structure.
PREMEXPLN
bearish fnoDouble Bottom Breakout
Daily Chart
Thesis & Analysis
No detailed thesis provided for this setup.
Price Action
- ■Price action is structurally positive.
- ■Forming higher highs and higher lows.
Volume Profile
- ■Volume is supportive of the price action.
- ■Wait for volume expansion on breakout.
Key Levels
No zones specified
No zones specified
Invalidation Scenario
A weekly close below the support level invalidates this structure.
PREMEXPLN
bearish fnoDouble Bottom Breakout
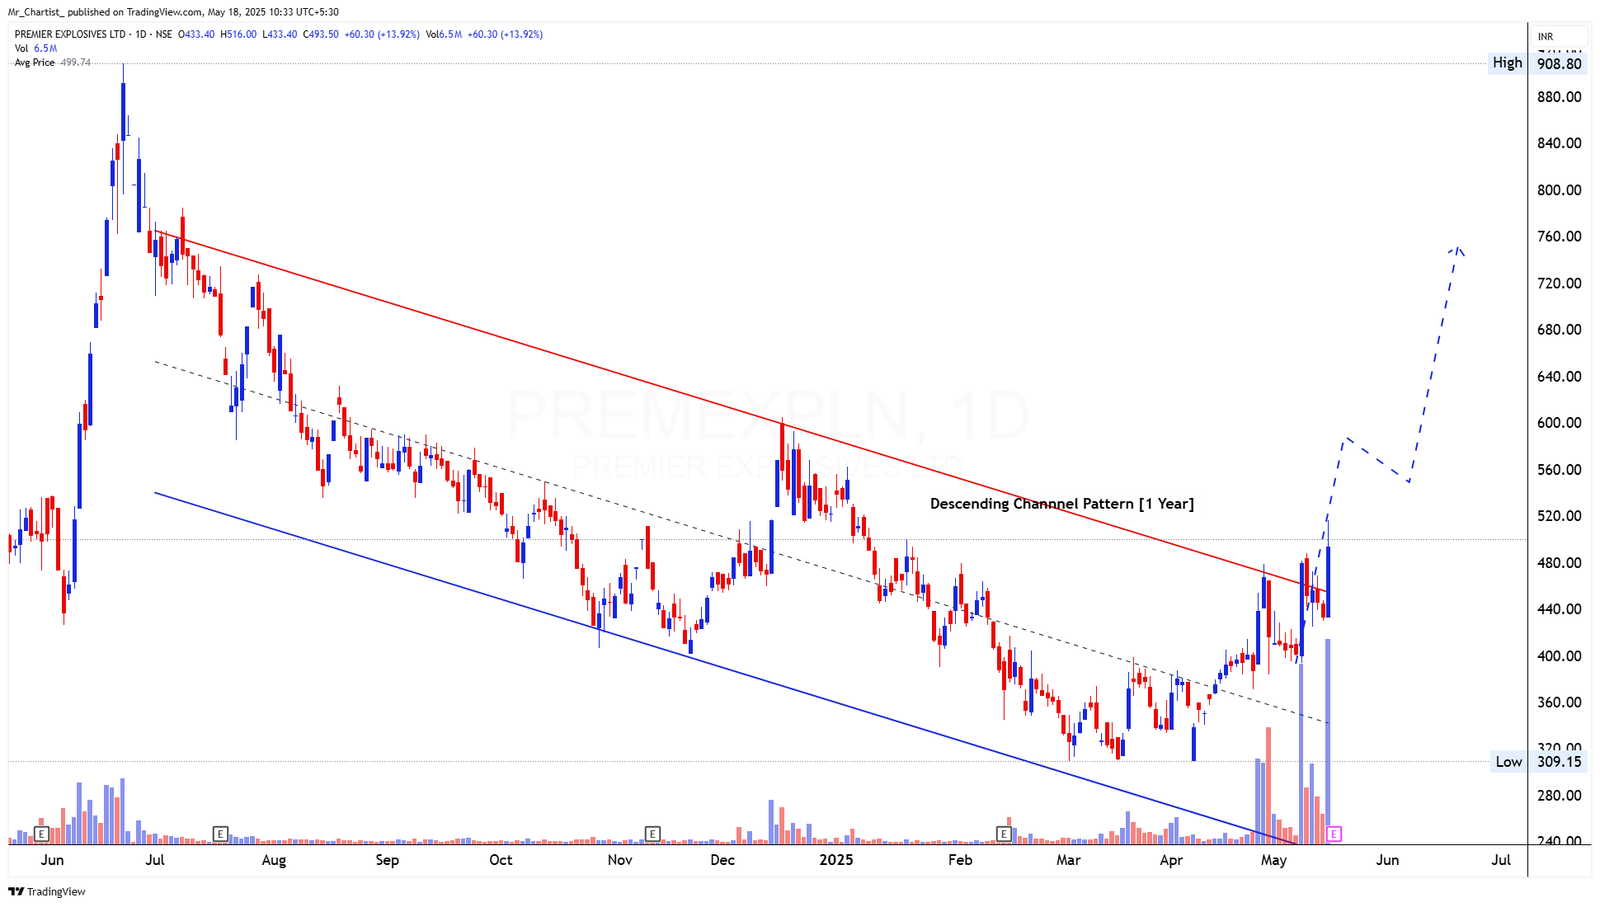
Descending Channel Pattern [1 Year]
Thesis & Analysis
Price Action Overview: Premier Explosives has shown a powerful breakout from a 1-year Descending Channel pattern. After grinding lower within parallel trendlines for months, the recent sessions have delivered a strong move past the upper channel resistance. Candlestick Behavior: The breakout is defined by a tall bullish candle with a strong close above the trendline. Follow-through action and rising lows over the past few weeks further confirm a change in trend. Volume Analysis: A sharp rise in volume accompanied the breakout, marking clear institutional interest. The surge validates the breakout strength and hints at a potential trend reversal. 2. Crucial Support and Resistance Levels Support Levels: ₹460: Immediate breakout zone, now acting as near-term support ₹400: Previous resistance-turned-base from consolidation ₹330: Channel support and swing low Resistance Levels: ₹550: Interim target as per channel height projection ₹620: Pre-breakdown supply zone ₹750: Medium-term potential extension if momentum sustains 3. Strategic Trade Scenarios Primary Setup (Bullish Breakout Continuation): Sustained strength above ₹460–₹480 confirms breakout from the year-long channel, projecting an upward move toward ₹550–₹620. This aligns with the pattern height added to the breakout zone. Trigger: Holding above ₹480 on strong volume Target Zones: ₹550 (initial), ₹620–₹750 (extended) Alternative Scenario (Reversal or Retest): A drop below ₹460 could indicate a false breakout, leading to a pullback toward ₹400–₹420. Structure remains valid unless it breaks below the channel midline. Failure Trigger: Close below ₹460 with volume drop Downside Risk: ₹400–₹330 retest possible on failed follow-through
Price Action
- ■Price action is structurally positive.
- ■Forming higher highs and higher lows.
Volume Profile
- ■Volume is supportive of the price action.
- ■Wait for volume expansion on breakout.
Key Levels
No zones specified
No zones specified
Invalidation Scenario
A weekly close below the support level invalidates this structure.
IFCI
bearish fnoDouble Bottom Breakout
Daily Chart
Thesis & Analysis
No detailed thesis provided for this setup.
Price Action
- ■Price action is structurally positive.
- ■Forming higher highs and higher lows.
Volume Profile
- ■Volume is supportive of the price action.
- ■Wait for volume expansion on breakout.
Key Levels
No zones specified
No zones specified
Invalidation Scenario
A weekly close below the support level invalidates this structure.
IFCI
bearish fnoDouble Bottom Breakout
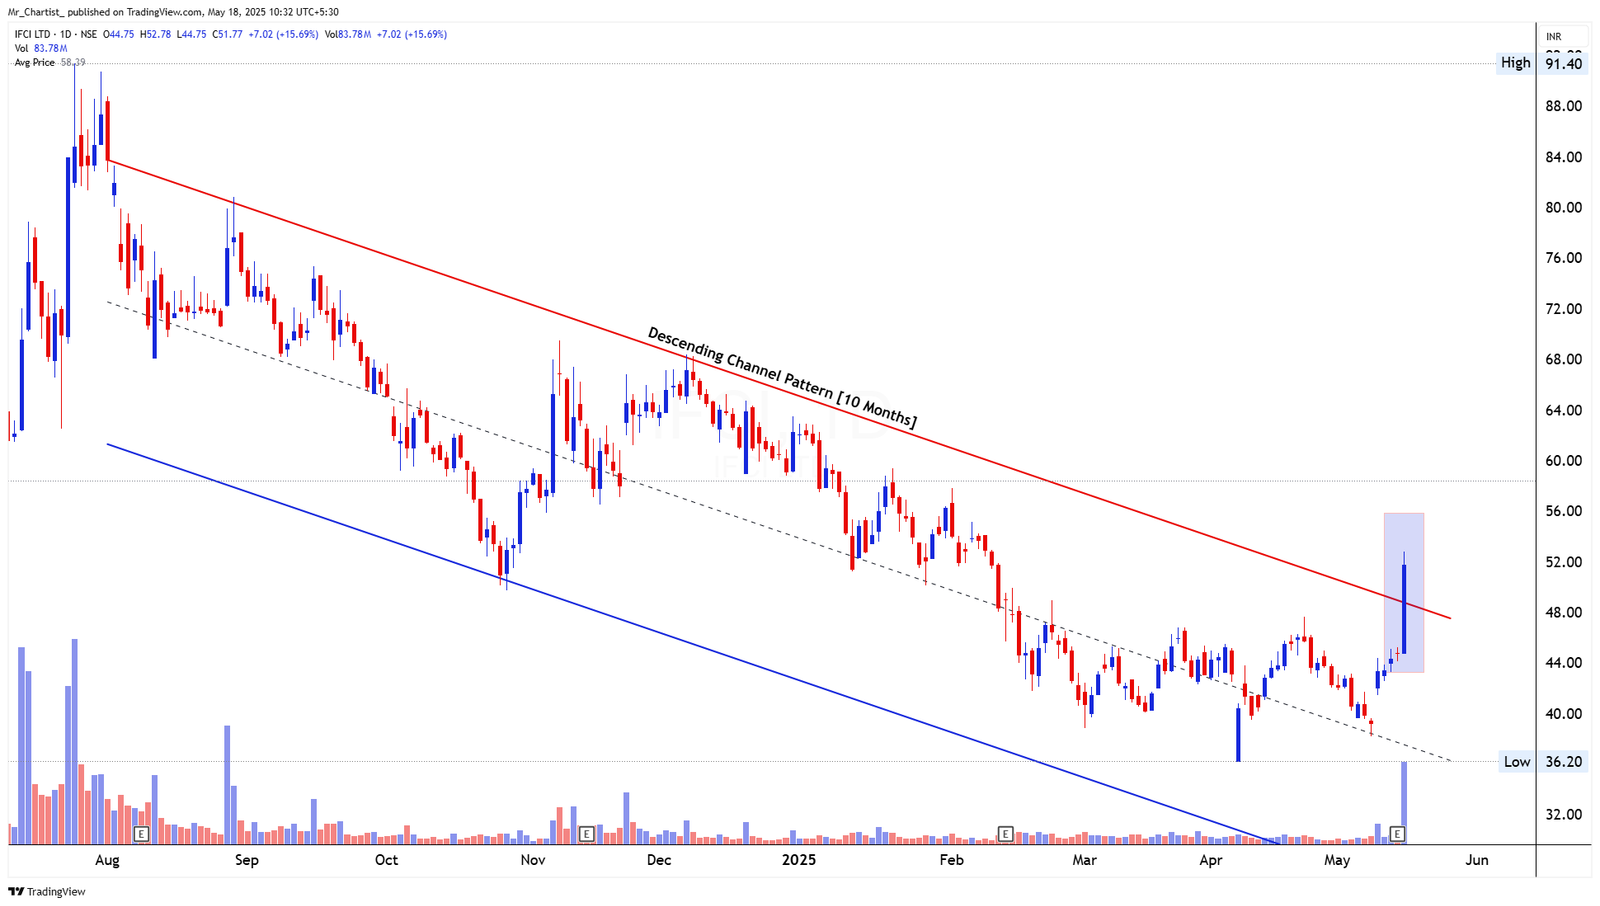
Descending Channel Pattern [10 Months]
Thesis & Analysis
Price Action Overview: IFCI has broken out of a 10-month-long Descending Channel, marking a significant shift from its prolonged downtrend. Price action had been respecting the upper and lower channel lines consistently, but a strong bullish candle has now cleared the upper boundary. Candlestick Behavior: The breakout candle is large and impulsive, with a wide real body and strong close near the day’s high — signaling momentum strength. It also marks the highest close since the pattern began forming. Volume Analysis: A massive surge in volume supports the breakout, making it more credible. The move suggests aggressive accumulation and marks a potential trend reversal setup. 2. Crucial Support and Resistance Levels Support Levels: ₹48: Immediate breakout level ₹44: Swing pivot inside the channel ₹40: Lower base from prior consolidation Resistance Levels: ₹58: Minor horizontal hurdle from past structure ₹65: Pre-fall congestion area ₹72: Measured move projection zone 3. Strategic Trade Scenarios Primary Setup (Bullish Breakout): The breakout above ₹48 signals a trend reversal. Holding above this zone could take the stock toward ₹58–₹65, as per the channel depth and previous reaction highs. Trigger: Sustained action above ₹48–₹50 with steady volume Target Zones: ₹58 (initial), ₹65–₹72 (extended) Alternative Scenario (Retest or Failure): If the price falls back below ₹48, it may retest the channel breakout zone around ₹44. Breakdown below ₹44 would negate the setup. Failure Trigger: Close below ₹44 with weak recovery Risk Zone: ₹40–₹44 retest likely in case of failed breakout
Price Action
- ■Price action is structurally positive.
- ■Forming higher highs and higher lows.
Volume Profile
- ■Volume is supportive of the price action.
- ■Wait for volume expansion on breakout.
Key Levels
No zones specified
No zones specified
Invalidation Scenario
A weekly close below the support level invalidates this structure.
HCL INSYS
bearish fnoDouble Bottom Breakout
Daily Chart
Thesis & Analysis
No detailed thesis provided for this setup.
Price Action
- ■Price action is structurally positive.
- ■Forming higher highs and higher lows.
Volume Profile
- ■Volume is supportive of the price action.
- ■Wait for volume expansion on breakout.
Key Levels
No zones specified
No zones specified
Invalidation Scenario
A weekly close below the support level invalidates this structure.
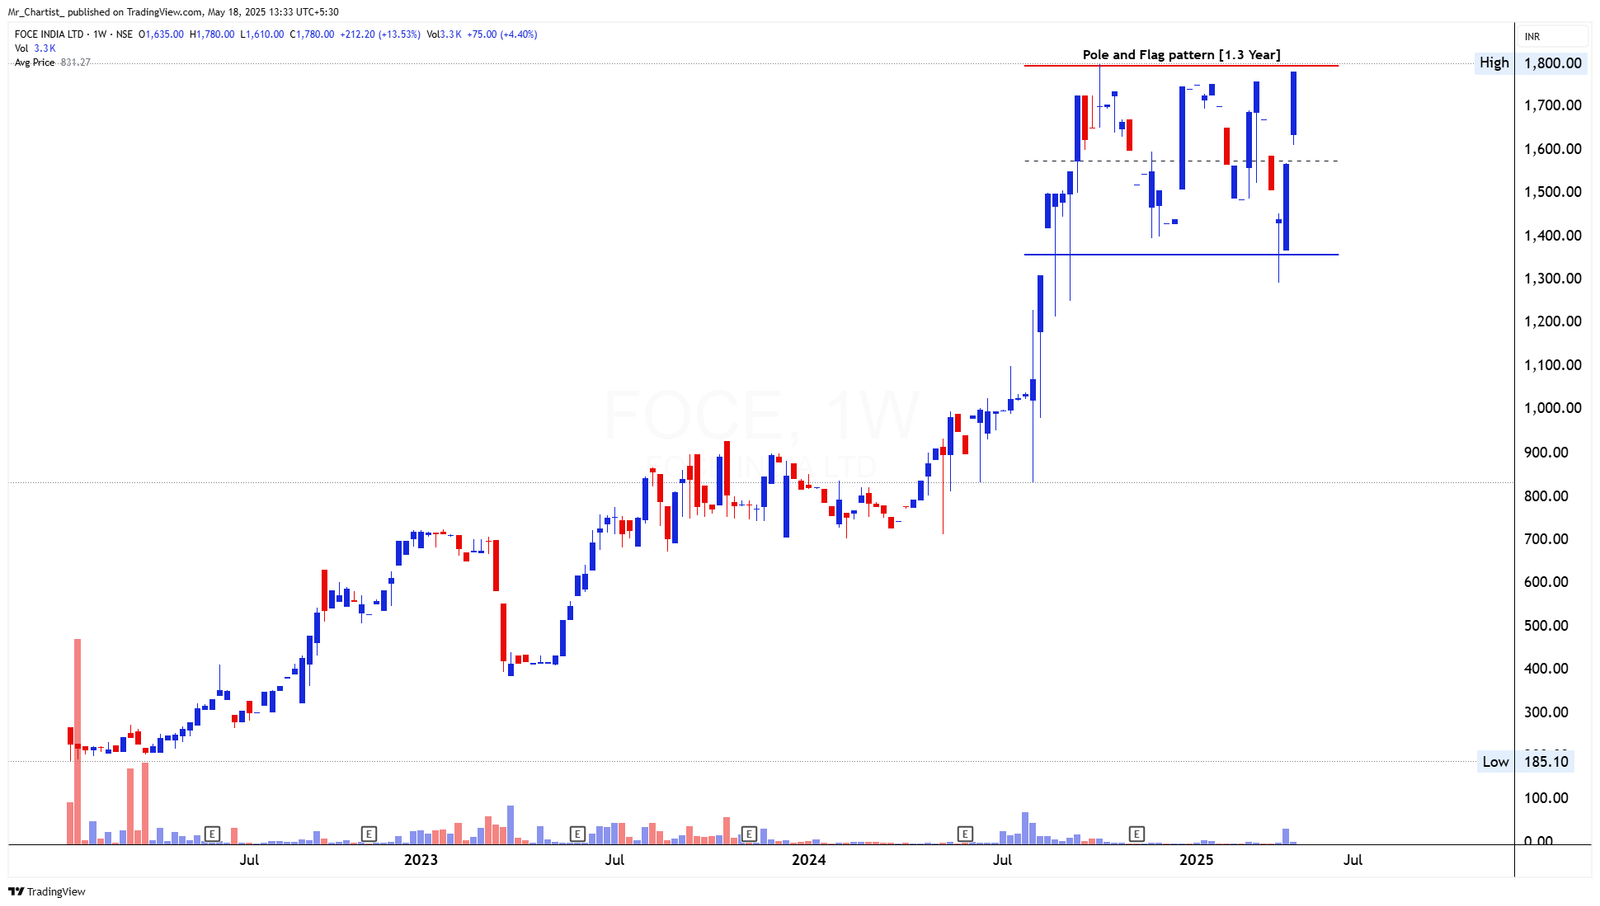
KIOCL
bearish fnoDouble Bottom Breakout
Cup and Handle + Long-Term
Thesis & Analysis
Diagonal Support [4 Months + 3 Years] Price Action Overview: KIOCL has formed a clear Cup and Handle structure on the daily timeframe, aligning with a consolidation at a major diagonal support zone on the weekly chart. The pattern base near ₹285 is now acting as neckline resistance. Price is attempting to retest this level after rounding from the lows, indicating renewed interest. Candlestick Behavior: Recent sessions show small-bodied candles with long wicks near resistance, suggesting supply absorption. A decisive bullish candle is awaited to confirm breakout strength. Volume Analysis: Spikes in volume on upward candles over the past week suggest accumulation. Sustained volume above ₹285 would add conviction to the breakout setup. 2. Crucial Support and Resistance Levels Support Levels: ₹240–₹250: Weekly trendline support holding since 2021 ₹210: Recent swing low and consolidation base Resistance Levels: ₹285: Cup and Handle neckline and short-term resistance ₹330–₹350: Measured target post-breakout 3. Strategic Trade Scenarios Primary Setup (Bullish Breakout Anticipation): If price sustains above ₹285 with a strong candle and increasing volume, the Cup and Handle breakout may trigger, aiming for ₹330+ targets. Alternative Scenario (Pullback Risk): Failure to break above ₹285 may lead to a pullback toward ₹250–₹240 support before a potential second breakout attempt.
Price Action
- ■Price action is structurally positive.
- ■Forming higher highs and higher lows.
Volume Profile
- ■Volume is supportive of the price action.
- ■Wait for volume expansion on breakout.
Key Levels
No zones specified
No zones specified
Invalidation Scenario
A weekly close below the support level invalidates this structure.
Charts to Watch
Setups forming favorable structures
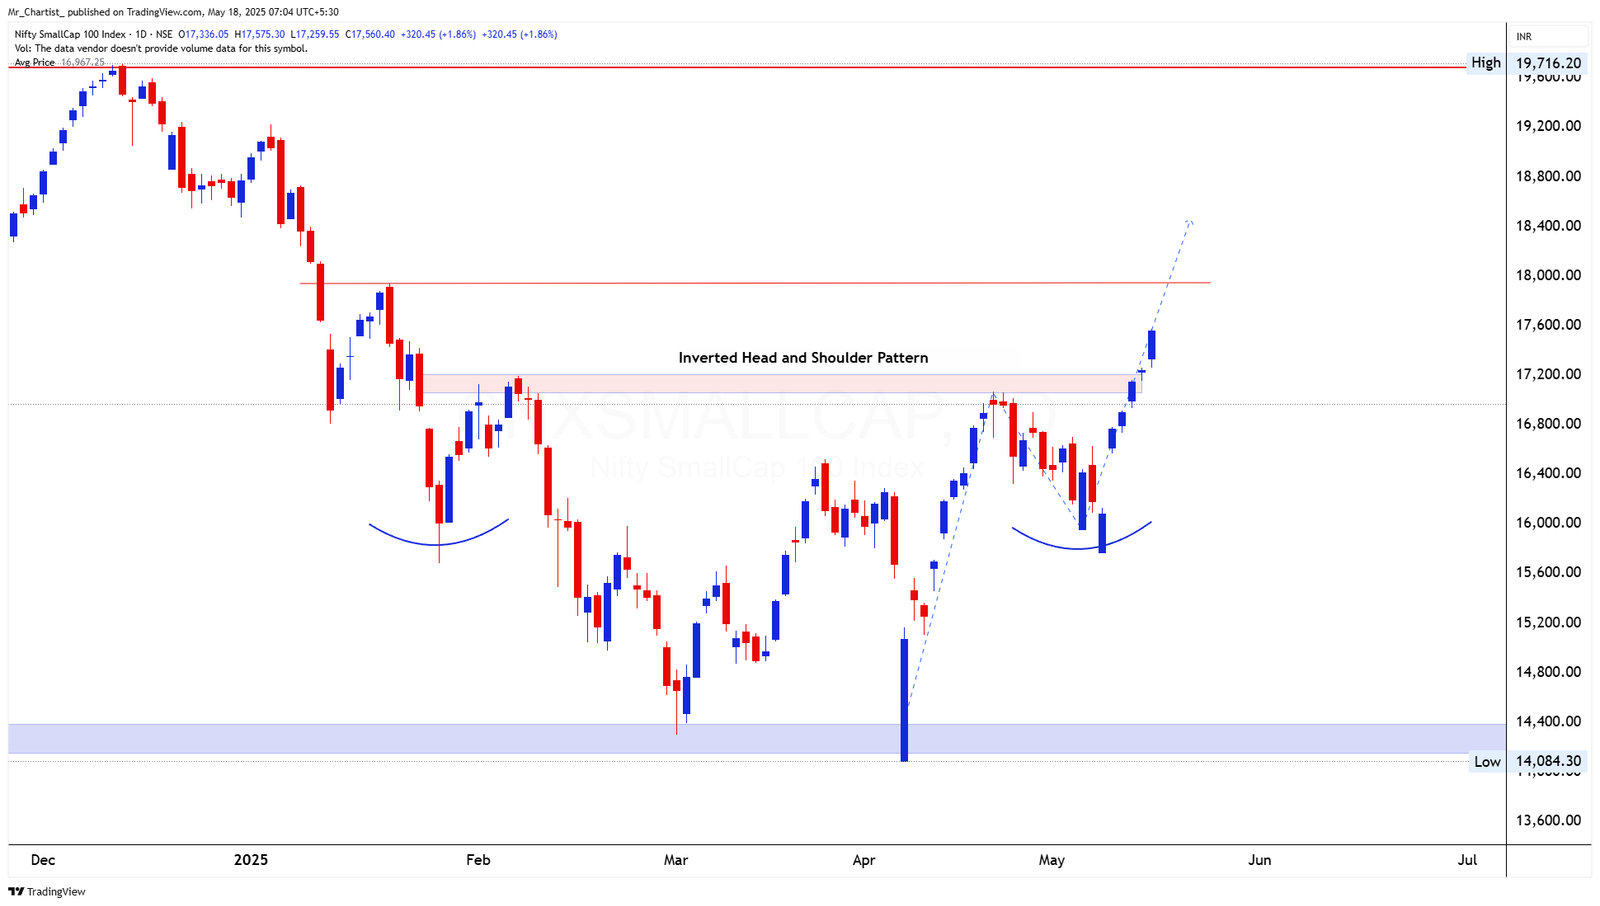
NIFTY 50 INDEX
charts to-watchRecent candles are showing strong bullish bodies with narrow wicks, suggesting sustained
Horizontal Resistance Zone [7 Months]
Thesis & Analysis
Price Action Overview: The Nifty 50 index has been gradually trending higher and is now approaching a major horizontal resistance at the 25,250 level, which has remained untouched for the past seven months. The recent rally from the 23,750 breakout level has been strong and well- structured, supported by bullish price action and short consolidations along the way. The price is now attempting to breach the resistance zone after forming a short flag breakout. If the index breaks and sustains above 25,250, it will confirm a fresh breakout, potentially opening the path to 26,000–26,277 in the near term. Candlestick Pattern: Recent candles are showing strong bullish bodies with narrow wicks, suggesting sustained buying interest. No clear signs of bearish reversal patterns yet, although hesitation near the resistance line may emerge if momentum stalls. Volume Analysis: Volume has consistently increased during the upward leg, supporting the strength of the move. A minor tapering in volume was observed during the recent sideways movement, typical before a potential breakout. 2. Crucial Support and Resistance Levels Support Levels: 24,750: Recent minor consolidation level; short-term swing support. 24,400: Prior breakout zone; likely to act as a strong support on any pullback. 23,750: Base level of the last breakout, key for maintaining the bullish structure. Resistance Levels: 25,250: Critical horizontal resistance; a breakout above this confirms bullish continuation. 26,000–26,277: Potential target zone post-breakout; includes previous all-time high. 3. Strategic Trade Scenarios Bullish Scenario: If the index crosses and sustains above 25,250 with a strong daily close and rising volume, it could mark the beginning of a new rally. In that case, the upside targets are placed around 26,000 to 26,277. The current structure, supported by the 24,750 swing low, reinforces this outlook. Bearish Scenario: If Nifty fails to breach 25,250 and instead reverses from this horizontal resistance, we may see a pullback. A drop below 25,000 would raise caution, potentially dragging the index back to 24,400 or even 23,750. A sharp bearish candle or drop in volume near resistance would support this case.
Price Action
- ■Price action is structurally positive.
- ■Forming higher highs and higher lows.
Volume Profile
- ■Volume is supportive of the price action.
- ■Wait for volume expansion on breakout.
Key Levels
No zones specified
No zones specified
Invalidation Scenario
A weekly close below the support level invalidates this structure.

NIFTY SMALLCAP 100 INDEX
charts to-watchRecent candles show strong bullish momentum, with wide-range green
Inverted Head and Shoulders [5
Thesis & Analysis
Months] Price Action Overview: The Nifty SmallCap 100 has formed a classic Inverted Head and Shoulders pattern over the past five months, a bullish reversal formation. The index recently broke out above the neckline resistance near 17,200, signaling a potential trend reversal from the previous downtrend. The breakout was clean, with follow-through buying observed in the last few sessions. The move suggests a shift in sentiment and a strong probability of continued upside if the pattern plays out fully. Candlestick Pattern: Recent candles show strong bullish momentum, with wide-range green bodies confirming strength. No reversal signals are currently visible.. 2. Crucial Support and Resistance Levels Support Levels: 17,200: Breakout neckline; now acting as immediate support. 16,500: Mid-shoulder region; potential secondary support. 14,000–14,100: Major long-term support zone, the bottom of the entire formation. Resistance Levels: 18,100–18,400: Next visible supply zone from prior swing highs. 19,716: All-time high; final target if the breakout extends fully. 3. Strategic Trade Scenarios Bullish Scenario: If price sustains above 17,200, the breakout remains valid and upside projections toward 18,400, and possibly 19,700, stay active. This scenario aligns with the classic breakout projection of an inverted head and shoulders pattern. Bearish Scenario: If the index falls back below 17,200 and sustains below the neckline, the breakout could fail. This may lead to a retest of the 16,500 zone, and further weakness could bring the index back toward 14,000–14,100, invalidating the bullish structure.
Price Action
- ■Price action is structurally positive.
- ■Forming higher highs and higher lows.
Volume Profile
- ■Volume is supportive of the price action.
- ■Wait for volume expansion on breakout.
Key Levels
No zones specified
No zones specified
Invalidation Scenario
A weekly close below the support level invalidates this structure.
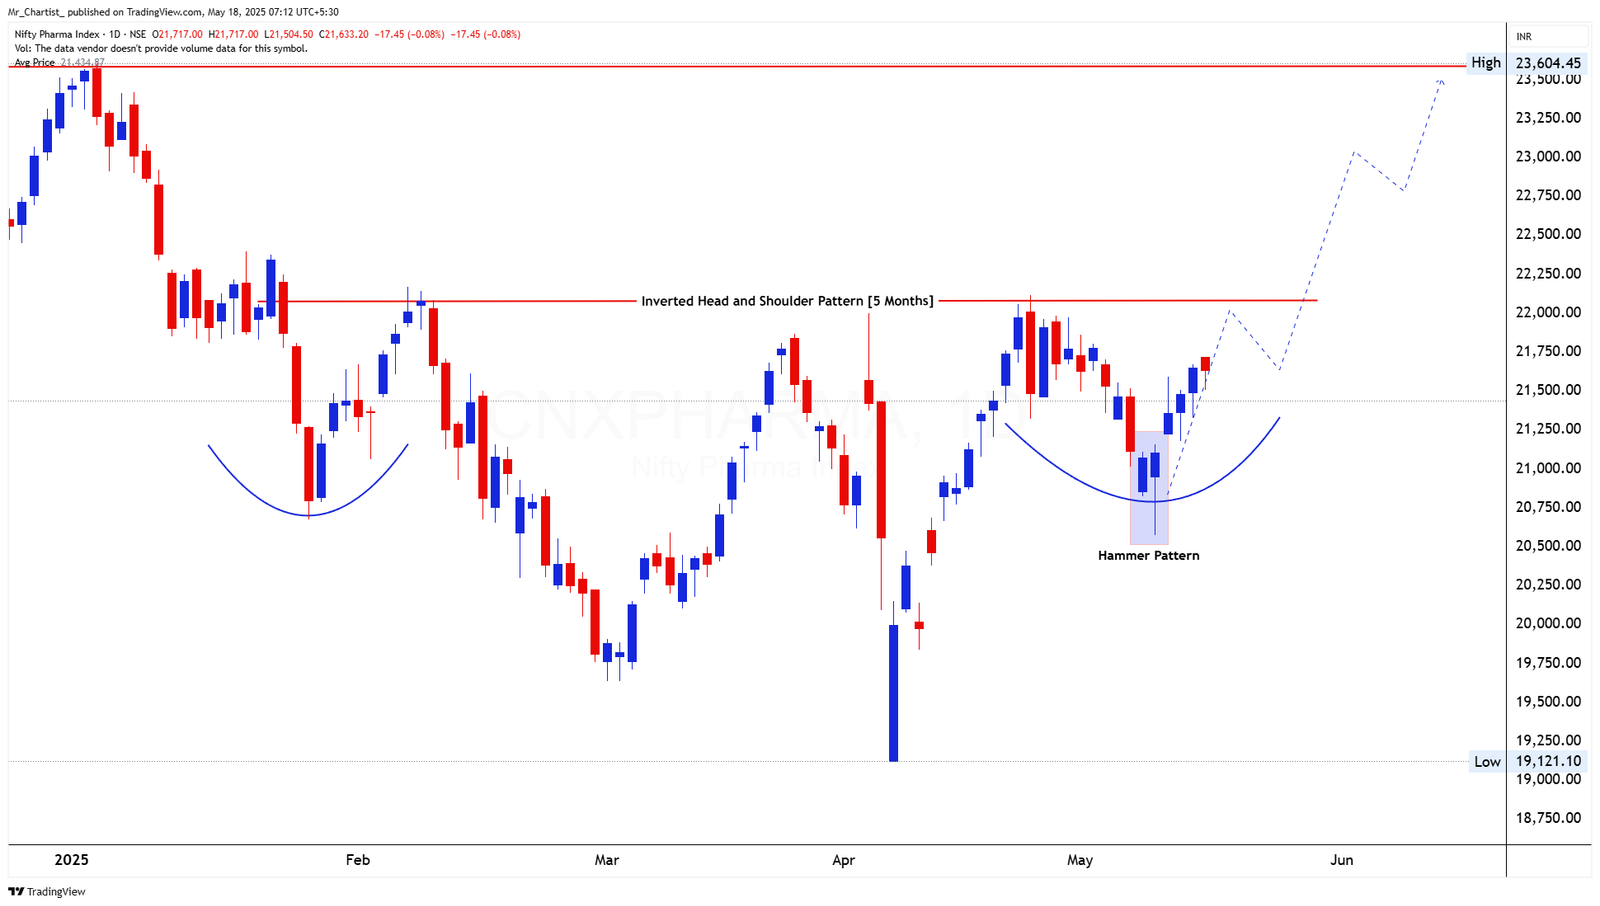
NIFTY REALTY INDEX
charts to-watchBullish momentum is confirmed by a series of wide-bodied green candles. There
Cup and Handle Pattern [3 Months]
Thesis & Analysis
Price Action Overview: The Nifty Realty Index has developed a Cup and Handle formation over the past three months, signaling a medium-term bullish setup. The rounded cup base and subsequent handle consolidation occurred just above the long-standing support zone of 810–770, which has held for over 1.5 years, as seen in the broader timeframe. The index has now broken above the handle resistance near 900, suggesting the beginning of a potential new uptrend. The current move is sharp and impulsive, aligning well with the typical breakout behavior from this pattern. Candlestick Pattern: Bullish momentum is confirmed by a series of wide-bodied green candles. There are no signs of hesitation or reversal yet, reinforcing the strength of the breakout from the handle region. 2. Crucial Support and Resistance Levels Support Levels: 900: Handle breakout zone; now acting as immediate support. 860: Handle base; intermediate support level. 810–770: Major multi-month support zone; historically a strong demand area. Resistance Levels: 1,060: Next visible resistance zone; aligns with the upper target of the pattern breakout. 1,137–1,157: All-time high zone; major psychological and structural resistance. 3. Strategic Trade Scenarios Bullish Scenario: If the index sustains above 900, the breakout remains valid, and the rally could extend toward 1,060 in the short term. If momentum holds, it may even challenge the previous highs between 1,137 and 1,157. A retest of the 900 zone followed by a bounce would offer further confirmation. Bearish Scenario: If Realty Index falls back below 900 and fails to hold that level, the pattern could turn vulnerable. In that case, the price may slide to 860, and a deeper correction could drag it back to the 810–770 support band, nullifying the breakout structure.
Price Action
- ■Price action is structurally positive.
- ■Forming higher highs and higher lows.
Volume Profile
- ■Volume is supportive of the price action.
- ■Wait for volume expansion on breakout.
Key Levels
No zones specified
No zones specified
Invalidation Scenario
A weekly close below the support level invalidates this structure.
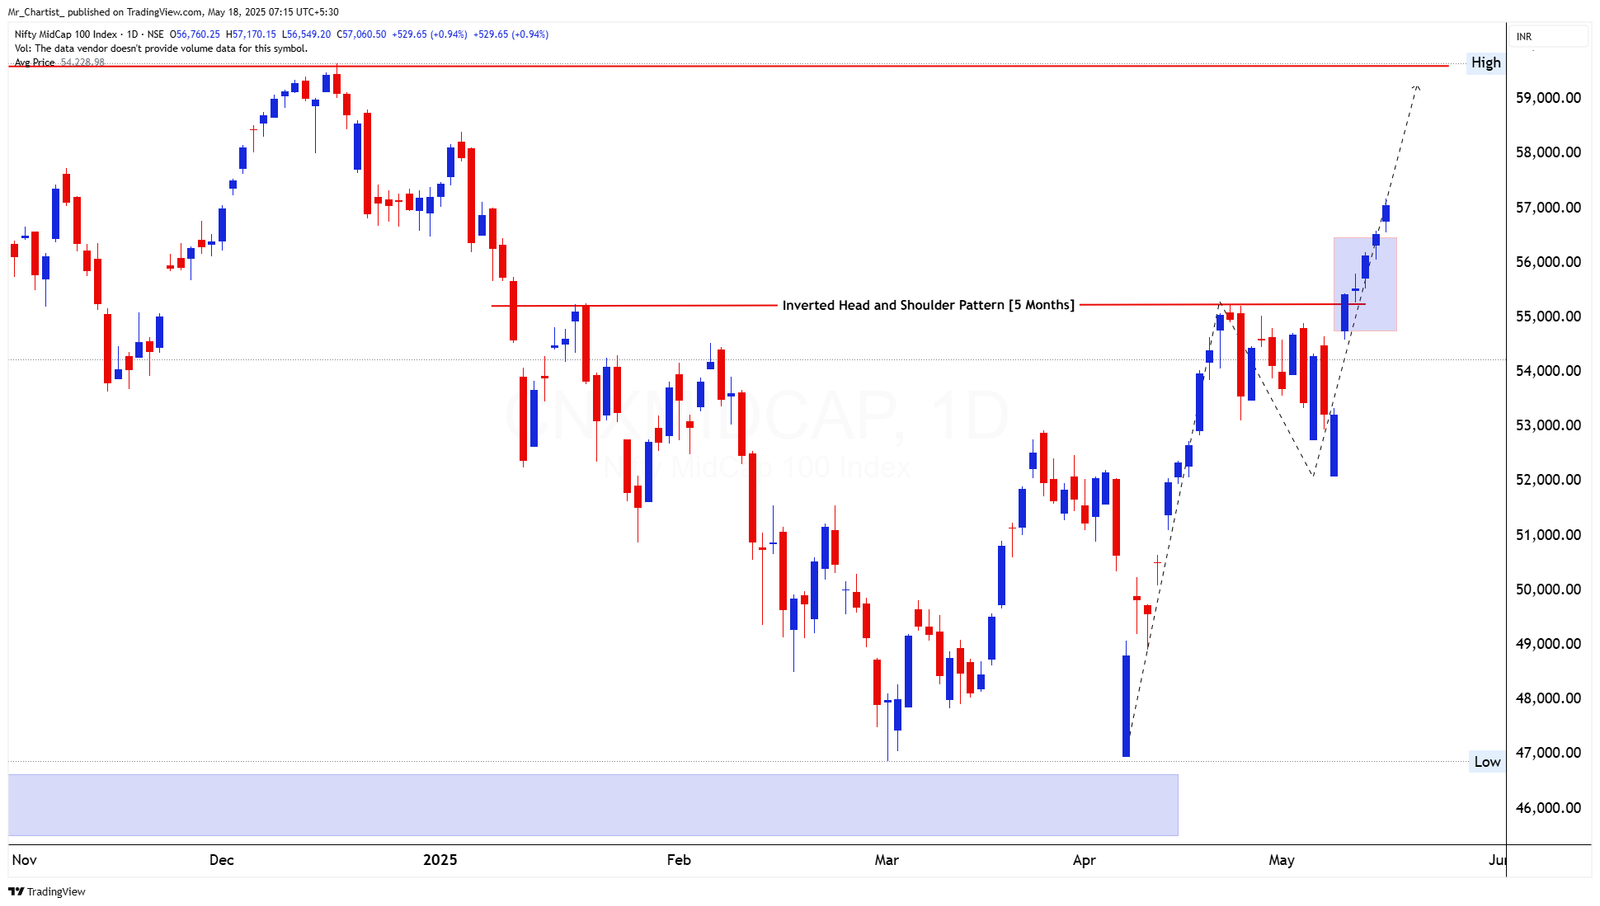
NIFTY PHARMA INDEX
charts to-watchThe appearance of a hammer candle at the recent swing low acted as a
Inverted Head and Shoulders [5
Thesis & Analysis
Months] Price Action Overview: The Nifty Pharma Index is currently completing an Inverted Head and Shoulders pattern, forming over the last five months. This classical reversal pattern hints at a potential bullish trend shift. The pattern is well-structured with symmetrical shoulders and a rounded head. A hammer candle recently formed at the right shoulder's base around 20,750, which initiated a sharp upward rally. The price is now heading toward the neckline resistance at 22,250, a crucial breakout level. Candlestick Pattern: The appearance of a hammer candle at the recent swing low acted as a powerful reversal trigger. Follow-up bullish candles have added strength, but confirmation will come only if the neckline is decisively breached. 2. Crucial Support and Resistance Levels Support Levels: 21,250: Recent rally base and the neckline's pre-breakout zone. 20,750: Hammer candle support level. 19,120: Long-term base and low of the pattern; major support zone. Resistance Levels: 22,250: Neckline of the inverted H&S pattern; key breakout level. 23,600: All-time high and major long-term resistance. 3. Strategic Trade Scenarios Bullish Scenario: If Pharma Index breaks and sustains above 22,250, the inverted head and shoulders breakout will be confirmed. This could open the upside toward 23,000 initially, with potential to retest 23,600, the index's all-time high. Bearish Scenario: If the index fails to cross 22,250 and shows reversal signs, it may dip back toward 21,250 or 20,750. A drop below 20,750 would weaken the structure and threaten the pattern's validity, especially if selling accelerates.
Price Action
- ■Price action is structurally positive.
- ■Forming higher highs and higher lows.
Volume Profile
- ■Volume is supportive of the price action.
- ■Wait for volume expansion on breakout.
Key Levels
No zones specified
No zones specified
Invalidation Scenario
A weekly close below the support level invalidates this structure.
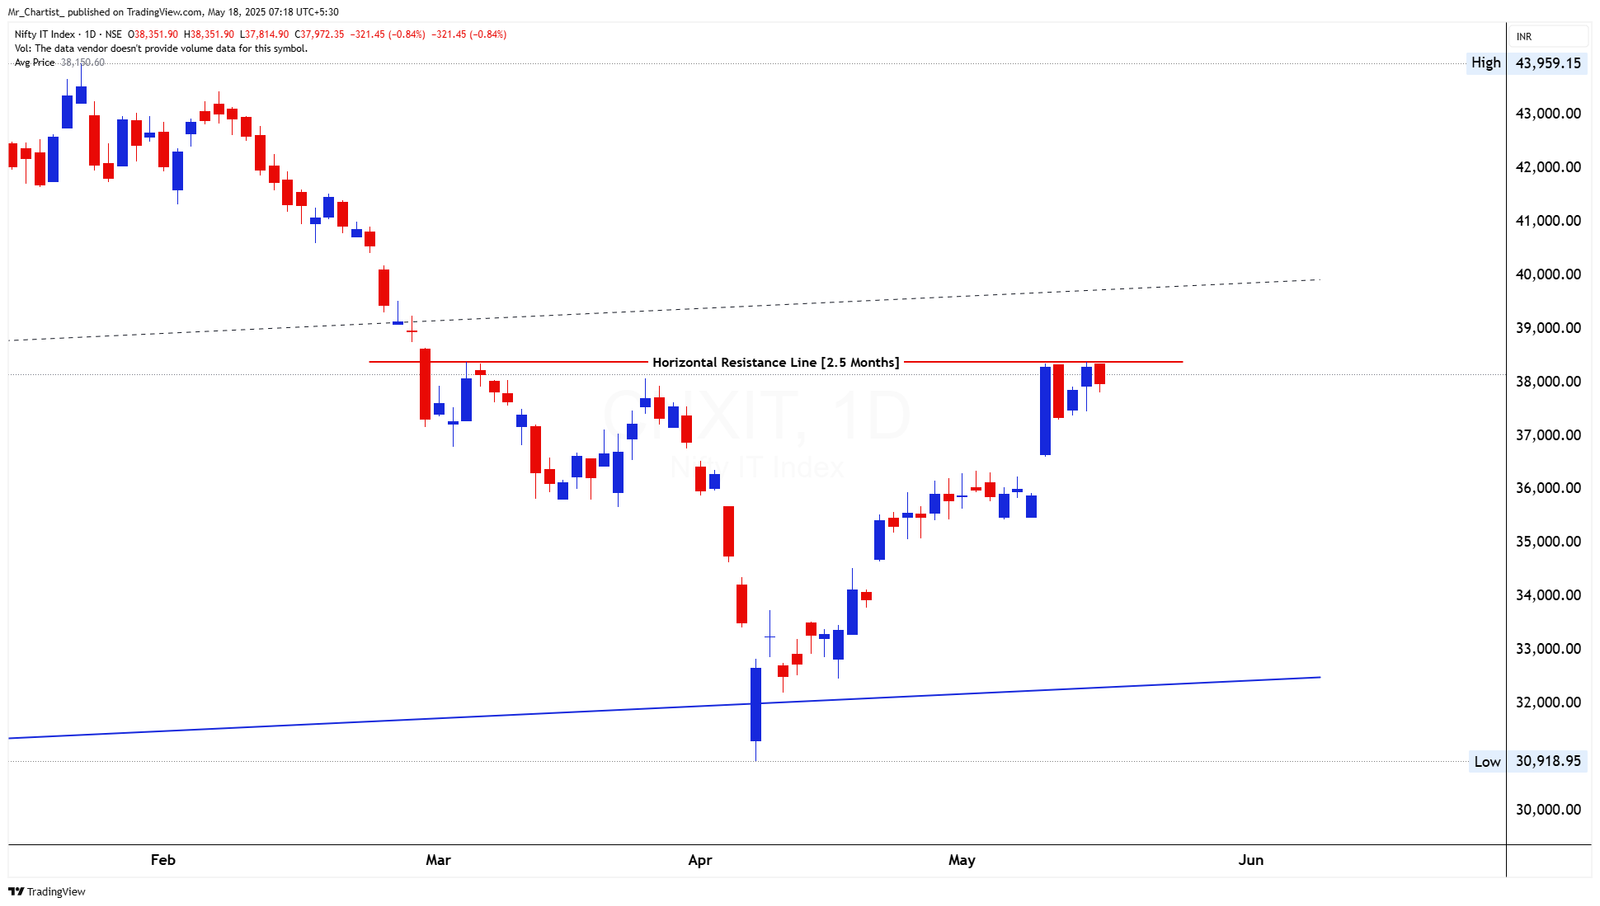
NIFTY MIDCAP 100 INDEX
charts to-watchStrong bullish candles confirm breakout momentum. Recent candles show
Inverted Head and Shoulders [5 Months]
Thesis & Analysis
Price Action Overview: The Nifty MidCap 100 has recently broken out of a 5-month Inverted Head and Shoulders pattern, marking a significant trend reversal setup. The neckline was placed near 55,000, which was convincingly breached. Following the breakout, a brief consolidation (flag formation) developed and has now resolved on the upside, supporting the bullish continuation. The index has surged strongly post-breakout, reaching new intermediate highs. The structure remains healthy with a sequence of higher highs and higher lows forming since the April low near 48,000. Candlestick Pattern: Strong bullish candles confirm breakout momentum. Recent candles show consistent upward pressure without major rejection wicks, indicating strong buyer control. 2. Crucial Support and Resistance Levels Support Levels: 55,000: Neckline and breakout support zone. 54,000–53,500: Consolidation base and breakout retest zone. 48,000: Structural low; origin of the recent bullish leg. Resistance Levels: 57,500: Short-term reaction high. 59,000+: Potential measured move target derived from the height of the inverted H&S pattern. 3. Strategic Trade Scenarios Bullish Scenario: If the index sustains above 55,000, the breakout remains strong, and we may see an extension toward 57,500 and possibly 59,000+. Follow-through price action above 57,000 would signal fresh momentum. Bearish Scenario: If price falls back below 55,000, a pullback could deepen toward 54,000– 53,500. Any breakdown below this zone would weaken the structure and raise caution for short-term longs.
Price Action
- ■Price action is structurally positive.
- ■Forming higher highs and higher lows.
Volume Profile
- ■Volume is supportive of the price action.
- ■Wait for volume expansion on breakout.
Key Levels
No zones specified
No zones specified
Invalidation Scenario
A weekly close below the support level invalidates this structure.
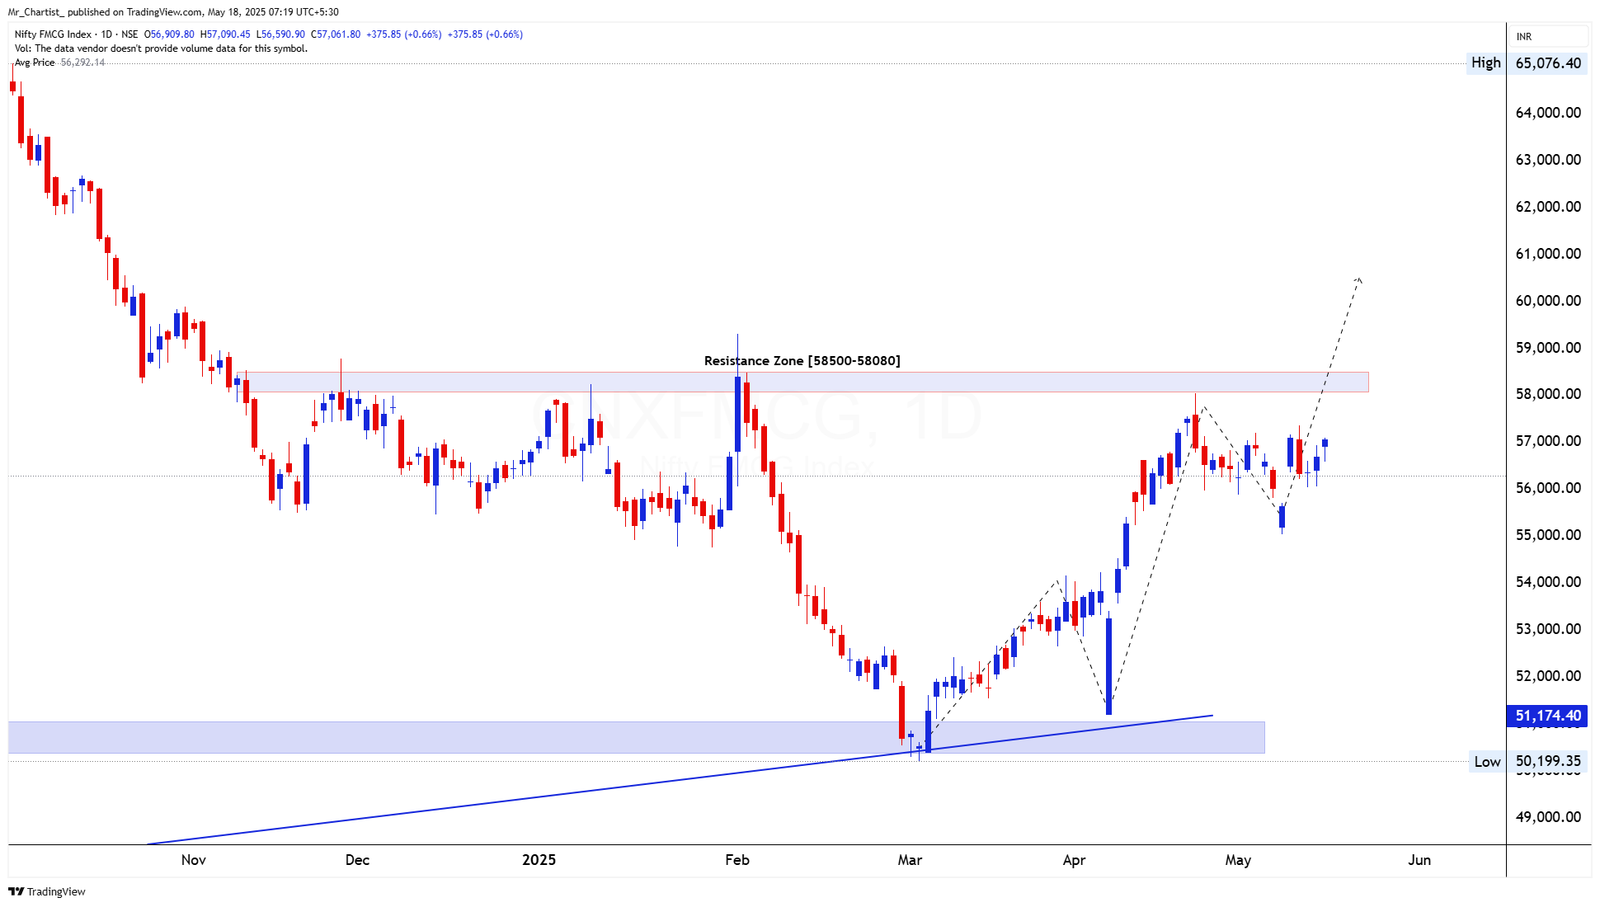
NIFTY IT INDEX
charts to-watchNo strong reversal patterns are evident yet, but repeated upper wicks suggest
Horizontal Resistance Line [2.5 Months]
Thesis & Analysis
Price Action Overview: The Nifty IT Index is currently testing a horizontal resistance zone around 38,000–38,350 that has remained unbroken for the past 2.5 months. After a sharp recovery from the April lows near 31,000, the index has entered a consolidation just below this resistance. The recent price action shows tightening candles with reduced range, indicating indecision at a key level. While the overall trend from the lows remains bullish, this resistance is acting as a critical barrier for further upside. Candlestick Pattern: No strong reversal patterns are evident yet, but repeated upper wicks suggest supply pressure near the resistance. A breakout or a bearish rejection will define the next leg. 2. Crucial Support and Resistance Levels Support Levels: 37,000–36,800: Minor swing low and consolidation area. 35,500: Structure low before the last impulse. 30,900: Major swing bottom and trend origin; long-term support. Resistance Levels: 38,350: Horizontal resistance tested multiple times; a key breakout zone. 40,000+: Psychological level and potential breakout extension target. 43,959: Previous all-time high and long-term resistance. 3. Strategic Trade Scenarios Bullish Scenario: If the index breaks and closes above 38,350 with strong follow-through, a fresh uptrend could begin toward 40,000 and later 43,950. A bullish marubozu or volume-backed breakout candle would validate this setup. Bearish Scenario: If the index fails to cross 38,350 and slips below 37,000, a pullback toward 35,500 is likely. A breakdown below 35,500 would tilt the structure back toward weakness and neutralize the current bullish attempt.
Price Action
- ■Price action is structurally positive.
- ■Forming higher highs and higher lows.
Volume Profile
- ■Volume is supportive of the price action.
- ■Wait for volume expansion on breakout.
Key Levels
No zones specified
No zones specified
Invalidation Scenario
A weekly close below the support level invalidates this structure.

NIFTY FMCG INDEX
charts to-watchRecent candles show bullish recovery after a minor corrective phase. While not strongly
Resistance Zone Re-Test [Multi-Month
Thesis & Analysis
Consolidation] Price Action Overview: The Nifty FMCG Index has been moving within a broad consolidation range between 51,000–58,000 for the last several months. Recently, the index bounced strongly from a rising trendline support and has again approached the critical resistance zone at 58,500–58,080, where it was previously rejected. The pattern shows that the index is attempting to re-approach this supply zone after a healthy pullback, forming a bullish structure of higher lows. If this resistance zone is crossed, it could trigger a significant upside breakout. Candlestick Pattern: Recent candles show bullish recovery after a minor corrective phase. While not strongly impulsive yet, the structure suggests readiness for a breakout attempt. No reversal signs are present near the base. a bullish continuation. 2. Crucial Support and Resistance Levels Support Levels: 56,000–55,500: Immediate swing support from recent pullback lows. 51,200–50,200: Multi-month support base and long-term trendline confluence. 50,000: Psychological round number; structural support floor. Resistance Levels: 58,500–58,080: Major supply zone; the key to unlocking further upside. 60,000+: Potential target if breakout sustains; aligns with projected move from consolidation. 65,000+: Previous all-time high region and long-term extension target. 3. Strategic Trade Scenarios Bullish Scenario: If the index breaks out above 58,500, supported by strong bullish candles, the move may extend toward 60,000+ in the near term. Sustained momentum could even push toward 65,000, especially if the broader market supports sectoral strength. Bearish Scenario: Failure to break above the 58,500–58,080 resistance and a dip below 55,500 could indicate renewed weakness. This may pull the index back toward the 51,200–50,000 zone, especially if bearish candles appear near resistance.
Price Action
- ■Price action is structurally positive.
- ■Forming higher highs and higher lows.
Volume Profile
- ■Volume is supportive of the price action.
- ■Wait for volume expansion on breakout.
Key Levels
No zones specified
No zones specified
Invalidation Scenario
A weekly close below the support level invalidates this structure.
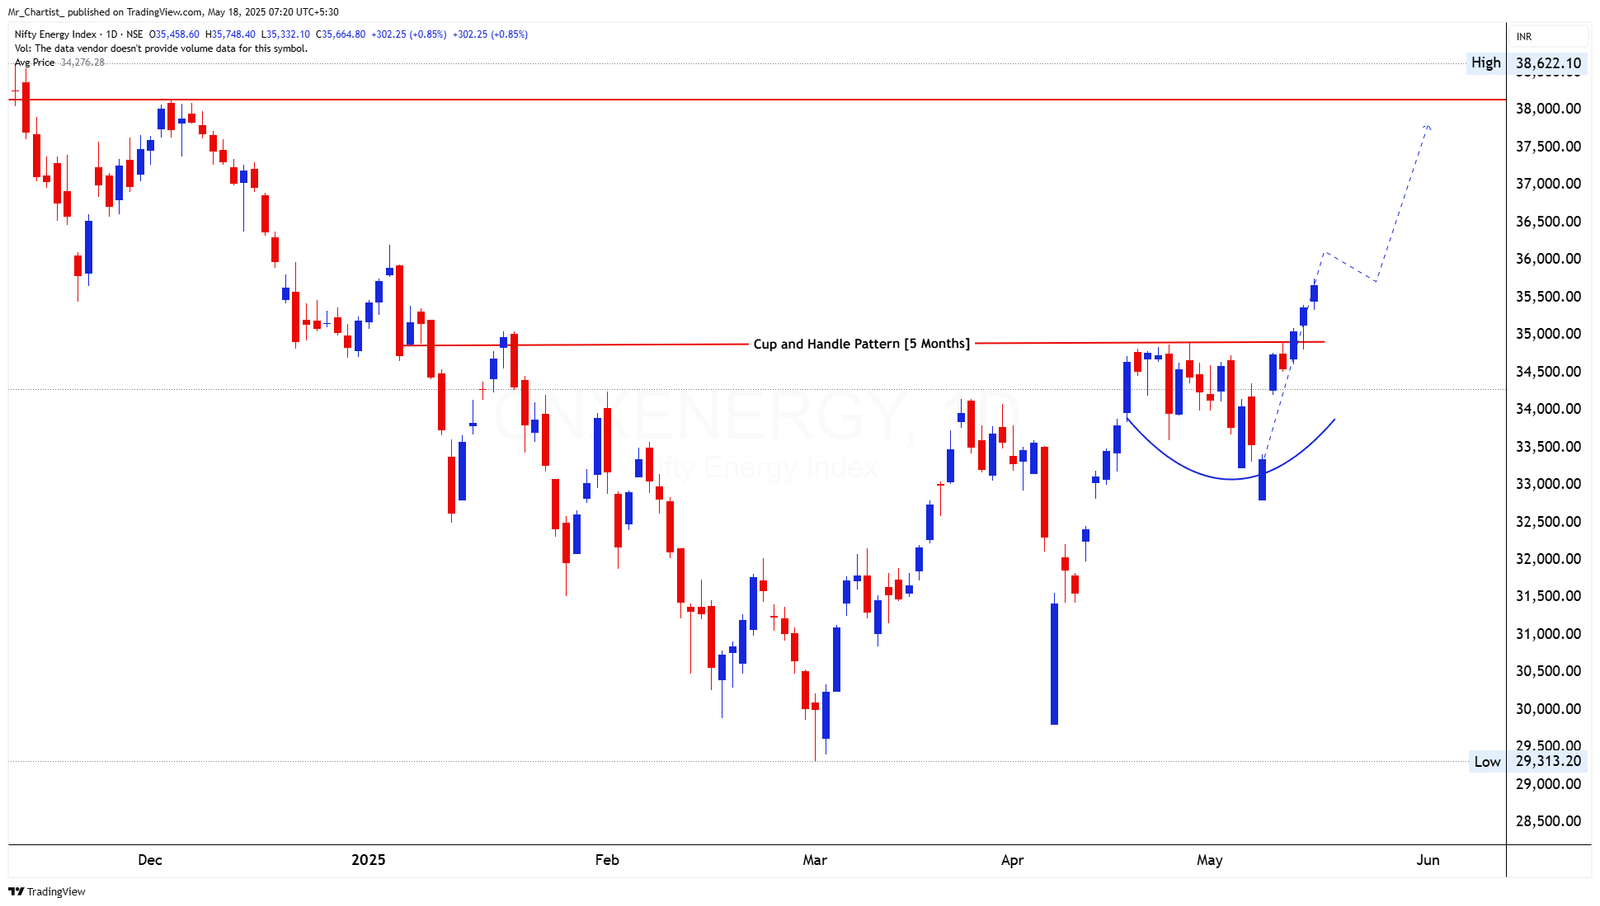
NIFTY FINANCIAL SERVICES INDEX
charts to-watchTight candles dominate the flag region, suggesting consolidation with low
Symmetrical Triangle Breakout [3 Months]
Thesis & Analysis
Pole and Flag Continuation Pattern [Current Consolidation Phase – 3 Months] Price Action Overview: The index initially formed a symmetrical triangle from January to March 2025, which it broke out of with strength, confirming a medium-term trend reversal. This was followed by a sharp vertical rally (the "pole"), and now the price is consolidating in a narrow horizontal range forming a flag pattern. This flag has been in development for nearly 3 months. A breakout above 26,800 would complete the pattern and likely resume the bullish trend. The consolidation appears healthy, with price holding above 25,750, a key support inside the flag. Candlestick Pattern: Tight candles dominate the flag region, suggesting consolidation with low volatility. Occasional upper and lower wicks indicate indecision, typical before a breakout. No reversal signal yet. 2. Crucial Support and Resistance Levels Support Levels: 25,750: Lower boundary of the flag; crucial for maintaining the current structure. 25,000: Prior resistance-turned-support from the triangle breakout. 24,000: Consolidation base before breakout; deeper support level. Resistance Levels: 26,800: Upper edge of the flag and the breakout trigger zone. 27,500: Initial post-breakout projection. 28,000–28,500: Extended target if momentum builds post-flag breakout. 3. Strategic Trade Scenarios Bullish Scenario: A break and close above 26,800 would activate the pole and flag continuation, potentially driving the index toward 27,500–28,500. Look for large-bodied bullish candles and strong follow-through to confirm the move. Bearish Scenario: If the index breaks below 25,750, the flag may fail, leading to a retest of the 25,000–24,000 zone. Breakdown candles and weak follow-up would confirm this bearish shift.
Price Action
- ■Price action is structurally positive.
- ■Forming higher highs and higher lows.
Volume Profile
- ■Volume is supportive of the price action.
- ■Wait for volume expansion on breakout.
Key Levels
No zones specified
No zones specified
Invalidation Scenario
A weekly close below the support level invalidates this structure.
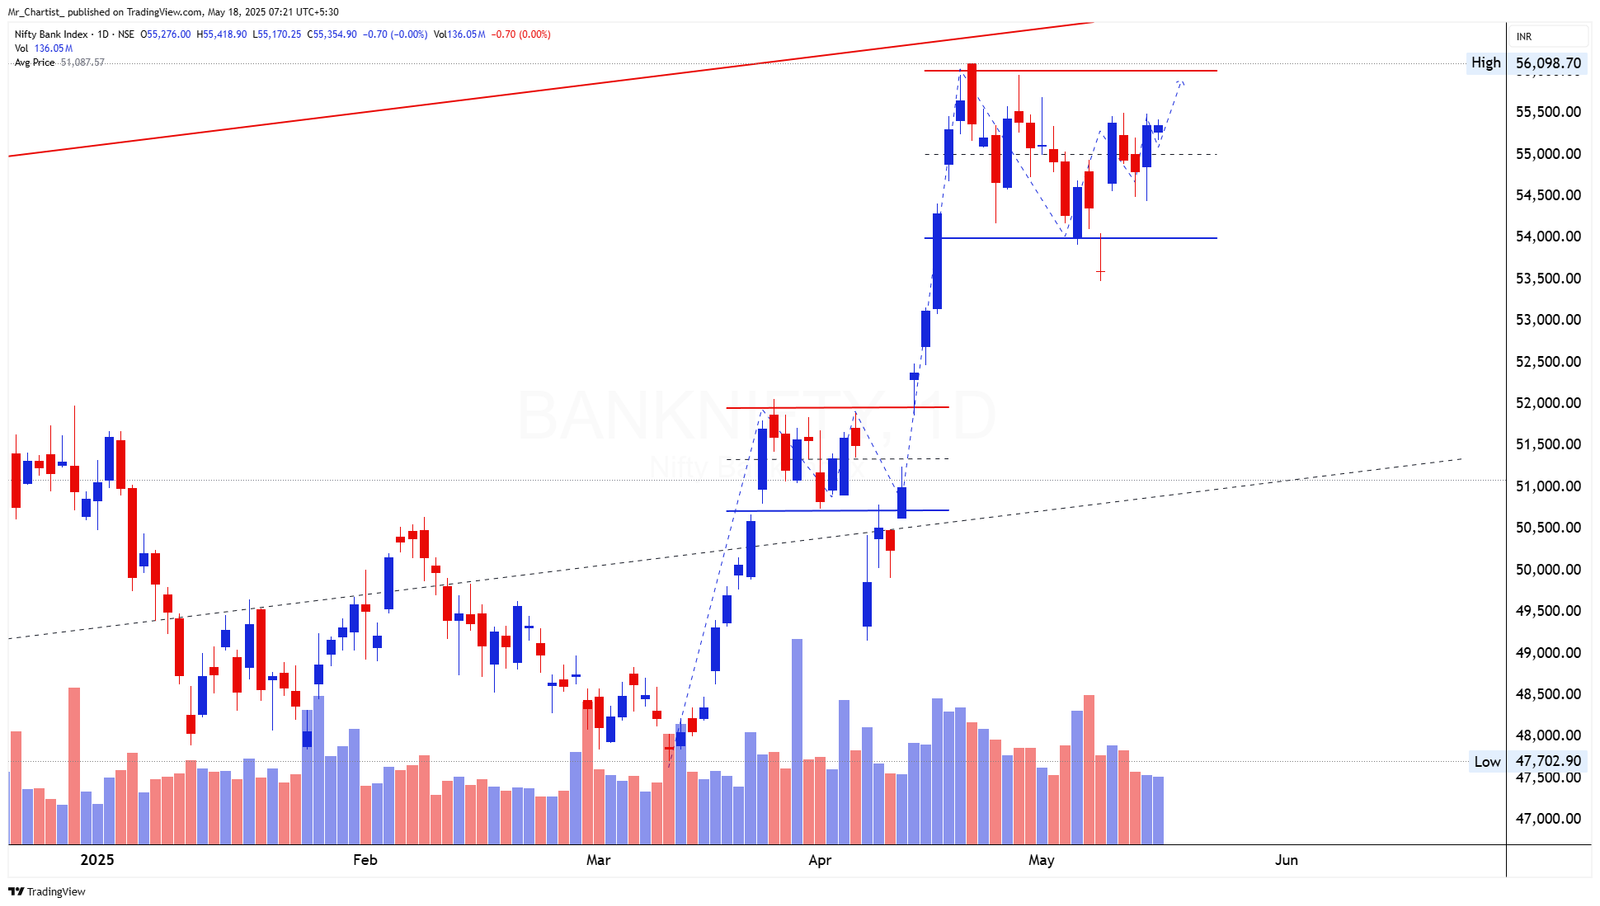
NIFTY ENERGY INDEX
charts to-watchStrong bullish candles broke through the neckline, and there is no bearish
Cup and Handle Pattern [5 Months]
Thesis & Analysis
Price Action Overview: The Nifty Energy Index has formed a 5-month Cup and Handle pattern, a classic bullish continuation setup. The rounded base (cup) began forming in January, followed by a shallow pullback (handle) in April and early May. Recently, the index broke out above the neckline at 35,000, confirming pattern completion. The current structure shows a strong upside breakout supported by a prior rounded base, with higher highs and higher lows forming post-handle. Candlestick Pattern: Strong bullish candles broke through the neckline, and there is no bearish reversal pattern at present. Minor pullback candles may appear as part of normal post-breakout retesting behavior. 2. Crucial Support and Resistance Levels Support Levels: 35,000: Neckline breakout zone and immediate support. 33,500: Handle low and recent higher low area. 31,000: Long-term base of the cup pattern and structural demand zone. Resistance Levels: 37,500: Immediate projection level based on cup depth. 38,622: All-time high; a psychological and technical resistance. 3. Strategic Trade Scenarios Bullish Scenario: A sustained move above 35,000 confirms the cup and handle breakout. Upside targets include 37,500 followed by 38,622, assuming momentum holds and broader market conditions remain supportive. Bearish Scenario: If the index fails to hold 35,000 and dips back below 33,500, it would indicate a potential failed breakout, increasing the risk of a pullback toward 31,000. Watch for bearish candles or lower highs forming near resistance.
Price Action
- ■Price action is structurally positive.
- ■Forming higher highs and higher lows.
Volume Profile
- ■Volume is supportive of the price action.
- ■Wait for volume expansion on breakout.
Key Levels
No zones specified
No zones specified
Invalidation Scenario
A weekly close below the support level invalidates this structure.
Chart Image Not Extracted
NIFTY BANK INDEX
charts to-watchRecent candles show healthy recovery after a false breakdown attempt near 54,000.
Flag Continuation Pattern [1 Month]
Thesis & Analysis
Price Action Overview: The Nifty Bank Index has been in a bullish consolidation phase following a strong vertical rally in April. This has developed into a flag pattern, holding within a narrow horizontal range between 54,000–55,900 for nearly a month. The consolidation appears orderly, forming higher lows while retesting support on dips. Previously, the index broke out from a mini-range resistance around 52,000, and the follow-up was sharp and impulsive. The current consolidation near recent highs suggests the market is preparing for a possible continuation. Candlestick Pattern: Recent candles show healthy recovery after a false breakdown attempt near 54,000. Bullish candles with reduced lower wicks indicate dip-buying interest. Volume Analysis: Volume has declined during consolidation, typical in flag formations. A breakout from the range on expanded volume would likely confirm resumption of the uptrend. 2. Crucial Support and Resistance Levels Support Levels: 54,000: Base of the flag; key support holding multiple retests. 52,000: Previous breakout level and demand zone. 50,500: Trendline and minor pullback support. Resistance Levels: 55,900–56,100: Flag resistance and recent swing high; breakout point. 57,500: Projected target based on flagpole height. 59,000: Longer-term channel resistance as seen in broader chart context. 3. Strategic Trade Scenarios Bullish Scenario: If price breaks above 55,900 and sustains, it would confirm the flag breakout, with potential upside toward 57,500 and even 59,000. A strong breakout candle with high volume would support this move. Bearish Scenario: A breakdown below 54,000 would weaken the current setup, possibly triggering a pullback to 52,000 or even lower to 50,500. Watch for bearish engulfing or large red candles to confirm.
Price Action
- ■Price action is structurally positive.
- ■Forming higher highs and higher lows.
Volume Profile
- ■Volume is supportive of the price action.
- ■Wait for volume expansion on breakout.
Key Levels
No zones specified
No zones specified
Invalidation Scenario
A weekly close below the support level invalidates this structure.
SEBI Registered Research Analyst — INH000015297 (INVESTOLOGY). Investment in securities market are subject to market risks. Read all related documents carefully before investing. The content provided is for educational purposes only and should not be considered as financial advice. Past performance is not indicative of future results.