Coming Soon
The Weekend Visual ChartBook is currently undergoing a massive upgrade. Stay tuned for a world-class reading experience.
Return HomeWeekend Visual ChartBook
Edition #278
07 September 2025
Market Pulse
LiveReal-time index prices above. Detailed index chart analysis below in the Indices section.
Bullish Charts [F&O]
Breakout and momentum setups from the F&O universe
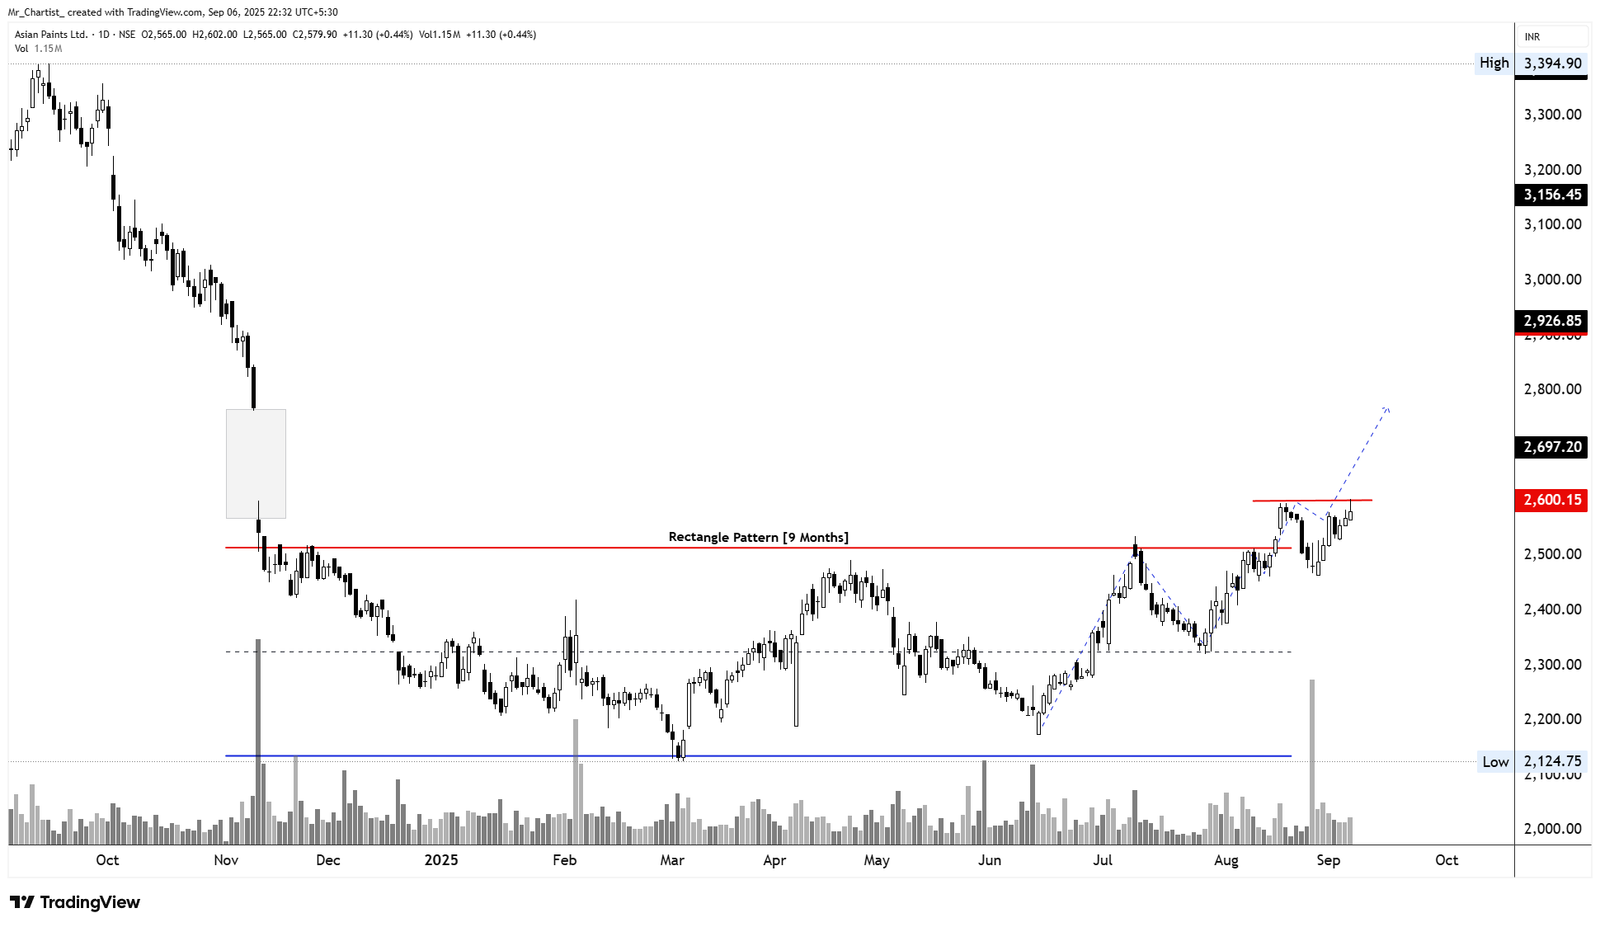
Asian Paints Ltd.
bullish fnoRectangle Pattern (Range-Bound Breakout Setup)
9 Months (Daily Chart – Bullish Reversal Structure)
Thesis & Analysis
Asian Paints has been consolidating within a rectangle pattern for the past 9 months, with a well-defined base around ₹2,125 and resistance near ₹2,600. The stock recently formed a bullish rally from the lower end of the range and is now trading right near the rectangle resistance zone. A breakout above ₹2,600– ₹2,620 would signal a pattern breakout, confirming a potential trend reversal and initiating a fresh upside move. This level also overlaps with a prior gap zone formed during a major breakdown last year, which adds confluence to this critical level. Candlestick Behavior: Price has respected both the support and resistance boundaries of the rectangle. Recent candles are forming a tight base just below the resistance, indicating consolidation before a breakout. Price action remains bullish above ₹2,500 with a strong close needed above ₹2,620. Volume Analysis: Volume has picked up significantly on the recent rally from ₹2,125 to current levels. Notably, bullish volume spikes have occurred on up-days, suggesting accumulation. A breakout with volume above 1.5M–2M shares would confirm the breakout and add momentum.
Price Action
No specific price action noted.
Volume Profile
No specific volume analysis noted.
Key Levels
Invalidation Scenario
Close below ₹2,450 with volume would negate near-term bullish bias and reintroduce range-bound or bearish outlook.
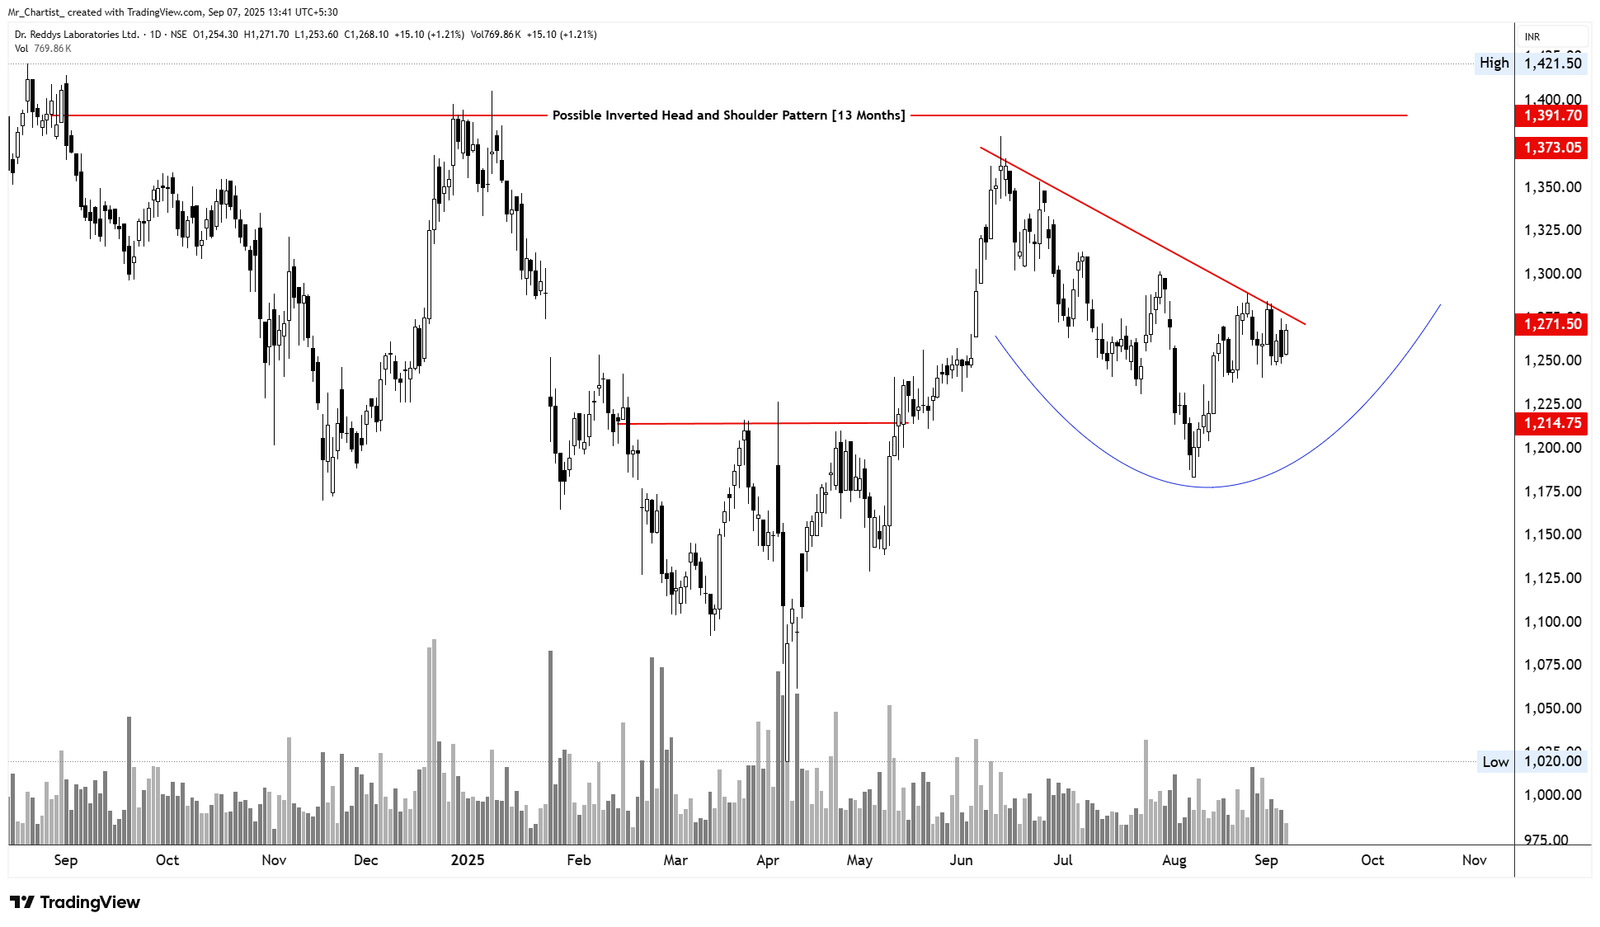
Dr. Reddy's Laboratories Ltd.
bullish fnoPossible Inverted Head and Shoulders
13 Months (Daily Chart – Long-Term Bullish Reversal)
Thesis & Analysis
Dr. Reddy’s is currently developing a Potential Inverted Head & Shoulders Pattern, signaling a long-term trend reversal setup. The left shoulder, head, and right shoulder appear to be forming within a curved base with the neckline resistance at ~₹1,373. This structure is forming after a prolonged downtrend, which adds more significance to the potential reversal. The price is currently approaching the downward-sloping neckline trendline, and a breakout above this would confirm the reversal breakout, targeting higher levels. Candlestick Behavior: The right shoulder has shown price rejection near ₹1,215 and rebounded strongly. Recent candles are forming a bullish base just under the neckline trendline (~₹1,275–₹1,300). Price is compressing under the trendline — a bullish breakout may be imminent if volume supports it. Volume Analysis: Volume surged near the head formation (~₹1,100), suggesting accumulation. Volume is slightly subdued during the recent rise — confirmation requires a spike above 1M on breakout. Watch for a bullish wide-range candle above ₹1,375 with volume as confirmation.
Price Action
No specific price action noted.
Volume Profile
No specific volume analysis noted.
Key Levels
Invalidation Scenario
A daily close below ₹1,175 would negate the pattern and reintroduce bearish bias.
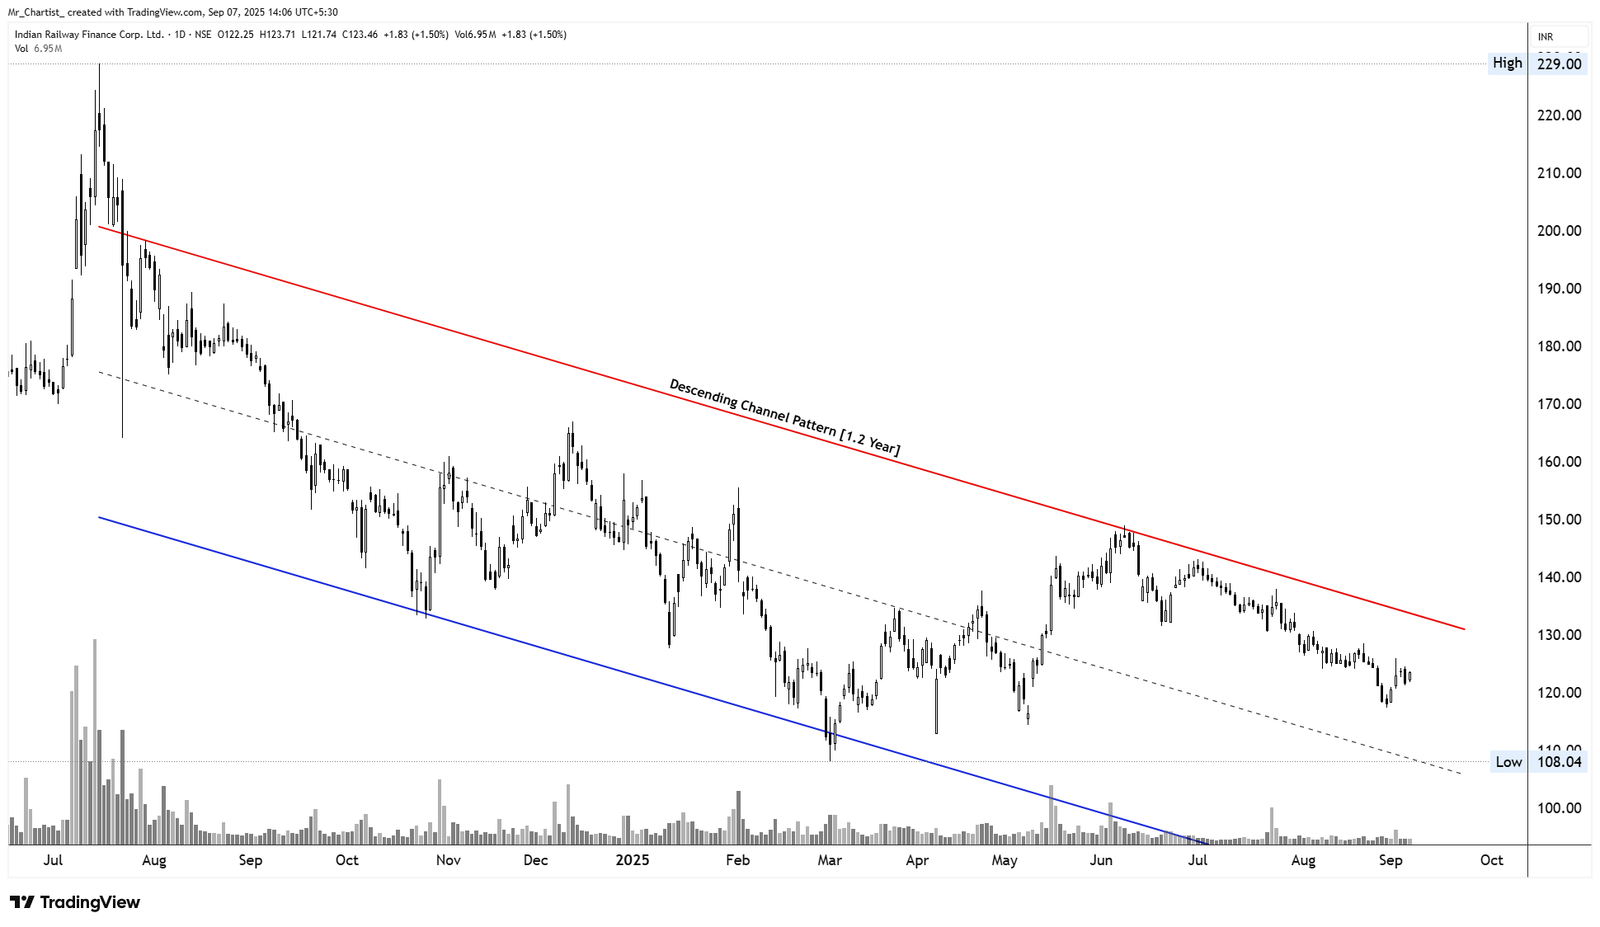
Indian Railway Finance Corp. Ltd. (IRFC)
bullish fnoDescending Channel Pattern
1.2 Years (Daily Chart – Medium-to-Long-Term Bearish Structure
Thesis & Analysis
with Potential for Reversal) IRFC has been trading inside a well-defined descending channel for the last 1.2 years, consistently making lower highs and lower lows. This pattern reflects a controlled downtrend with price respecting both the upper and lower trendlines. However, recent price action shows a short-term base forming near the lower half of the channel. This base, along with a mild bounce, hints at a potential reversal or relief rally, especially if the price starts climbing toward the channel resistance. Candlestick Behavior: Recent candles show small-bodied consolidation with mild upward bias near the support zone. No major bullish breakout yet, but the presence of demand near ₹120–₹122 suggests buyers are stepping in. Price needs to break the channel resistance (~₹135–₹140) for trend reversal confirmation. Volume Analysis: Volume has stayed relatively low and non-directional throughout the recent down leg. A spike in volume alongside a breakout from the upper trendline would be an early reversal confirmation. Keep an eye for volume >10M on breakout candles for higher conviction.
Price Action
No specific price action noted.
Volume Profile
No specific volume analysis noted.
Key Levels
Invalidation Scenario
A breakdown below ₹108 would invalidate the potential base and resume the downtrend toward ₹100 or lower.
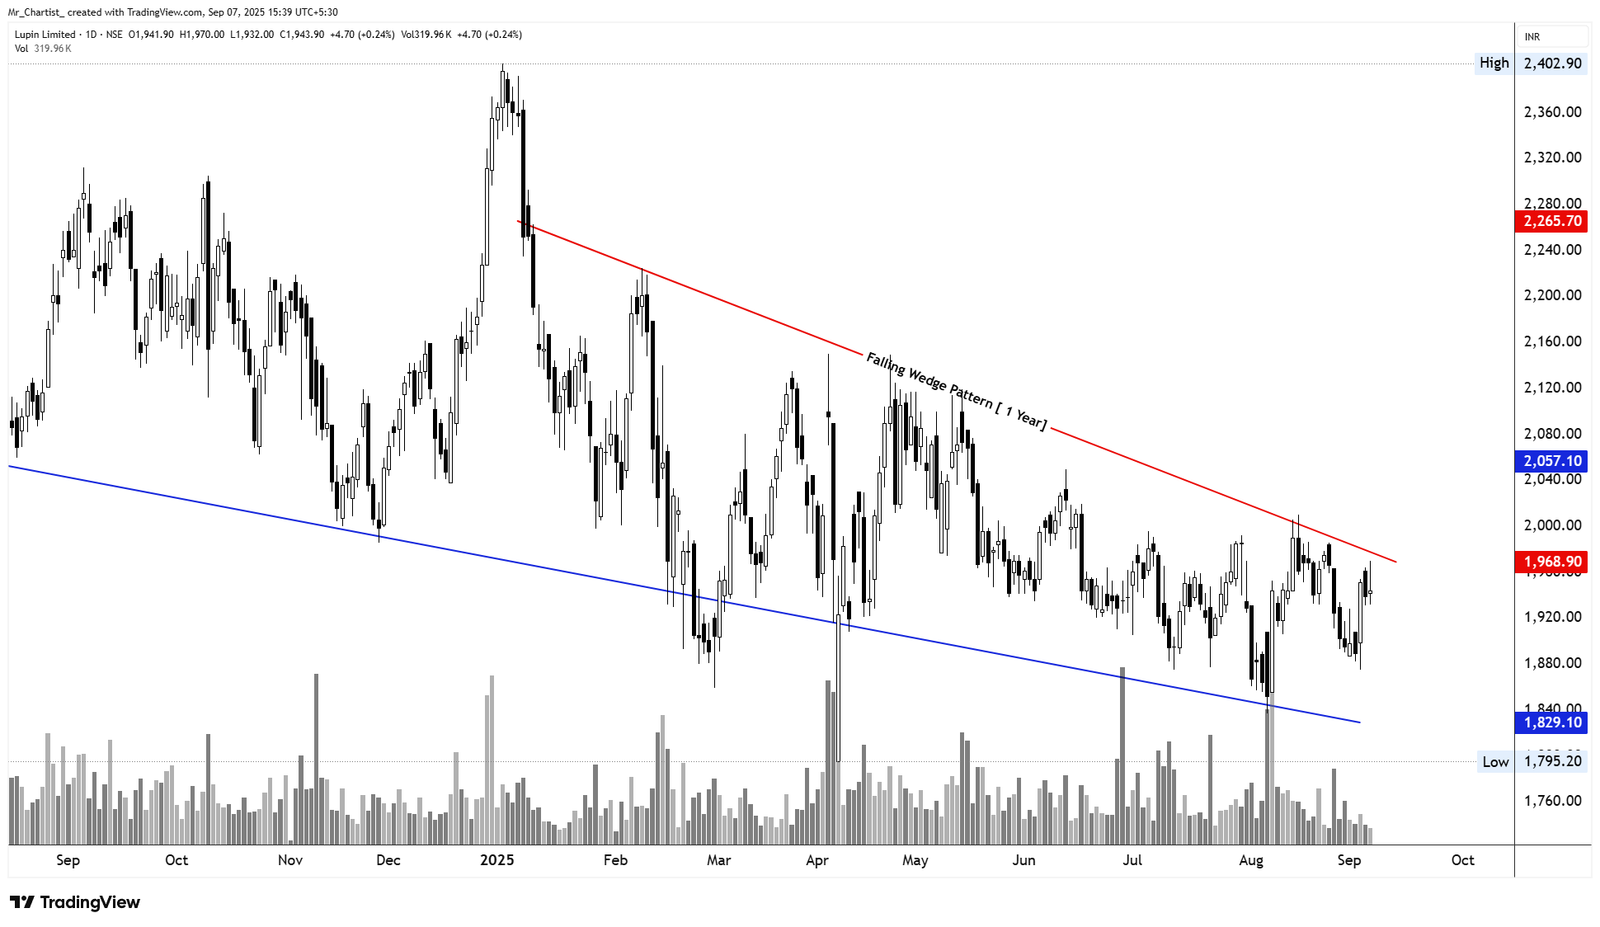
Lupin Ltd.
bullish fnoFalling Wedge Pattern
1 Year (Daily Chart – Bullish Reversal Setup)
Thesis & Analysis
Lupin has been moving within a well-defined falling wedge pattern, which is typically a bullish reversal pattern. The stock has respected both the descending resistance and support lines consistently for nearly a year. Currently, the price is nearing the upper trendline of the wedge (~₹1,970–₹1,980). A decisive breakout above this resistance with a strong candle and volume would confirm a bullish breakout and open doors for a fresh rally. Candlestick Behavior: Recent candles show rejection from wedge support (~₹1,830), followed by a small uptrend. No breakout yet, but momentum is building toward the resistance area. If the price breaks and sustains above ₹1,980, it would signal a bullish breakout from the wedge. Volume Analysis: Volume spikes are visible near support zones, hinting at buying interest at lower levels. A breakout candle above ₹1,980–₹2,000 with volume >400K would confirm pattern validation. Volume tapering within the wedge also supports a typical falling wedge structure.
Price Action
No specific price action noted.
Volume Profile
No specific volume analysis noted.
Key Levels
Invalidation Scenario
A breakdown below ₹1,795 on heavy volume would invalidate the wedge and resume the downtrend.
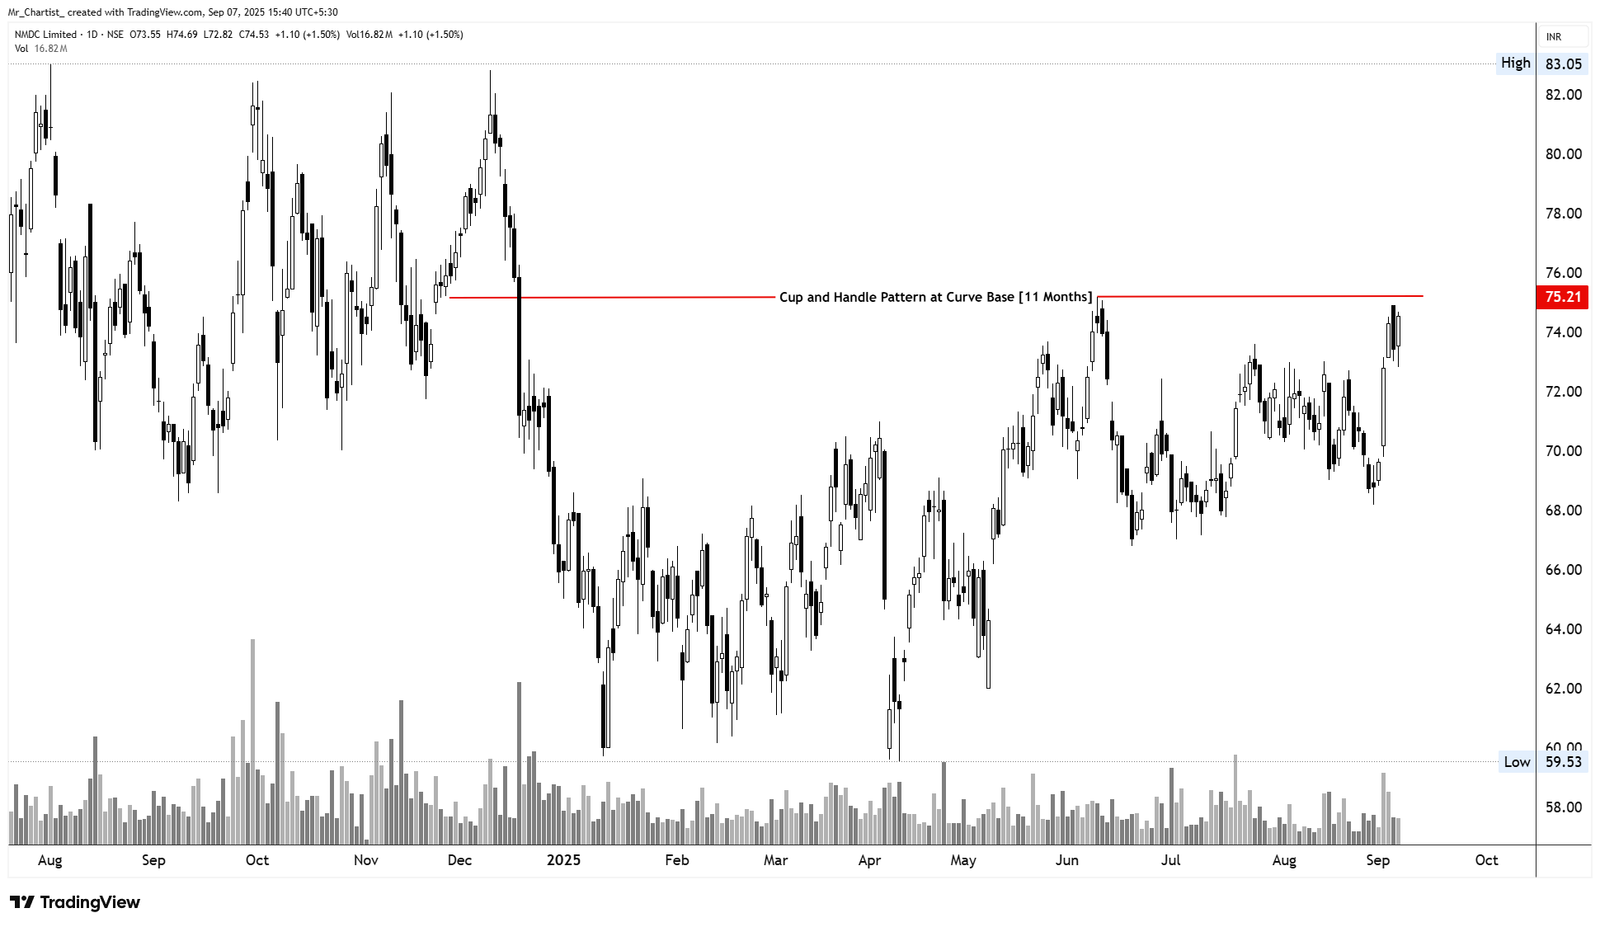
NMDC Ltd.
bullish fnoCup and Handle Pattern at Curve Base
11 Months (Daily Chart – Bullish Continuation Setup)
Thesis & Analysis
NMDC has formed a classic Cup and Handle Pattern over the past 11 months. This is a bullish continuation pattern, often seen before a strong breakout. The base of the cup is rounded, and the current handle is forming just below the breakout level near ₹75.20 – a key resistance. The stock is now approaching this neckline zone again, and a successful breakout above ₹75.20 would confirm the pattern and signal a fresh upward leg. Candlestick Behavior: Multiple rejections near ₹75 over the months have established a clear neckline. The recent candle shows strong buying near the handle support (~₹72), with a bullish close. A decisive breakout candle above ₹75.50 would be a trigger for the bullish move. Volume Analysis: Gradual increase in volume during the right side of the cup. Volume dips during the handle formation – typical of this pattern. A breakout with volume > 20M would confirm strong institutional participation.
Price Action
No specific price action noted.
Volume Profile
No specific volume analysis noted.
Key Levels
Invalidation Scenario
A break below ₹70.00 with high volume would invalidate the handle structure and delay breakout expectations.
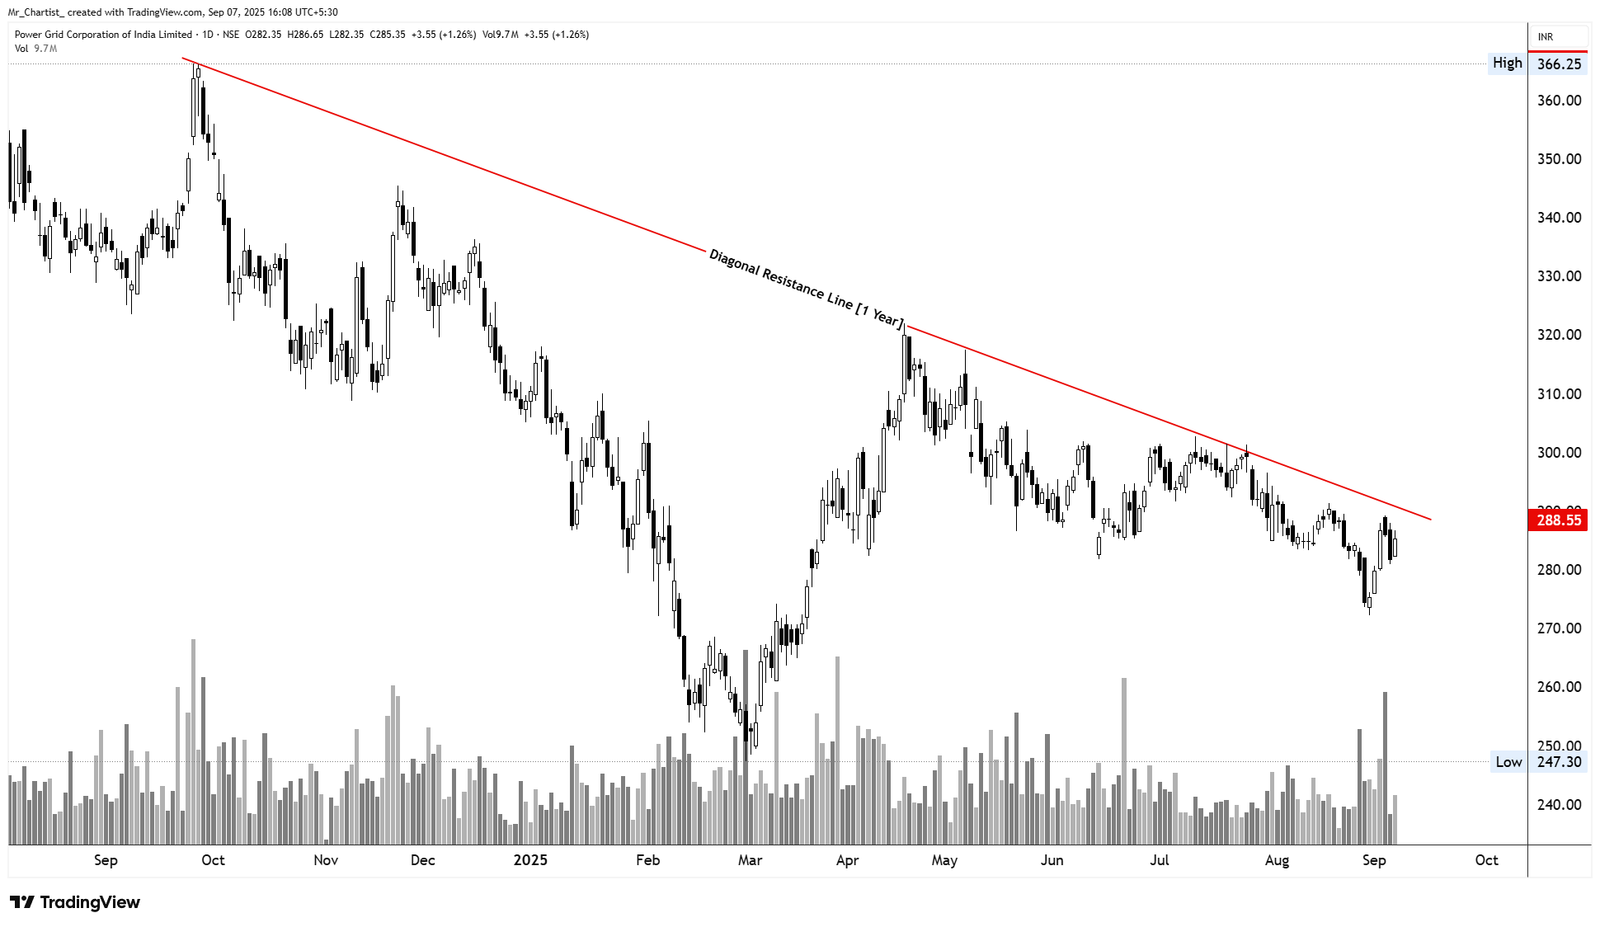
Power Grid Corporation
bullish fnoDiagonal Resistance Line
1 Year (Daily Chart – Medium-Term Downtrend with Imminent
Thesis & Analysis
Breakout Potential) POWERGRID has been respecting a clean descending trendline acting as diagonal resistance for nearly a year, repeatedly rejecting price advances around that dynamic level. The slope of the line reflects a moderate downtrend, but the reduced angle and recent price resilience suggest that the downward momentum may be weakening. The latest price structure indicates multiple higher lows in recent months — a subtle shift in sentiment that often precedes breakout attempts.
Price Action
- ■Recent candles have printed short-bodied ranges with higher lows, reflecting
- ■buying interest on dips.
- ■Price is now hovering just below the diagonal resistance (~₹288–₹290),
- ■hinting at an imminent breakout test.
- ■A strong bullish close above the trendline would indicate a momentum shift.
Volume Profile
- ■Volume has seen occasional spikes, especially on green days — suggesting
- ■accumulation under resistance.
- ■Sustained volume >10M on a breakout above ₹290 would act as a high
- ■conviction trigger.
- ■Volume on red candles has stayed relatively muted — a bullish divergence.
Key Levels
Invalidation Scenario
A close below ₹260 would weaken the base structure and delay the breakout scenario. Sustained rejection from ₹290 followed by volume-backed selling may push price back toward ₹247.
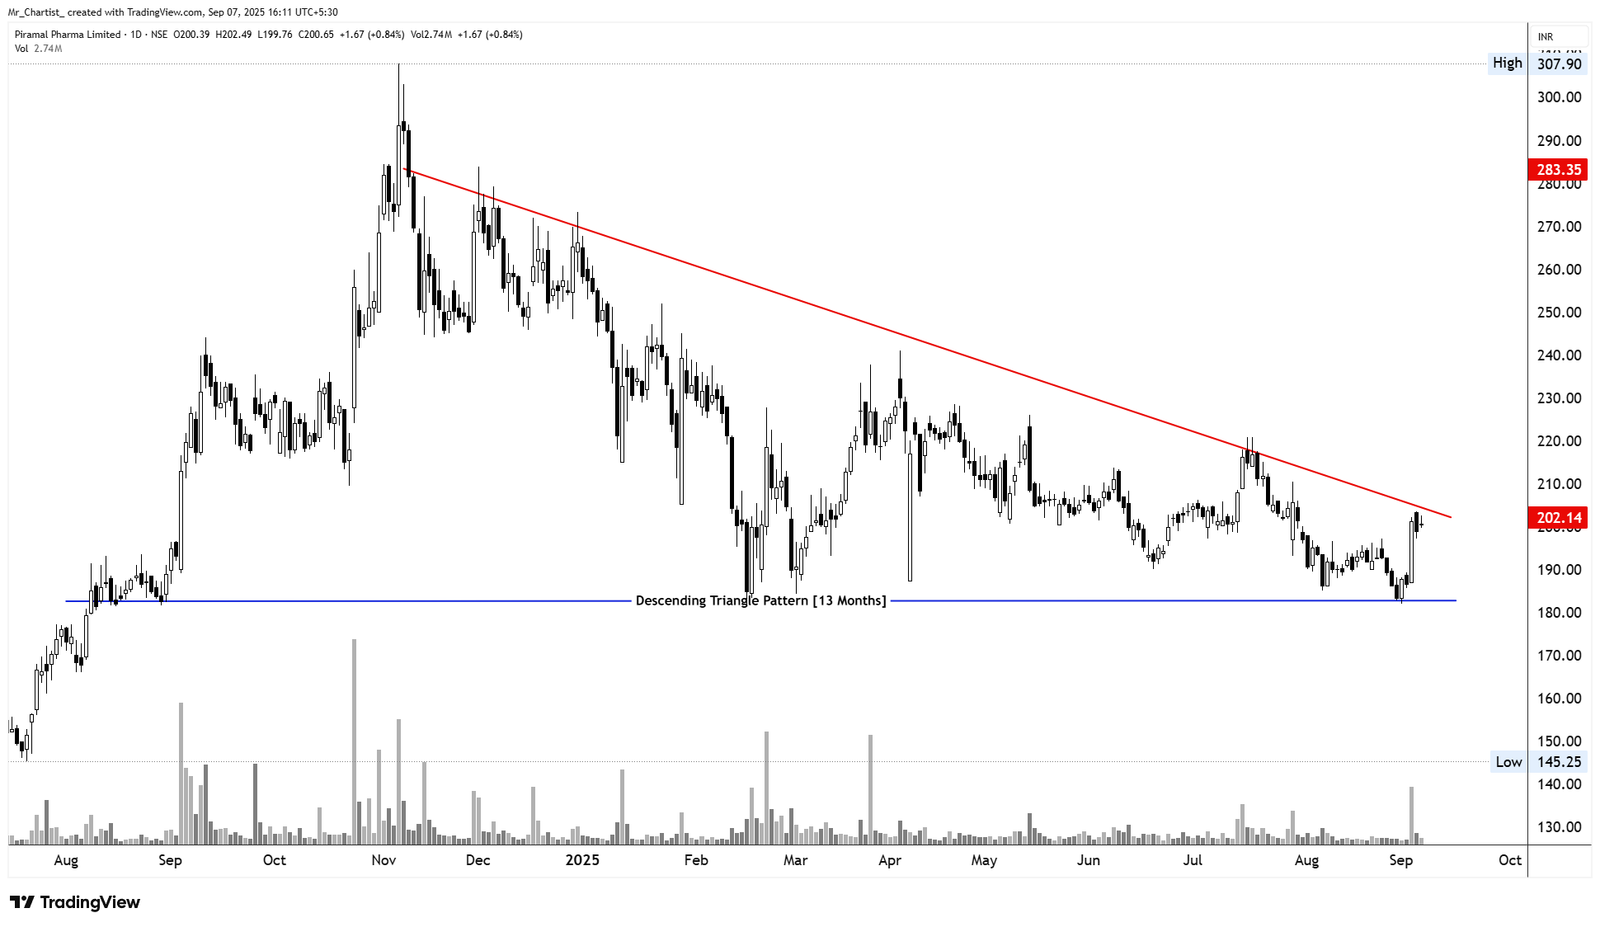
Piramal Pharma Ltd. (PPLPHARMA)
bullish fnoDescending Triangle Pattern
13 Months (Daily Chart – Bearish Continuation Structure with
Thesis & Analysis
Early Reversal Signs) PPLPHARMA has been forming a descending triangle for over a year, marked by a series of lower highs and a strong horizontal support zone near ₹180. This structure typically favors a bearish breakdown. However, recent bullish activity from the lower boundary suggests buying interest emerging near the base, hinting at a possible shift in market sentiment. The resilient bounce from the ₹180 zone and current approach toward the falling trendline (~₹205–₹210) adds weight to a potential pattern invalidation if price breaks above.
Price Action
- ■A notable bullish bounce from the triangle base was followed by a sequence of
- ■higher closes.
- ■Candle bodies are getting larger — a subtle momentum shift in favor of bulls.
- ■Price is now testing the descending trendline, where rejection or breakout
- ■confirmation will be crucial.
Volume Profile
- ■Volume has spiked during the recent bounce — suggesting stronger
- ■participation from bulls near ₹180.
- ■Watch for volume >3.5M on breakout above the triangle resistance as a high-
- ■confidence reversal trigger.
- ■Low-volume red candles during past declines also support a loss of selling
- ■strength.
Key Levels
Invalidation Scenario
A decisive breakdown below ₹180 with strong volume would confirm the triangle’s bearish implication, opening downside risk toward ₹160 or even ₹145.
Bearish Charts [F&O]
Breakdown and weakness watch setups
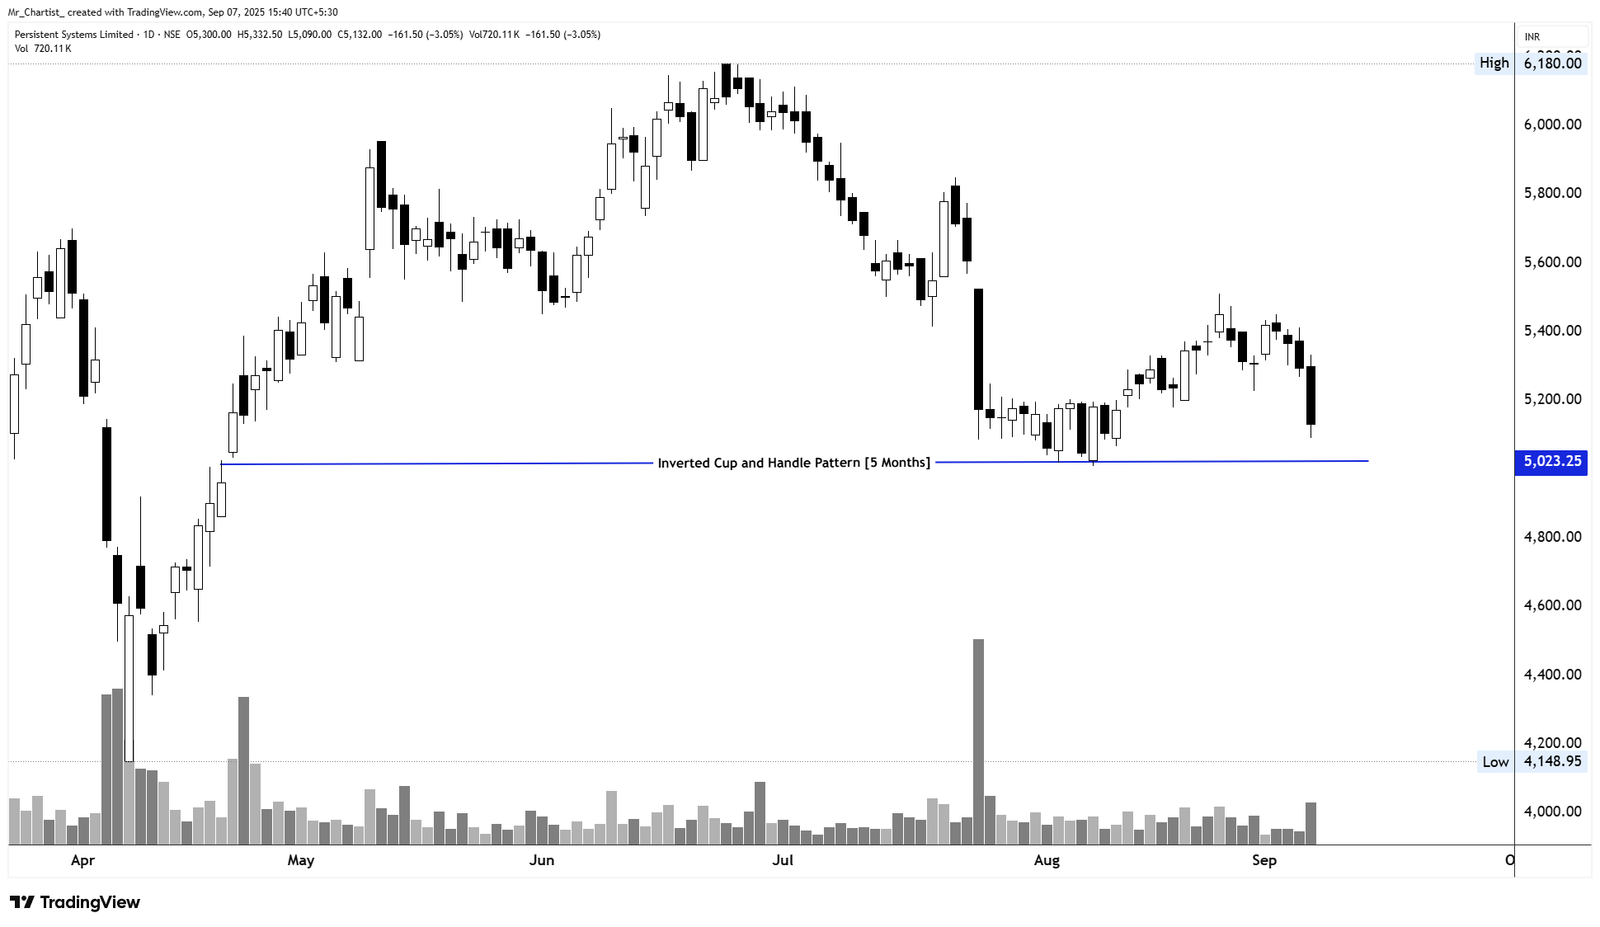
Persistent Systems Ltd. (PERSISTENT)
bearish fnoInverted Cup and Handle Pattern
5 Months (Daily Chart – Bearish Continuation Structure)
Thesis & Analysis
PERSISTENT is currently forming an Inverted Cup and Handle Pattern, a typically bearish setup suggesting distribution at the top followed by a potential breakdown. The neckline is clearly visible near the ₹5,020–₹5,030 zone, which has been tested multiple times in recent months. The failure to sustain above ₹5,400–₹5,500, followed by increasing downward pressure, signals waning bullish strength. Price has now returned to retest the neckline, and a breakdown below it could trigger significant downside momentum.
Price Action
- ■Recent candles show strong bearish bodies with increasing intensity, especially
- ■in the last few sessions.
- ■The price has consistently failed to hold intraday rallies, indicating supply
- ■absorption at higher levels.
- ■Current price action is leaning heavily on the neckline, setting up a potential
- ■breakdown.
Volume Profile
- ■Volume has expanded significantly on red candles — suggesting active selling
- ■by institutional participants.
- ■A decisive volume surge (>800K–1M) on breakdown would confirm the
- ■pattern.
- ■Prior attempts to bounce off the neckline have been on lower volume, which
- ■lacks conviction.
Key Levels
Invalidation Scenario
A close above ₹5,600 would invalidate the bearish structure and signal a failed breakdown, potentially triggering short-covering.
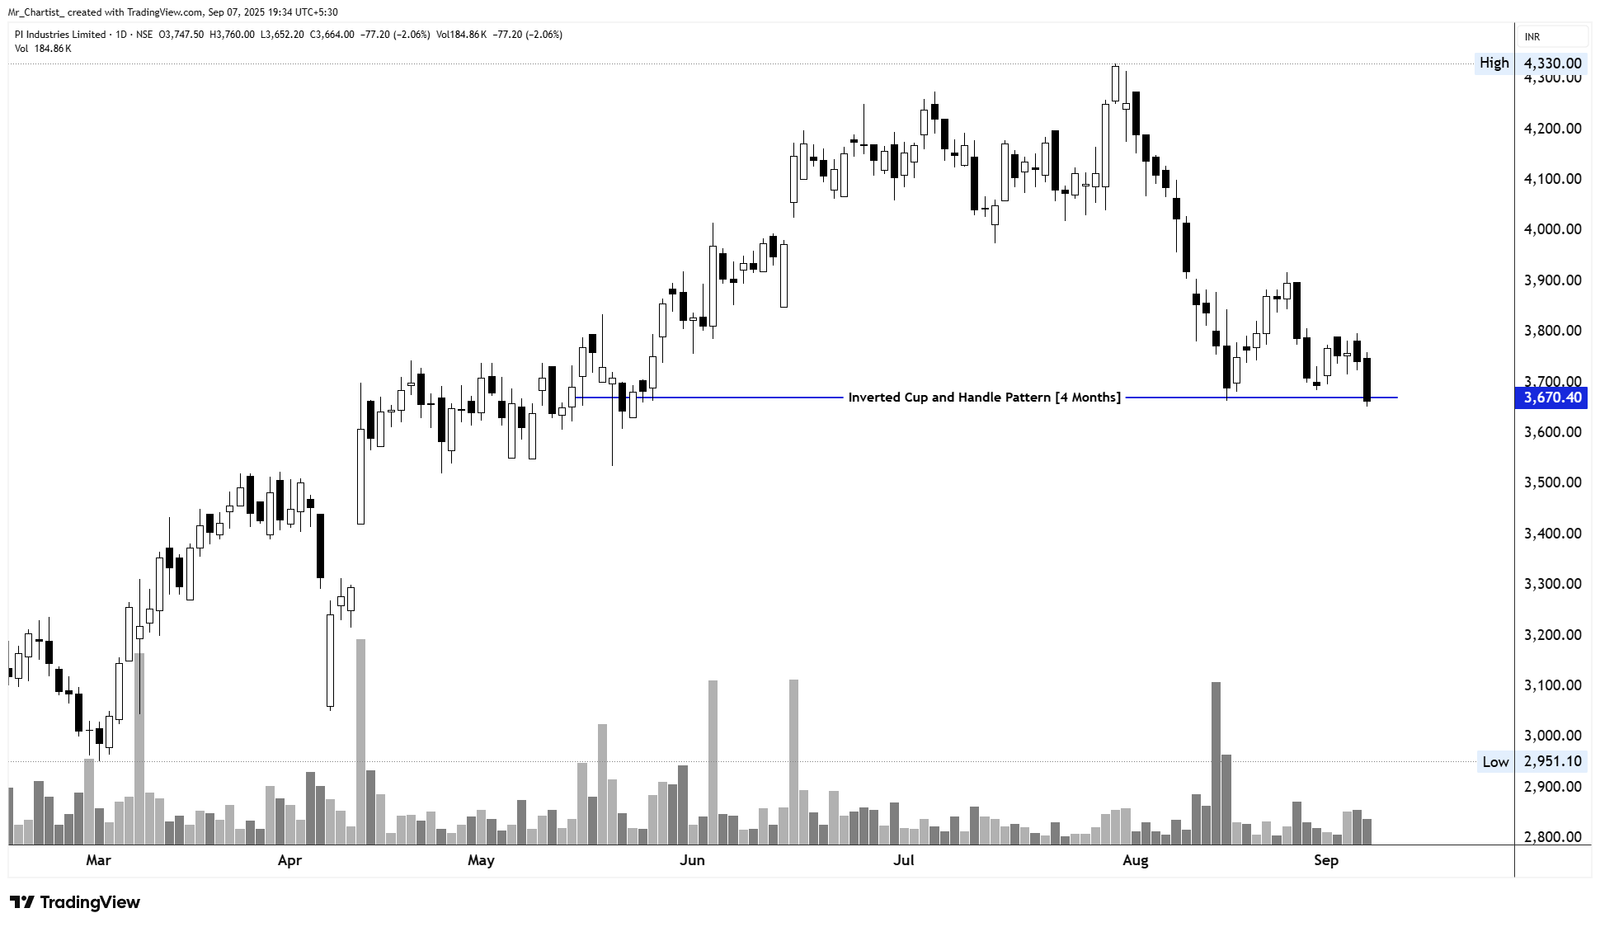
PI Industries Ltd. (PIIND)
bearish fnoInverted Cup and Handle Pattern
4 Months (Daily Chart – Bearish Continuation Setup)
Thesis & Analysis
PIIND is exhibiting a classic Inverted Cup and Handle Pattern, which indicates a potential bearish continuation after a failed uptrend. The neckline support at ₹3,670 has been tested multiple times, and price is currently hovering just above this critical zone. This setup signifies distribution at the top, with buyers losing control and sellers gradually overpowering. A breakdown below this neckline could initiate a sharp downside move.
Price Action
- ■Recent sessions show lower highs and long-bodied bearish candles,
- ■confirming dominant supply.
- ■The handle formation lacked strength, and follow-up buying was weak.
- ■Current price action has slipped below the handle base, suggesting a
- ■breakdown is imminent.
Volume Profile
- ■Volume remains moderate, but red candles are forming on relatively higher
- ■volumes, which is a sign of distribution.
- ■Breakdown confirmation requires volume expansion above 250K–300K shares
- ■to validate the pattern.
- ■The handle lacked accumulation volume, weakening any bullish case.
Key Levels
Invalidation Scenario
A daily close above ₹4,000 with strong volume would invalidate the bearish setup, indicating buyers have regained strength.
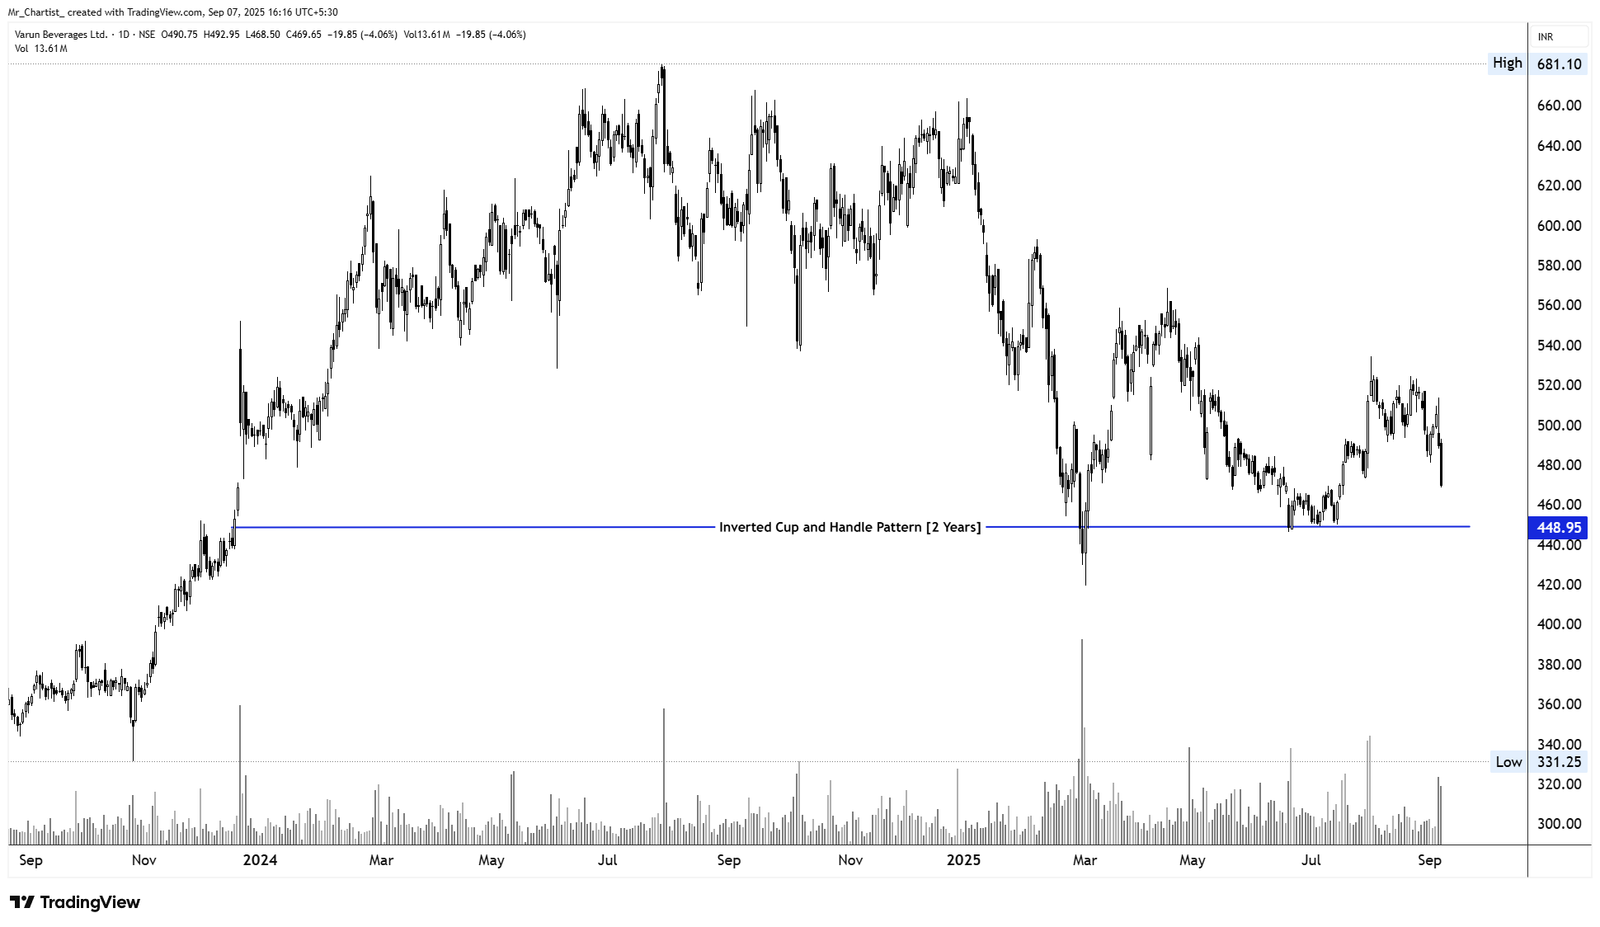
Varun Beverages Ltd. (VBL)
bearish fnoInverted Cup and Handle Pattern
2 Years (Daily Chart – Long-Term Distribution with Breakdown
Thesis & Analysis
Risk) VBL is forming a well-established Inverted Cup and Handle pattern spanning two years—a structure typically signaling a bearish continuation after a prolonged topping phase. The neckline at ₹448.95 has acted as strong horizontal support for over a year, and price is now dangerously close to violating it. This setup reflects major distribution at the top, followed by weakening bullish momentum. A decisive break below the neckline would likely trigger a sharp downside move, validating the bearish formation.
Price Action
- ■Recent candles show sharp downward rejection and consistent selling
- ■pressure.
- ■Multiple failed bounces near ₹500 suggest strong overhead supply.
- ■Price is now pressing into the neckline support with rising bearish
- ■momentum.
Volume Profile
- ■Heavy volume spikes on down days reflect aggressive institutional selling.
- ■Volume has begun to increase near support, a red flag that a breakdown is
- ■building up.
- ■Watch for a volume surge above 15M+ shares on a breakdown to confirm.
Key Levels
Invalidation Scenario
A sustained move and close above ₹530 with volume would invalidate the bearish setup and suggest resumption of a larger uptrend.
SME Bullish Charts
Small & Medium Enterprise breakout opportunities
Prime Fresh Ltd
sme bullishSymmetrical Triangle Breakout
2 Years (Daily Chart – Long-Term Compression Breakout)
Thesis & Analysis
Ducol Organics & Colours Ltd has broken out of a well-defined symmetrical triangle pattern that had been forming for over 24 months. This pattern displayed progressively narrowing price action with lower highs and higher lows, indicating long-term consolidation and buildup. The breakout has occurred just above the ₹145–₹147 zone, with a clean candle close above the descending trendline, marking a strong bullish shift in structure. This breakout breaks the dominant compression zone and opens room for a trend reversal. Candlestick Behavior: The breakout candle is long-bodied and bullish, signaling strong buyer intent. Previous candles showed lower volatility – typical of breakout compression buildup. Clean and decisive structure with minimal upper wick, confirming strength. Volume Analysis: Volume expanded sharply on the breakout day – the highest in several weeks. Previous breakout attempts lacked volume confirmation – this one stands out. Sustained participation above average in coming sessions would confirm strength continuation.
Price Action
No specific price action noted.
Volume Profile
No specific volume analysis noted.
Key Levels
No zones specified
No zones specified
Cash Bullish Charts
Equity delivery-based bullish setups
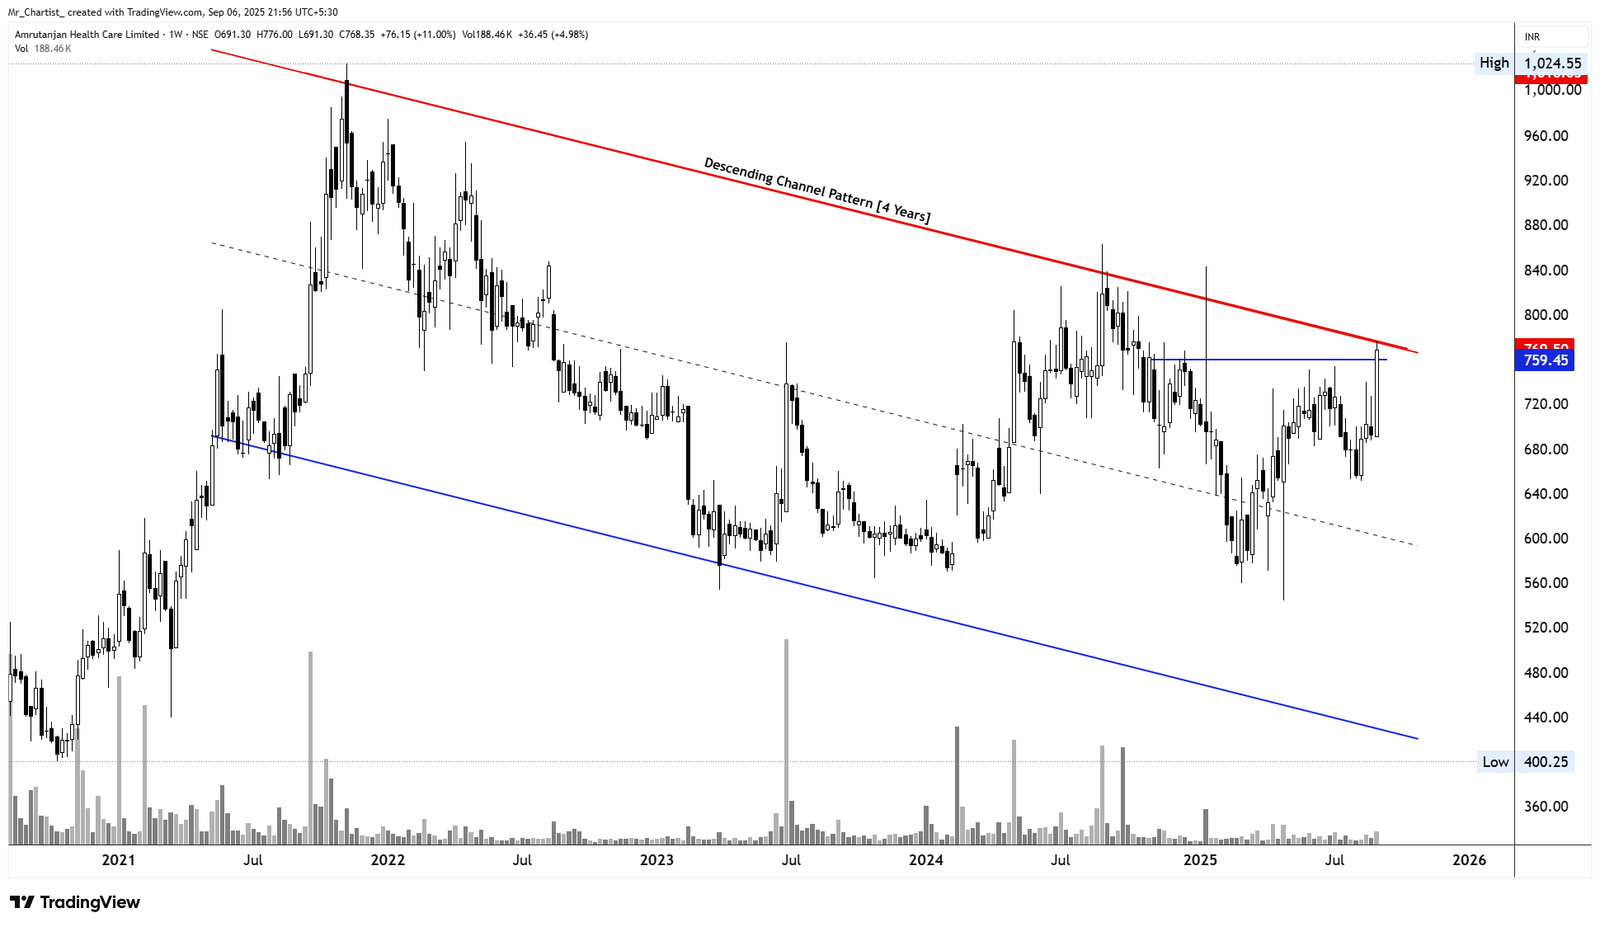
Amrutanjan Health Care Ltd. (AMRUTANJAN)
cash bullishDescending Channel Pattern
4 Years (Weekly Chart – Long-Term Bearish Channel with Recent
Thesis & Analysis
Breakout Attempt) Amrutanjan has been moving within a long-term descending channel for the last 4 years, forming consistent lower highs and lower lows. This pattern reflects a dominant downtrend structure. However, the recent price action stands out — a bullish breakout attempt above the mid-channel resistance near ₹755–₹760, following months of accumulation in the lower half of the channel. This signals early signs of a long-term trend reversal.
Price Action
- ■A strong weekly bullish candle closing at the upper boundary of the channel.
- ■Multiple prior rejections around ₹750–₹760 now taken out on strong
- ■momentum.
- ■The next 1–2 candles will be critical to confirm sustained breakout or false
- ■move.
Volume Profile
- ■Volume has been rising steadily over the last 3–4 weeks, supporting
- ■accumulation theory.
- ■The latest breakout candle saw volume expansion — indicative of smart money
- ■involvement.
- ■Sustained volume above 200K+ weekly will validate bullish breakout
- ■conviction.
Key Levels
Invalidation Scenario
A weekly close back below ₹700 would invalidate the breakout setup and signal a potential return into the channel range, resuming the long-term downtrend.
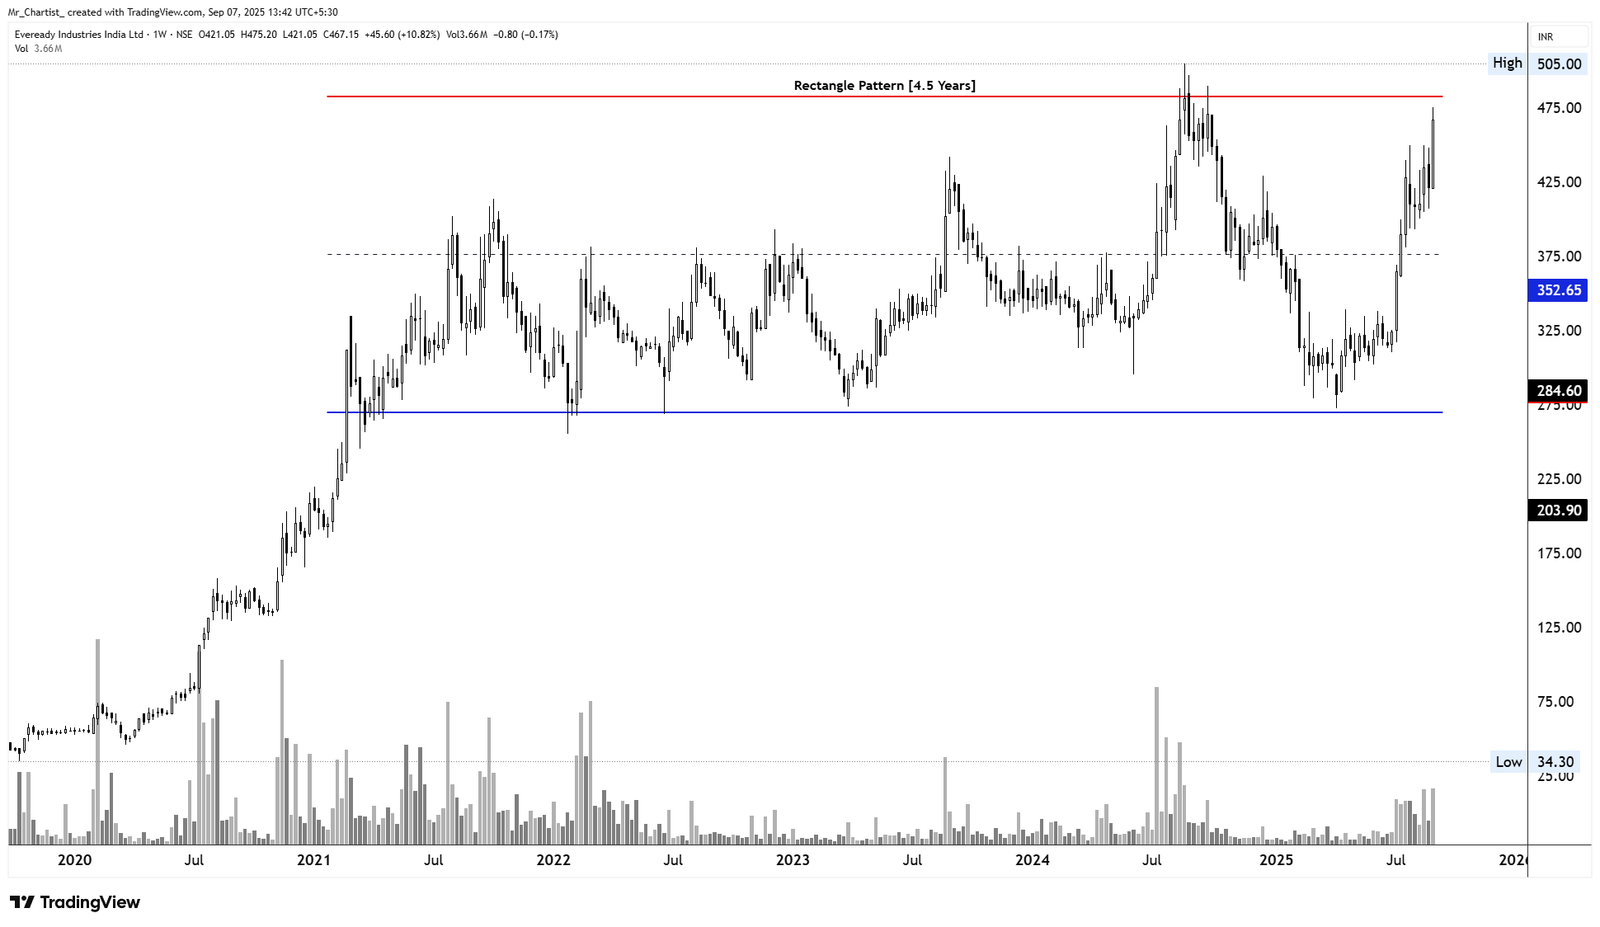
Eveready Industries India Ltd. (EVEREADY)
cash bullishRectangle Pattern (Range-Bound Structure)
4.5 Years (Weekly Chart – Multi-Year Consolidation with Imminent
Thesis & Analysis
Breakout Potential) Eveready has been locked in a broad rectangle pattern for the last 4.5 years, oscillating between ₹285 (support) and ₹485 (resistance). This long consolidation signifies accumulation within a range, with clear boundaries respected by price. Recently, the price has surged back toward the upper resistance zone, testing the critical ₹475–₹485 barrier with strong bullish momentum.
Price Action
- ■Recent weekly candles show long-bodied bullish moves with higher closes.
- ■Price has tested the resistance multiple times without major rejection —
- ■indicating exhaustion of sellers at the top end.
- ■Clean structure with tight price compression — suggests volatility expansion
- ■ahead.
Volume Profile
- ■Noticeable volume increase during the current up-leg, which is crucial in
- ■confirming accumulation.
- ■Past breakout attempts lacked volume — current breakout attempt is more
- ■credible.
- ■Sustained weekly volume above 5M+ would signal institutional accumulation
- ■and trend confirmation.
Key Levels
Invalidation Scenario
Breakdown below ₹352 (mid-range) with high volume would invalidate the bullish setup and indicate return to the lower half of the range. Breakdown below ₹285 would negate the rectangle and trigger bearish trend continuation.
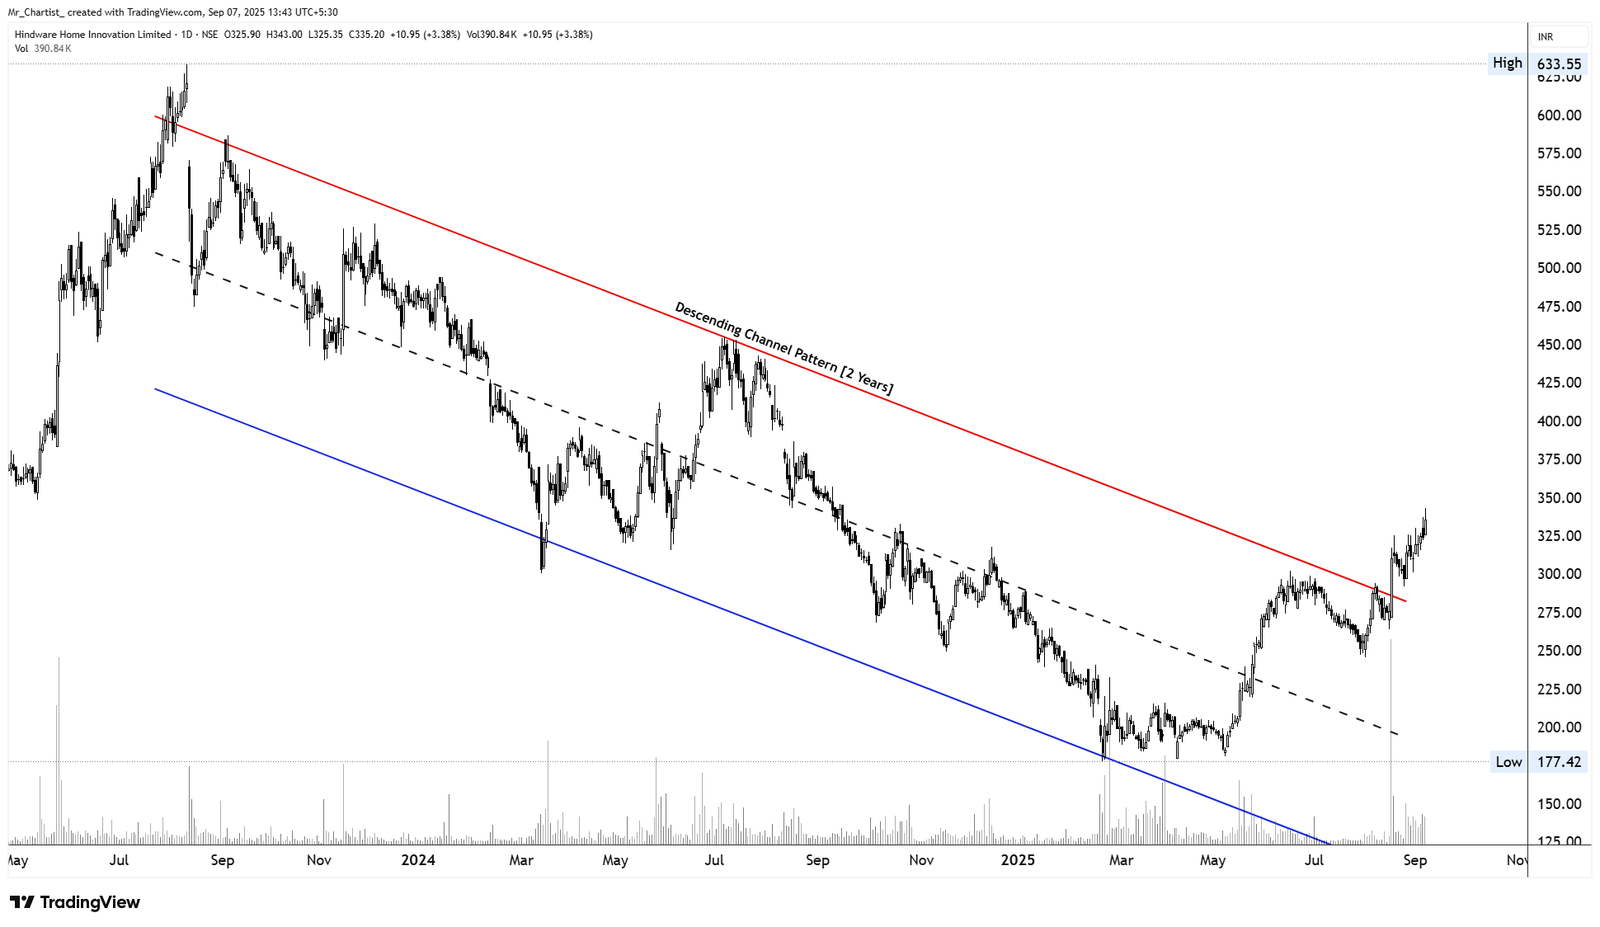
Hindware Home Innovation Ltd. (HINDWAREAP)
cash bullishDescending Channel Pattern (Breakout Confirmed)
2 Years (Daily Chart – Long-Term Downtrend with Fresh Bullish
Thesis & Analysis
Breakout) Hindware has been in a 2-year-long descending channel, consistently printing lower highs and lower lows. This pattern illustrated a structured downtrend, respected by both upper and lower trendlines. However, a powerful bullish breakout has occurred recently, as price pierced through the upper boundary of the channel with strong momentum. This breakout marks a trend reversal and hints at a shift from distribution to accumulation.
Price Action
- ■A sequence of bullish candles with expanding range and higher highs.
- ■Post-breakout price action is holding above the breakout zone (~₹300–₹310)
- ■— suggesting healthy follow-through.
- ■No signs of exhaustion yet; bulls are in control.
Volume Profile
- ■Clear volume expansion during the breakout phase, signaling institutional
- ■interest.
- ■Sustained activity post-breakout with volume levels consistently above
- ■average.
- ■Volume confirmation adds credibility to the breakout and reduces the chance
- ■of a fakeout.
Key Levels
Invalidation Scenario
Breakdown and close below ₹275 with volume would invalidate the bullish bias. Such a move would place the stock back within the prior bearish zone and indicate false breakout risks.
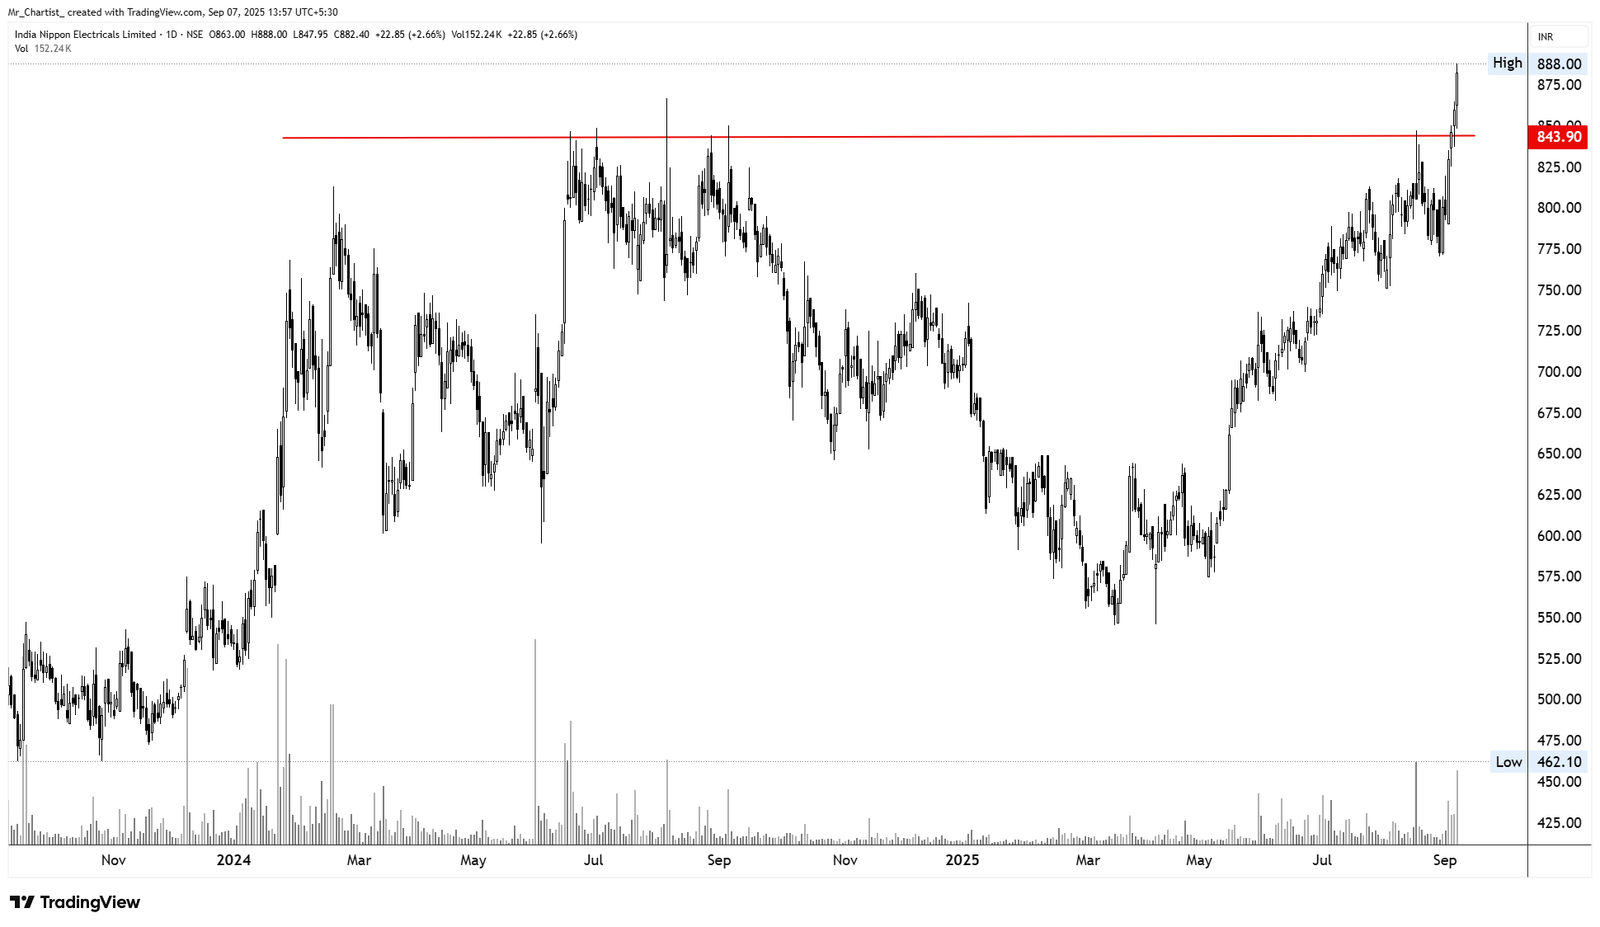
India Nippon Electricals Ltd. (INDNIPPON)
cash bullishCurve Base (Cup-like Accumulation) at All-Time High
11 Months (Daily Chart – Long-Term Accumulation Followed
Thesis & Analysis
by Breakout) INDNIPPON has formed a curve base (rounded cup-like structure) just below its all-time high zone (~₹840–₹845). The stock consolidated in a wide, constructive manner for nearly 11 months, gradually building higher lows and showing resilience through corrections. Recently, the stock has broken out above the previous all-time high (~₹843.90) with strong volume and bullish candlestick formations, marking a significant shift from accumulation to markup phase.
Price Action
- ■Series of large-bodied bullish candles, with breakaway structure.
- ■Strong follow-through post-breakout with minimal wicks — signs of
- ■demand dominance.
- ■Price is sustaining above the previous ATH, confirming strength and
- ■breakout validation.
Volume Profile
- ■Noticeable volume expansion on breakout — well above the 20-day
- ■average.
- ■Volume confirms institutional activity behind the move.
- ■Sustained delivery-based buying seen during the breakout week.
Key Levels
No zones specified
Invalidation Scenario
Breakdown below ₹795 with high volume would indicate failed breakout and push stock back into the previous structure. In such case, expect reversion to ₹740–₹750 zone.
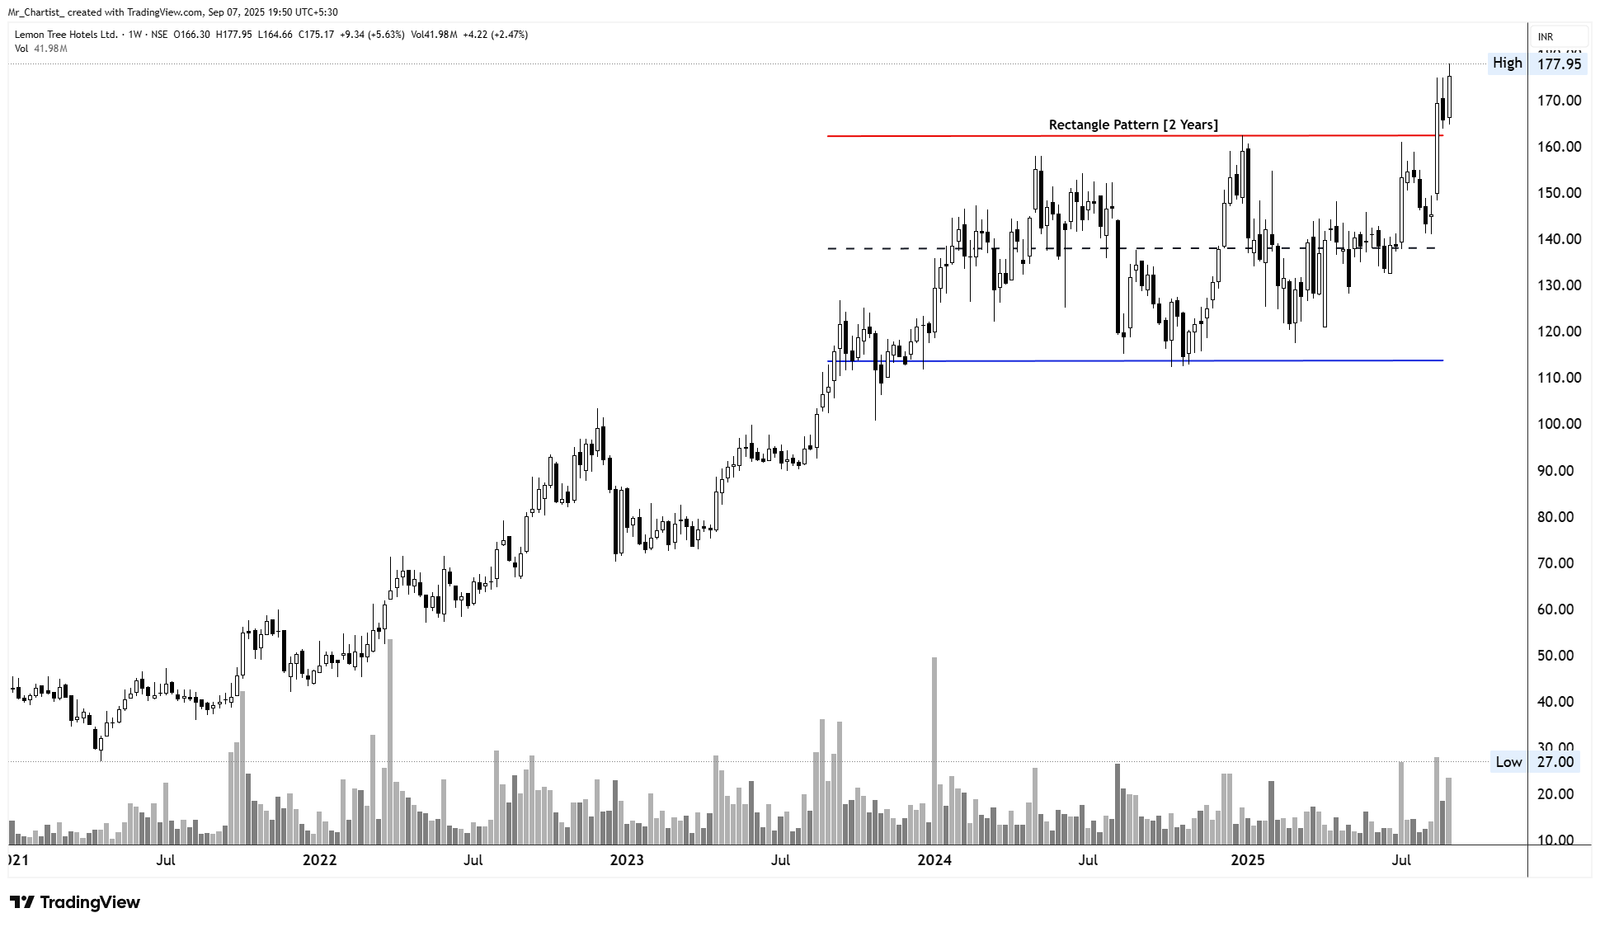
Lemon Tree Hotels Ltd. (LEMONTREE)
cash bullishRectangle Pattern (Consolidation Breakout)
2 Years (Weekly Chart – Long-Term Bullish Breakout)
Thesis & Analysis
LEMONTREE has successfully broken out of a well-formed Rectangle Pattern that developed over a span of 2 years. This pattern marks a broad consolidation range between ₹115–₹165 after a long uptrend, often indicating accumulation before continuation. The structure reflects investor indecision that now appears resolved in favor of bulls. The recent decisive breakout above ₹165 (rectangle resistance) was accompanied by strong price momentum and bullish candle structures, marking a multi-year breakout with bullish implications.
Price Action
- ■The breakout occurred via a bullish wide-range candle, suggesting strong
- ■demand.
- ■Follow-up candle has minimal upper shadow — little sign of supply pressure.
- ■Price is sustaining above the breakout level, confirming breakout validation.
Volume Profile
- ■Breakout candle had a sharp volume spike (~41.9M) – among the highest in
- ■recent quarters.
- ■Volume behavior during consolidation was stable and declining, indicating low
- ■volatility accumulation.
- ■Current volume behavior suggests institutional participation on breakout.
Key Levels
Invalidation Scenario
Weekly close below ₹150 would negate the breakout signal and reintroduce range-bound or bearish bias. Breakdown below ₹115 would imply complete pattern failure and broader trend risk.
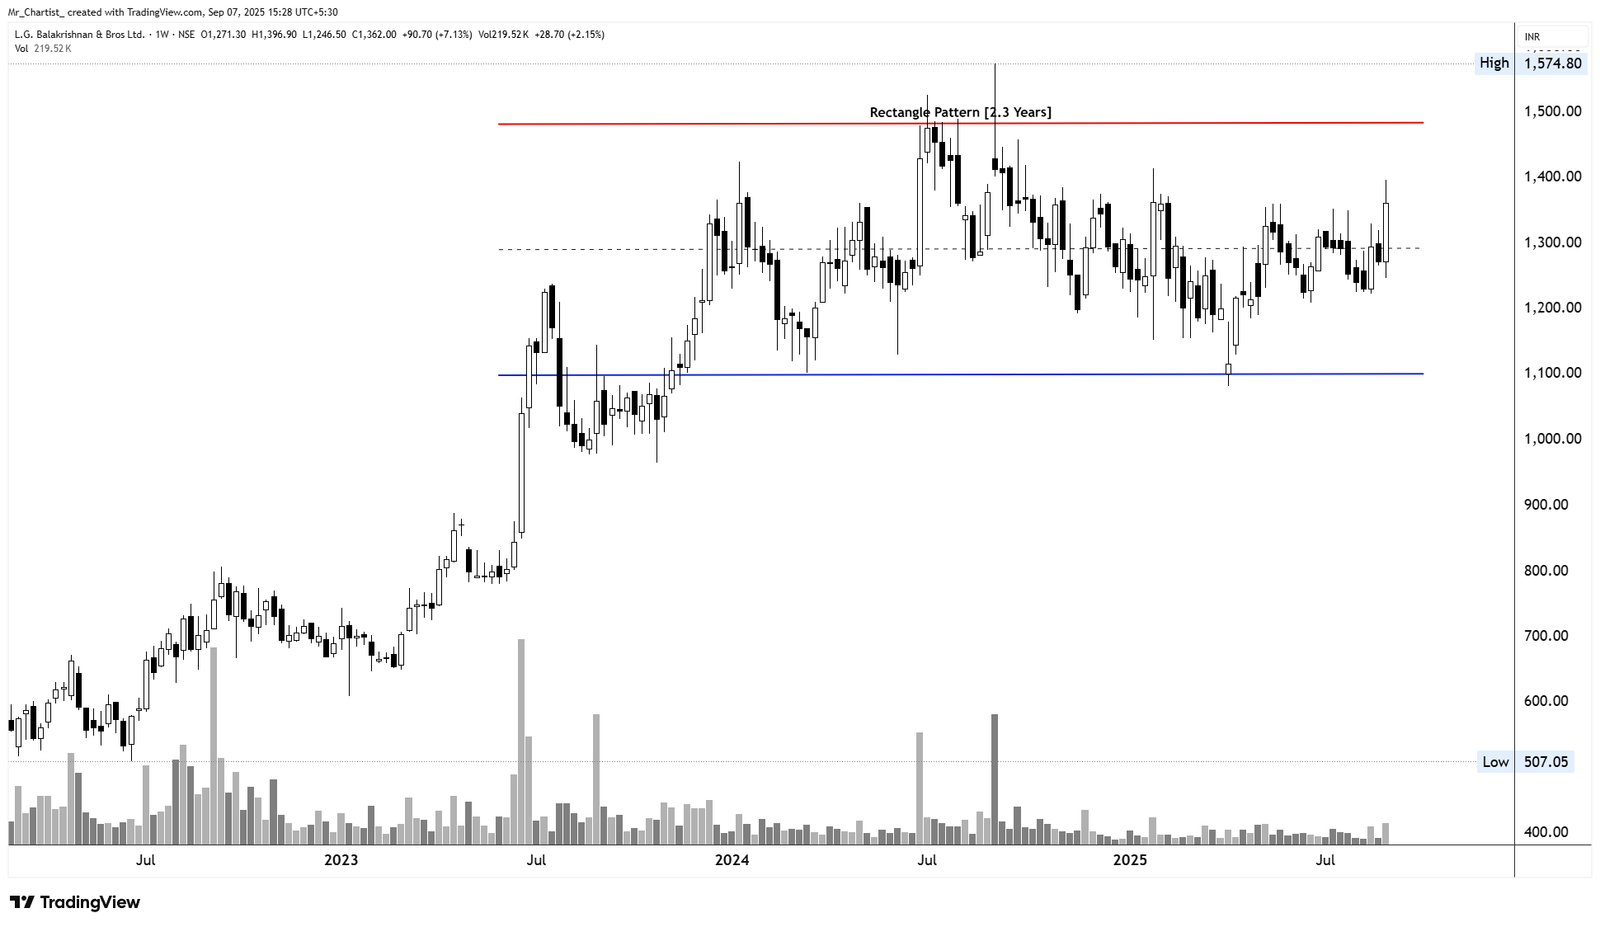
L.G. Balakrishnan & Bros Ltd. (LGBBROSLTD)
cash bullishRectangle Pattern (Consolidation Structure)
2.3 Years (Weekly Chart – Long-Term Accumulation Phase)
Thesis & Analysis
LGBBROSLTD has been consolidating within a broad Rectangle Pattern for over 2.3 years, ranging between ~₹1,100 and ~₹1,500. This extended range suggests a long-term base-building phase, where the stock is oscillating between a defined support and resistance level, absorbing supply and preparing for a potential breakout. The current candle has shown a strong bullish breakout attempt from the mid- range, accompanied by notable price momentum and volume, hinting at an early push toward the upper boundary.
Price Action
- ■Recent weekly candle shows a bullish wide-range body with strong momentum
- ■from ₹1,270 to ₹1,396.
- ■Little upper wick signifies aggressive buying into resistance.
- ■Price is nearing the upper boundary (~₹1,500) of the rectangle — a decisive
- ■breakout above this level would signal a structural shift toward a bullish
- ■continuation.
Volume Profile
- ■Volume surged to ~219.5K, one of the highest weekly spikes in recent months.
- ■Historical volume within the rectangle has been relatively subdued — this
- ■sudden surge may indicate accumulation breakout preparation.
- ■Volume confirmation is essential if price attempts a breakout above ₹1,500 —
- ■sustained volume >250K will strengthen conviction.
Key Levels
Invalidation Scenario
A weekly close below ₹1,250 would negate near-term bullish setup and suggest continuation of range. Breakdown below ₹1,100 would invalidate the rectangle structure and shift outlook to bearish.
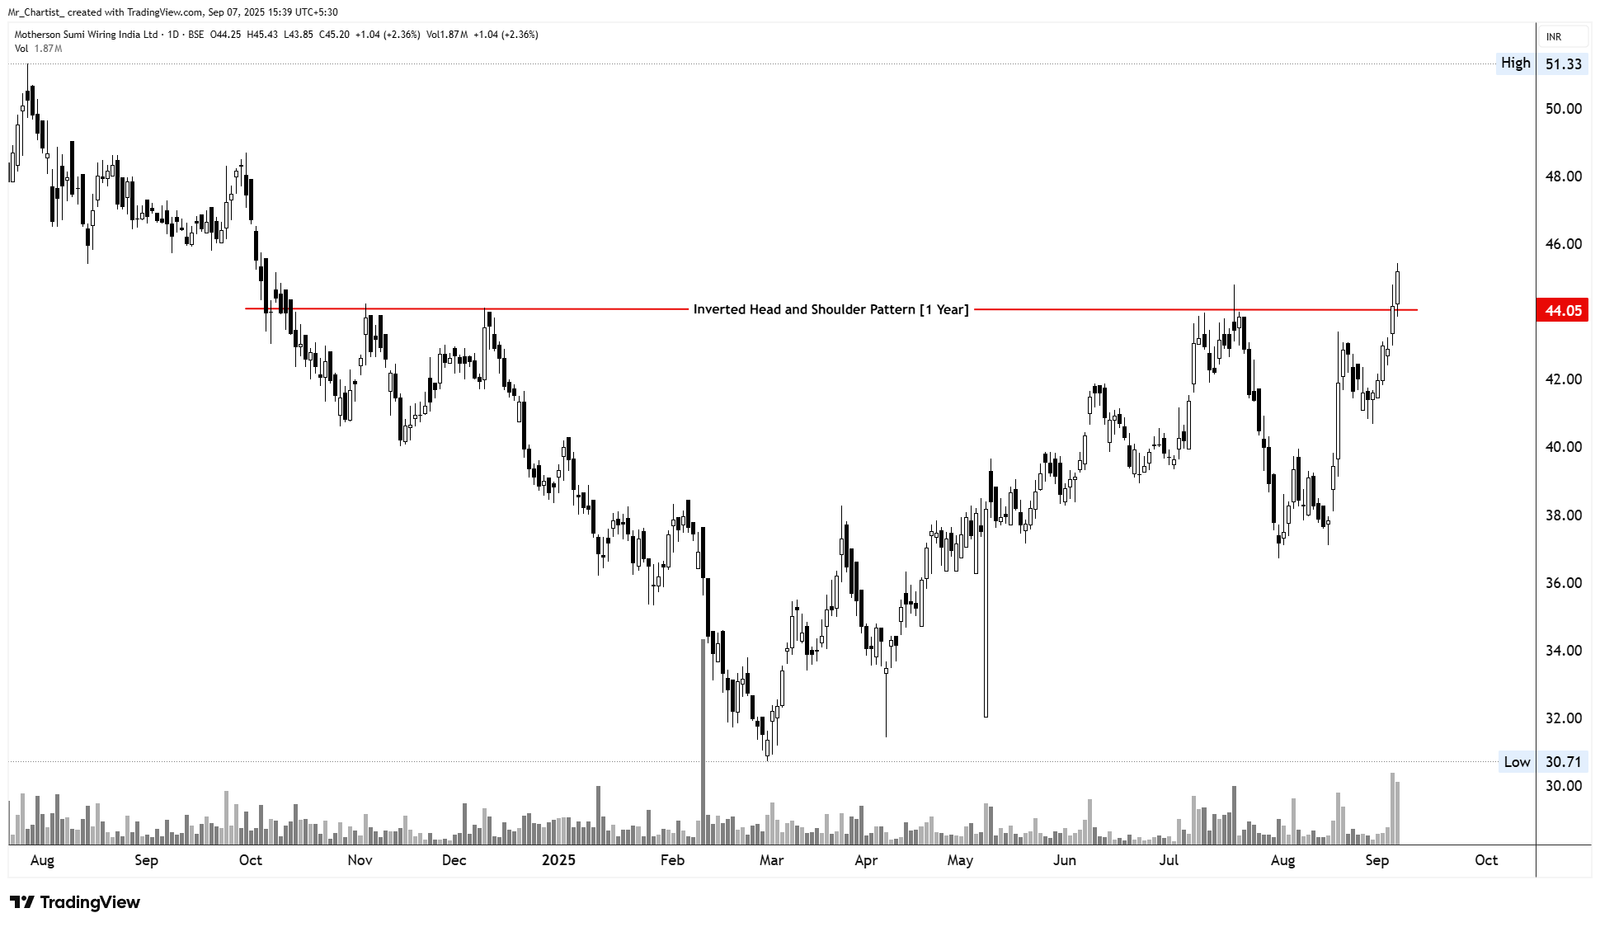
Motherson Sumi Wiring India Ltd. (MSUMI)
cash bullishInverted Head & Shoulders Pattern
1 Year (Daily Chart – Bullish Reversal Structure)
Thesis & Analysis
MSUMI has been forming a classic Inverted Head and Shoulders pattern over the past year, signaling a strong potential trend reversal from bearish to bullish. The left shoulder, head, and right shoulder are clearly visible, forming after a prolonged downtrend, making this setup more reliable. The neckline resistance near ₹44.05 has recently been breached with a strong bullish candle and surge in volume, confirming the breakout.
Price Action
- ■A powerful bullish candle on breakout day, closing well above the neckline.
- ■The right shoulder formed a strong bullish base between ₹40–₹42, showing
- ■accumulation before breakout.
- ■Recent price action is supported by higher highs and higher lows, indicating
- ■strengthening momentum post-breakout.
Volume Profile
- ■Volume surged to 1.87M shares, a multi-month high, precisely on the
- ■breakout — classic volume confirmation.
- ■Accumulation was visible during the head formation (~₹34–₹36), while recent
- ■candles showed decreasing volume on pullbacks and increasing volume on up
- ■days — a bullish volume-price relationship.
Key Levels
Invalidation Scenario
A daily close below ₹42.00 would weaken bullish momentum and risk pattern failure. A close below ₹40.00 would fully invalidate the pattern and suggest further downside.
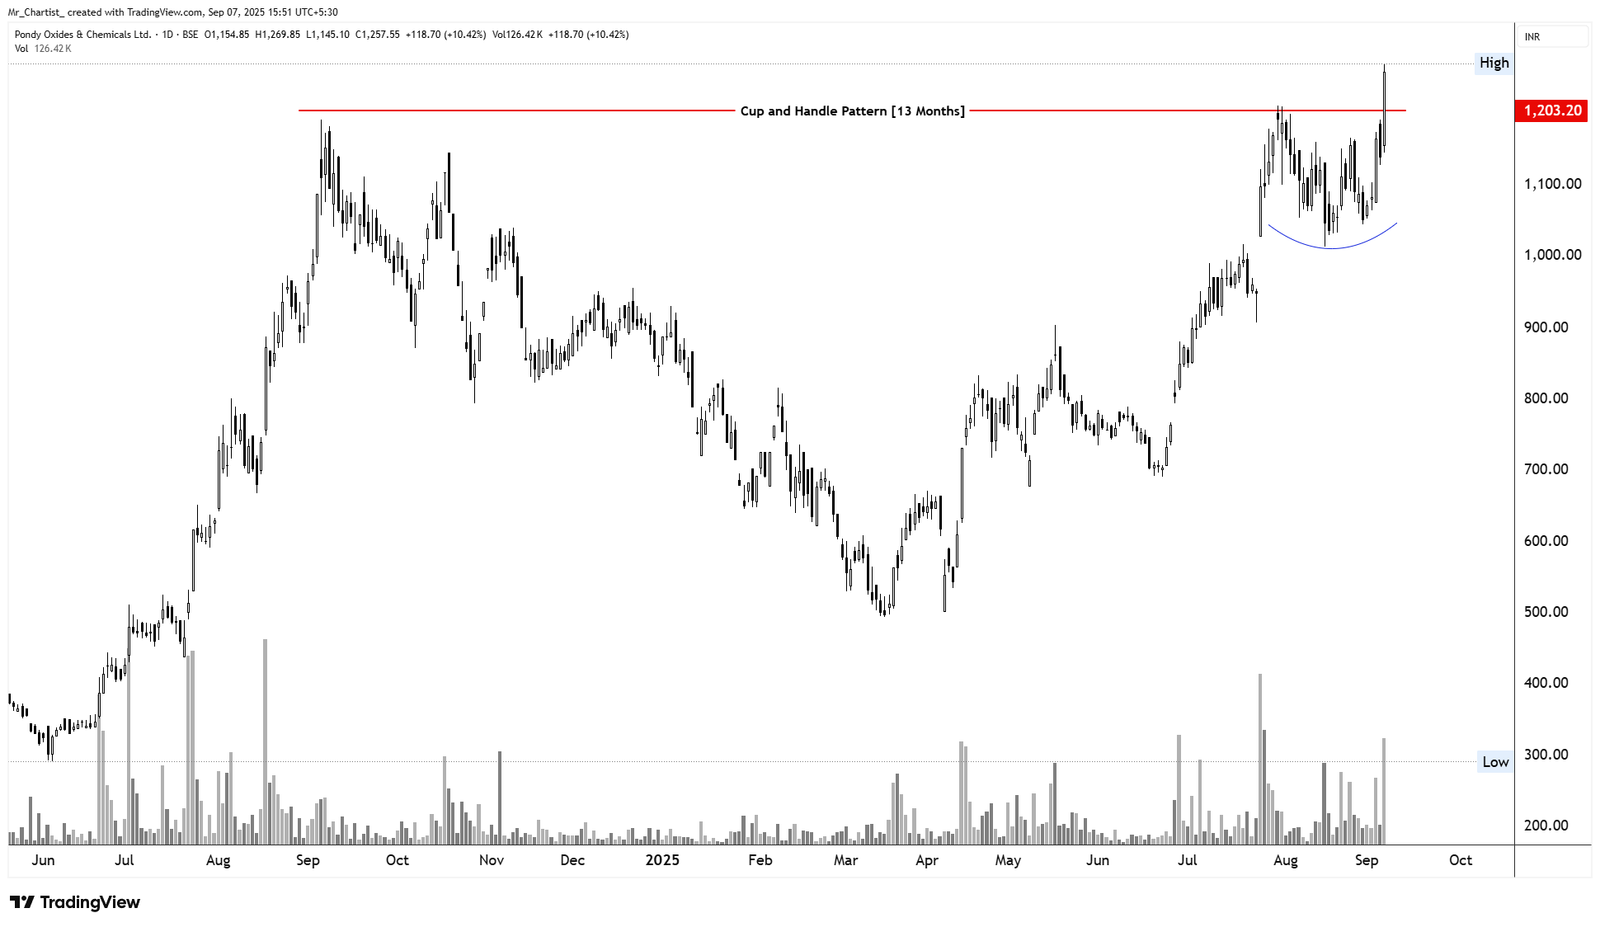
Pondy Oxides & Chemicals Ltd. (POCL)
cash bullishCup and Handle Pattern
13 Months (Daily Chart – Bullish Continuation)
Thesis & Analysis
POCL has broken out of a 13-month long Cup and Handle pattern, a highly reliable bullish continuation setup. The structure formed after a strong prior uptrend (mid-2023), followed by a rounded consolidation forming the "cup", and a brief downward drift creating the "handle". The breakout has occurred with strong volume and a wide bullish candle, indicating renewed momentum and bullish conviction.
Price Action
- ■A wide-range bullish candle closed decisively above the ₹1,203 neckline,
- ■confirming the breakout.
- ■The handle formed a mild downward-sloping channel (~₹1,100–₹1,050),
- ■showing a healthy pullback before breakout.
- ■The recent candle broke out with minimal upper wick — clear buying pressure
- ■and strength.
Volume Profile
- ■Volume was relatively low during handle formation (expected), but surged to
- ■126.4K on the breakout day — classic behavior for this pattern.
- ■Historical spikes in volume align with key rally points (bottom of cup, pre-
- ■breakout handle bounce), suggesting accumulation at support.
Key Levels
Invalidation Scenario
A daily close below ₹1,100 would invalidate the breakout and indicate failure of the handle support. A break below ₹980 would signal potential bearish reversal and exit from long bias.
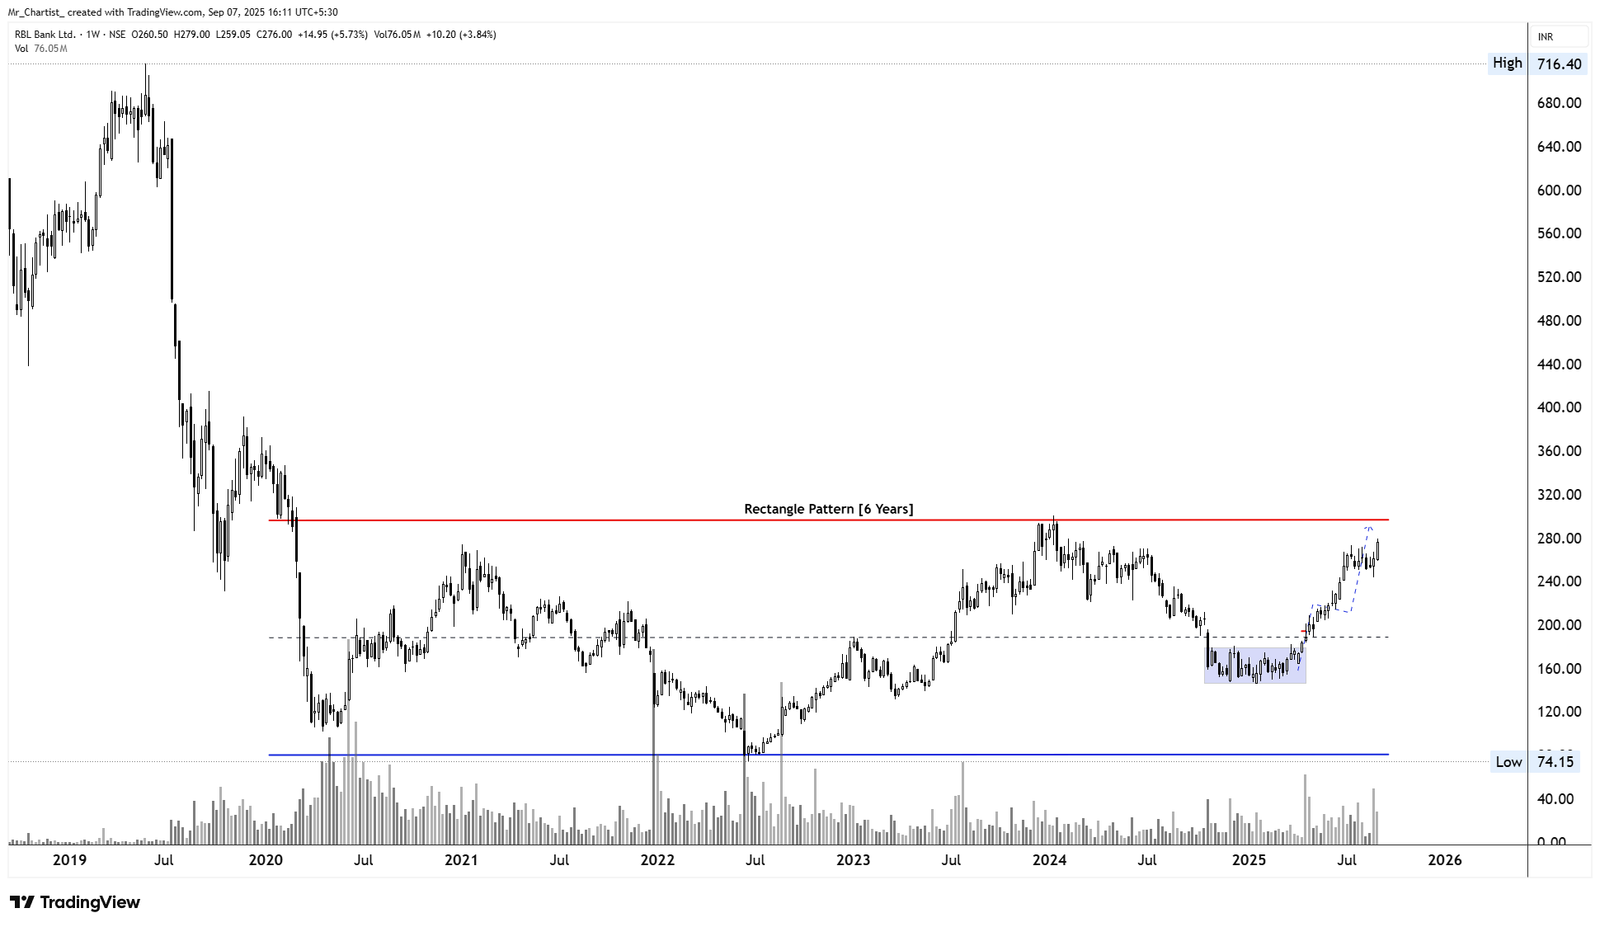
RBL Bank Ltd. (RBLBANK)
cash bullishRectangle Pattern
6 Years (Weekly Chart – Long-Term Accumulation Zone)
Thesis & Analysis
RBL Bank is currently trading near the upper resistance boundary of a massive 6- year Rectangle Pattern, which has been forming since mid-2019. This structure suggests a long-term base formation following a steep downtrend (from ₹716 to ₹74), and is now gearing up for a potential multi-year breakout. The recent strong rally from the ₹160 base zone (marked by the mini base or rounded box) shows momentum strength, with a parabolic rise heading into the breakout zone at ~₹292.
Price Action
- ■Strong weekly bullish candles over the past several weeks with minimal upper
- ■wicks — signals persistent demand.
- ■Breakout attempt candles are pressing against horizontal resistance with
- ■increasing bullish pressure.
- ■Mild price compression is visible just under resistance — a positive sign of
- ■strength.
Volume Profile
- ■Volume surged during the rally from the ₹160–₹170 consolidation base —
- ■indicating institutional buying.
- ■Volume has remained elevated, even during pullbacks — supporting a
- ■sustained move.
- ■A decisive volume breakout (>100M) on weekly close above ₹292 would
- ■confirm long-term breakout.
Key Levels
Invalidation Scenario
A weekly close below ₹248 would weaken the bullish setup and suggest loss of breakout momentum. A drop back toward ₹200 without strong buying support could extend consolidation further.
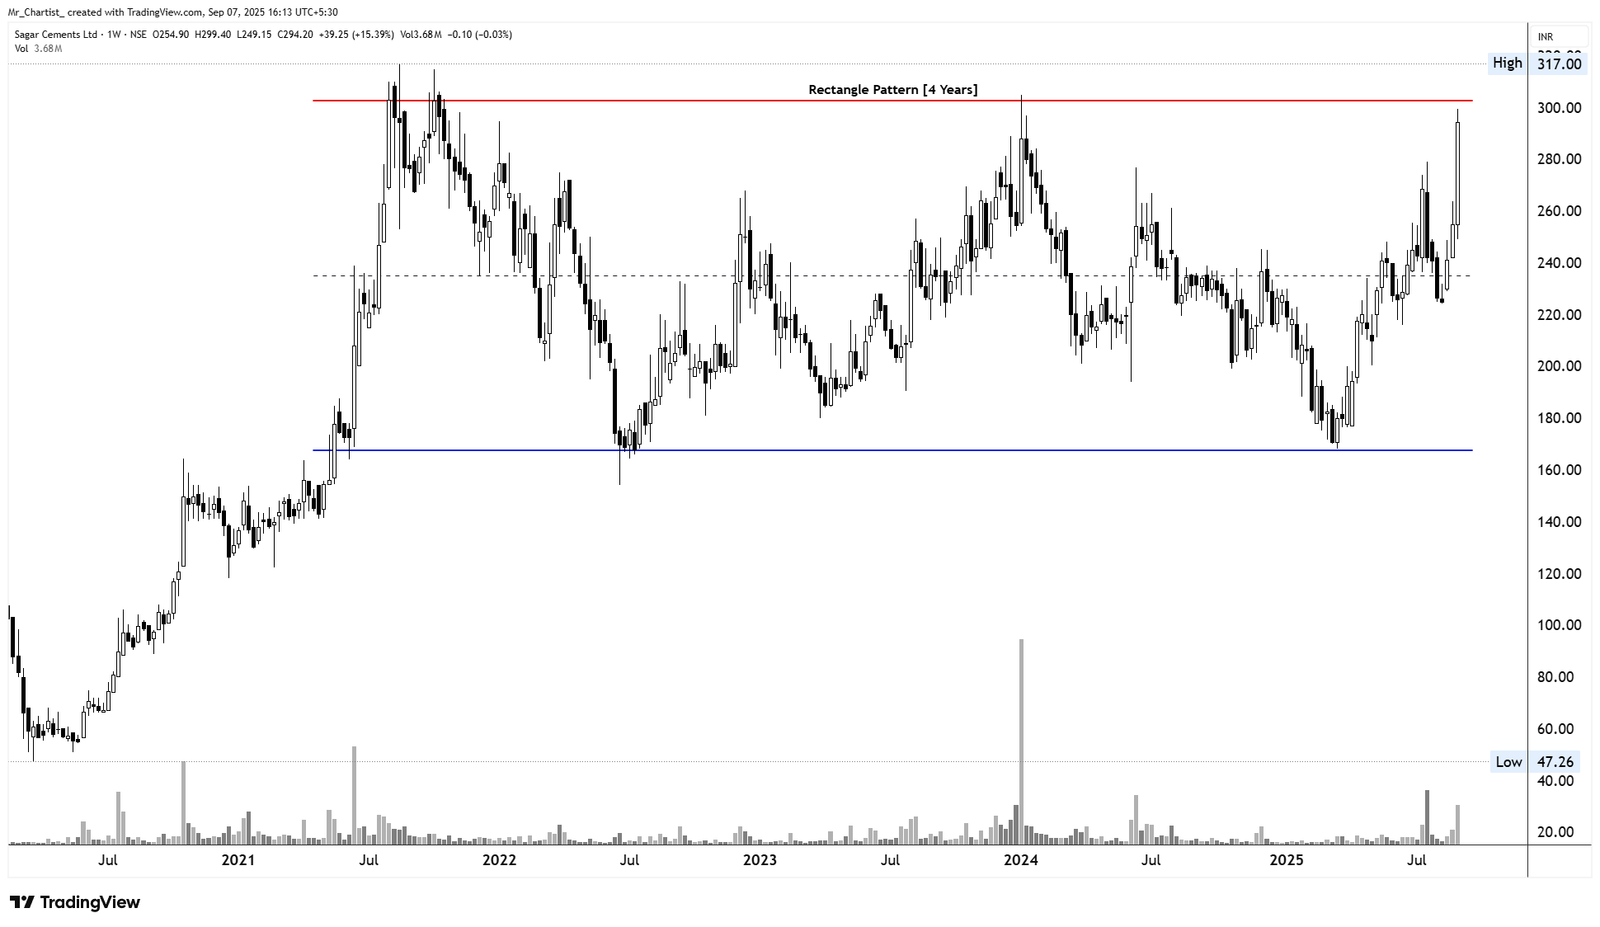
Sagar Cements Ltd. (SAGCEM)
cash bullishRectangle Pattern
4 Years (Weekly Chart – Long-Term Accumulation & Compression)
Thesis & Analysis
Sagar Cements is nearing a critical horizontal resistance breakout after trading in a broad Rectangle Pattern for the last 4 years. This long consolidation between ₹165 and ₹315 has absorbed significant supply, and price is now testing the upper range again with strong momentum. This prolonged sideways accumulation often precedes major directional moves. Given the prior uptrend into the rectangle (2020–2021), this could mark a continuation breakout, resuming the bullish trend.
Price Action
- ■Recent bullish wide-range candles signal breakout attempt with conviction.
- ■Price has made a V-shaped recovery from the bottom of the rectangle and is
- ■now pressing against the upper boundary (~₹315).
- ■Minor upper wicks are present, but strong body closes suggest buyers are
- ■absorbing selling pressure.
Volume Profile
- ■Volume spikes seen on recent green candles show renewed interest.
- ■Past false breakouts lacked volume – current breakout has greater volume
- ■follow-through.
- ■A clean weekly close above ₹317 with 3M+ volume would confirm breakout
- ■strength.
Key Levels
Invalidation Scenario
A weekly close below ₹248 would reintroduce bearish range-bound bias. Breakdown below ₹225 would likely delay any major breakout attempts for the foreseeable future.
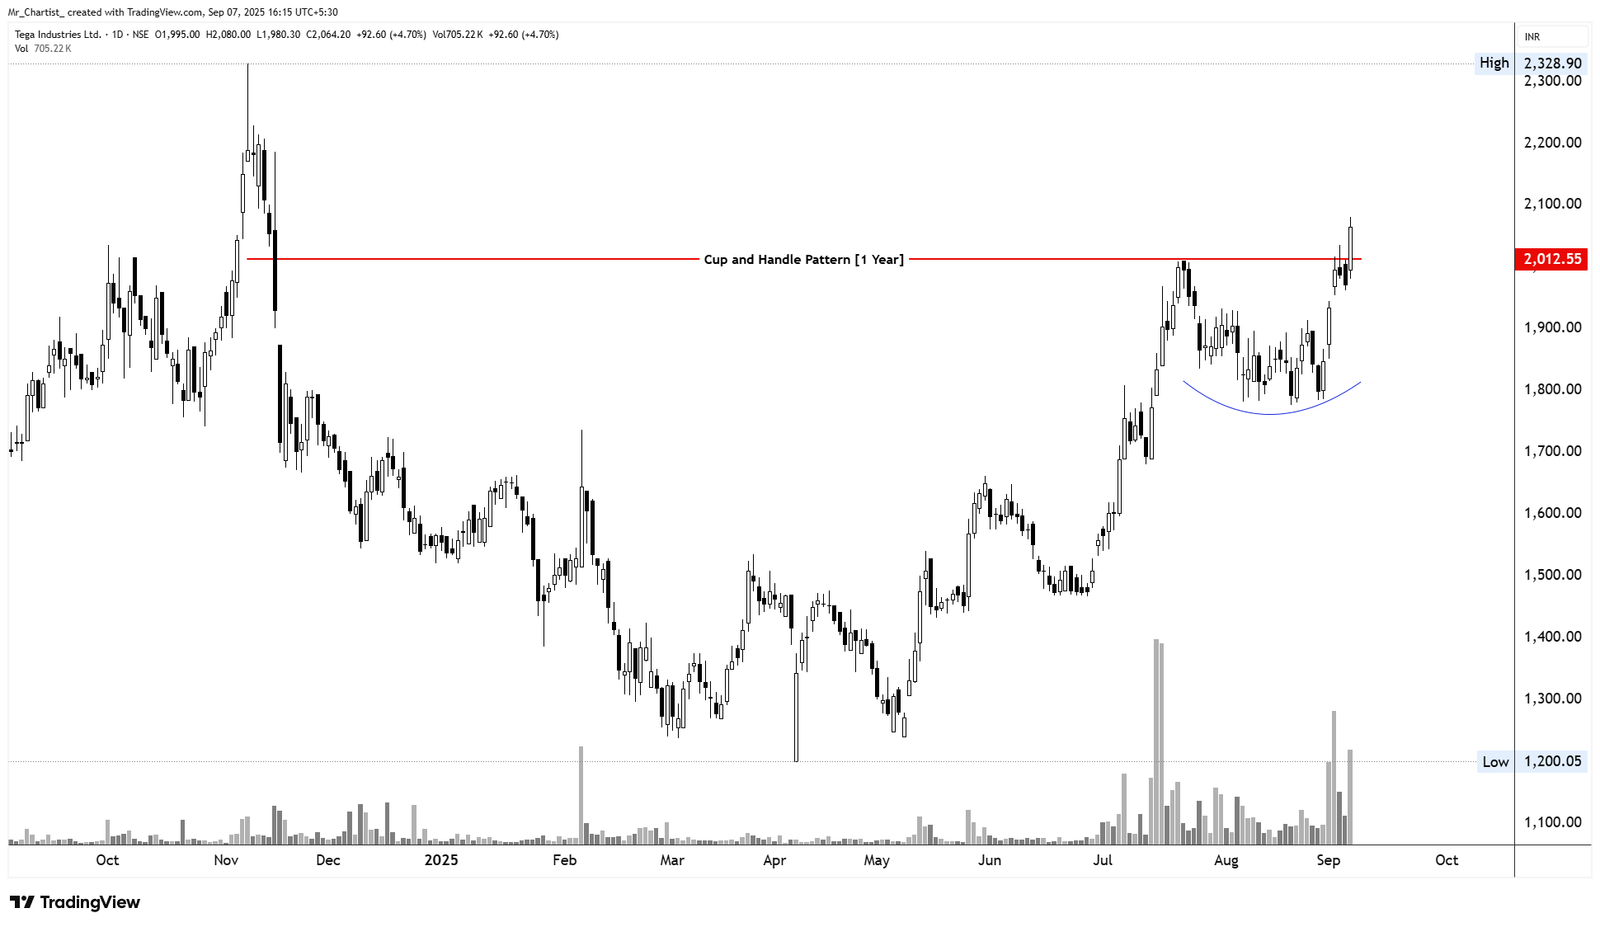
Tega Industries Ltd. (TEGA)
cash bullishCup and Handle
1 Year (Daily Chart – Bullish Continuation Structure)
Thesis & Analysis
Tega Industries has formed a textbook Cup and Handle pattern over the past year, a highly reliable bullish continuation pattern. The cup formation is broad and rounded, showing gradual recovery from its correction phase, while the handle is a mild dip on declining volume, suggesting temporary consolidation before breakout. The price has recently broken above the neckline (~₹2,012) with strong bullish candles and volume expansion, indicating potential resumption of the prior uptrend that began in mid-2023.
Price Action
- ■The breakout candle was wide-bodied with strong closing, overcoming prior
- ■resistance.
- ■Handle formation was well-formed, correcting just mildly before breakout —
- ■confirming pattern maturity.
- ■A few upper wicks post-breakout suggest some early profit-booking, but
- ■overall price structure remains intact.
Volume Profile
- ■Volume contracted during the handle phase, which is ideal for this pattern.
- ■Breakout was accompanied by sharp volume surge (~700K+ shares),
- ■confirming genuine demand.
- ■Sustained volume above average (>500K) post-breakout would support the
- ■bullish follow-through.
Key Levels
Invalidation Scenario
A daily close below ₹1,890 with volume would invalidate the handle breakout. Break below ₹1,700 negates the pattern entirely and brings structure into bearish pressure.
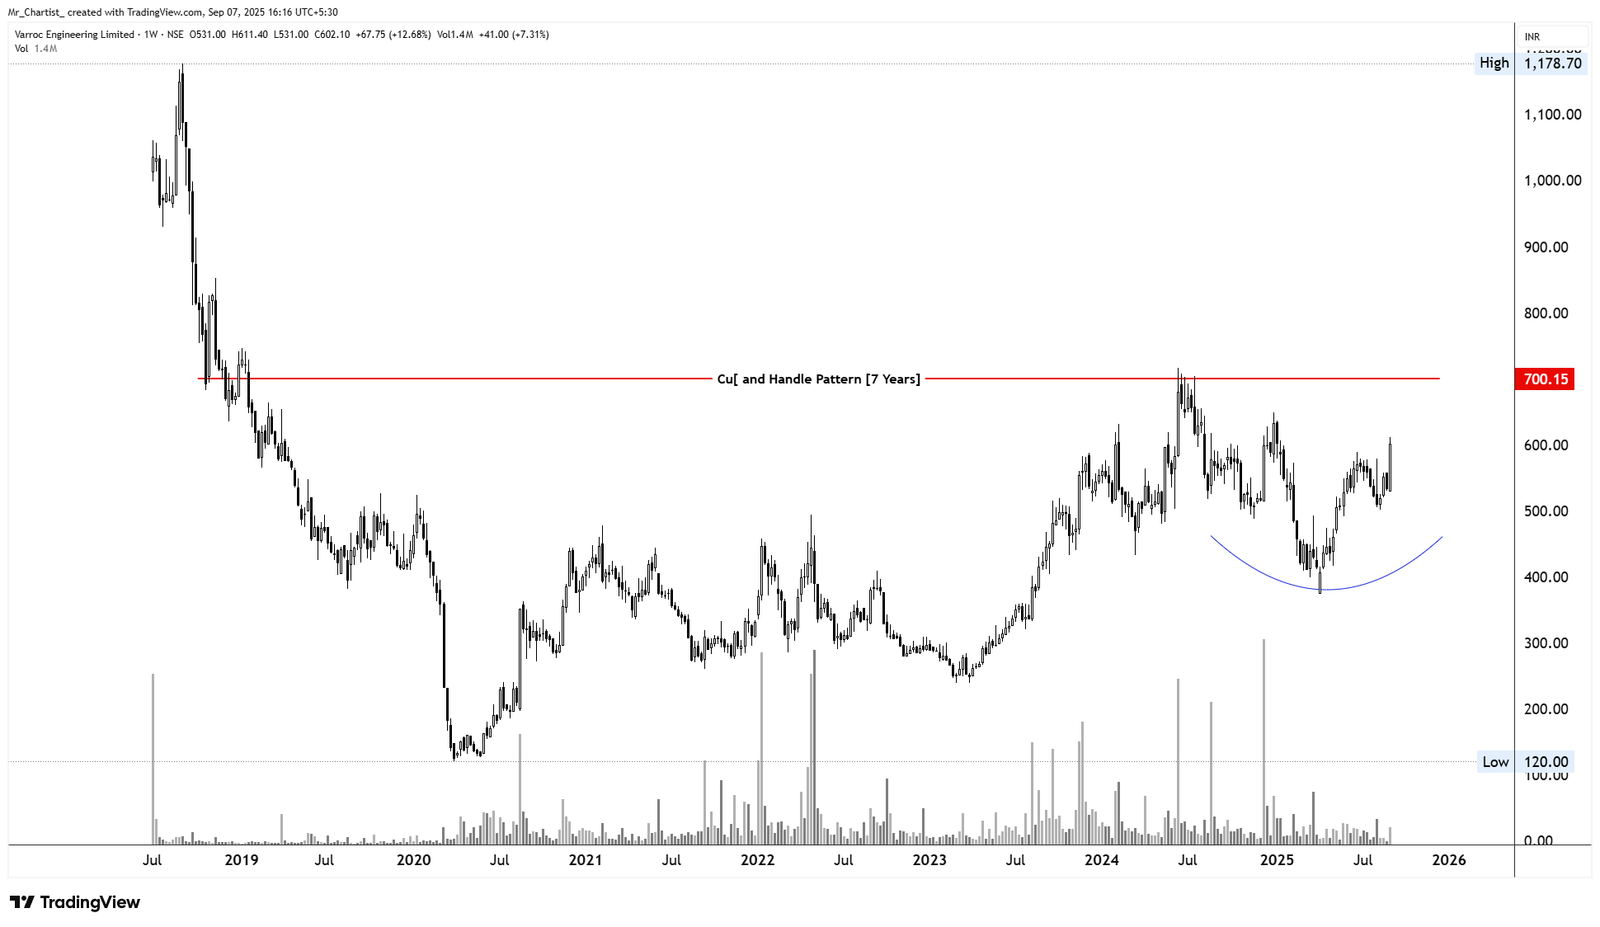
Varroc Engineering Ltd. (VARROC)
cash bullishCup and Handle
7 Years (Weekly Chart – Major Bullish Reversal)
Thesis & Analysis
Varroc Engineering is setting up a massive Cup and Handle pattern, forming over a span of 7 years, indicating significant long-term accumulation and potential structural trend reversal. The cup shows a deep, rounded bottom shaped over years of consolidation and recovery after a prolonged bear cycle since 2018. The handle has recently begun forming as a shallow pullback on lower volumes — a textbook setup. The neckline resistance at ₹700 is a long-standing supply zone. A weekly close above this level with high volume would confirm the breakout of this macro pattern — unleashing a potential multi-year bull run.
Price Action
- ■The current rally shows clean higher highs and higher lows structure.
- ■Last few weekly candles show rising momentum after bottoming around ₹420–
- ■₹440 zone.
- ■Price is approaching neckline with improving body sizes — a bullish sign of
- ■strength before breakout.
Volume Profile
- ■Volume surged during bottom formation (March–May 2024), indicating
- ■institutional interest.
- ■Current leg up is supported by moderate yet rising volume, suggesting healthy
- ■accumulation.
- ■Breakout requires a decisive weekly candle with volume >2M+ shares to
- ■confirm participation.
Key Levels
Invalidation Scenario
A weekly close below ₹505 would invalidate the handle setup and return price to consolidation. Failure to break above ₹700 with volume might lead to extended sideways action.
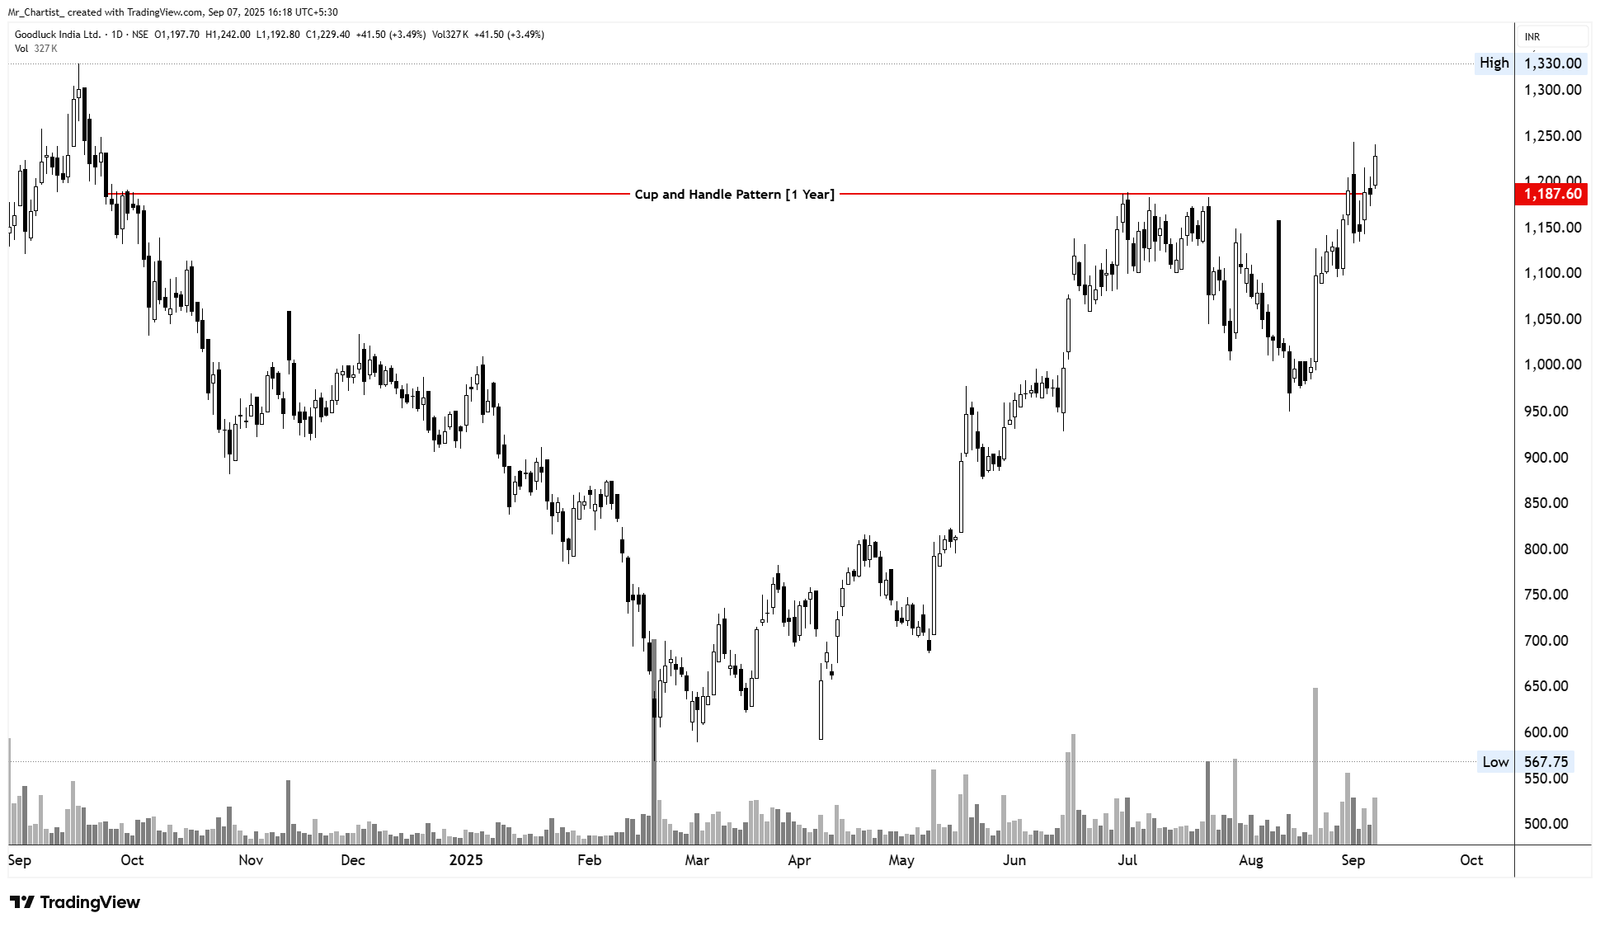
Goodluck India Ltd. (GOODLUCK)
cash bullishCup and Handle
1 Year (Daily Chart – Bullish Reversal Continuation)
Thesis & Analysis
Goodluck India has formed a classic Cup and Handle pattern over the past year, typically seen as a bullish continuation pattern. After a strong prior uptrend, the stock entered a corrective phase in late 2023, forming a smooth, rounded base (the cup). The handle developed as a shallow, low-volume pullback — indicating minimal distribution, which enhances the bullish setup. The neckline resistance was firmly placed at around ₹1,187, and the price has now decisively broken out above it with a surge in both volume and momentum.
Price Action
- ■Multiple bullish candles leading to breakout with rising body size — indicative
- ■of strong demand.
- ■Post-handle base (~₹1,050–₹1,080) acted as a springboard for the breakout.
- ■Recent breakout is supported by a wide-range bullish candle above the
- ■neckline — confirming strength.
Volume Profile
- ■Noticeable volume contraction during the handle — typical of a healthy
- ■pullback.
- ■Breakout candle on increased volume (~327K shares) validates buying
- ■participation.
- ■Sustained volume above 250K in follow-through sessions would further
- ■confirm breakout strength.
Key Levels
Invalidation Scenario
A close below ₹1,100 would negate the handle and potentially drag the stock back into consolidation. Weak volume follow-up could signal a false breakout — volume must sustain >250K to validate strength.
Micro & Penny Cap Opportunities
High-risk, high-reward micro and penny cap setups
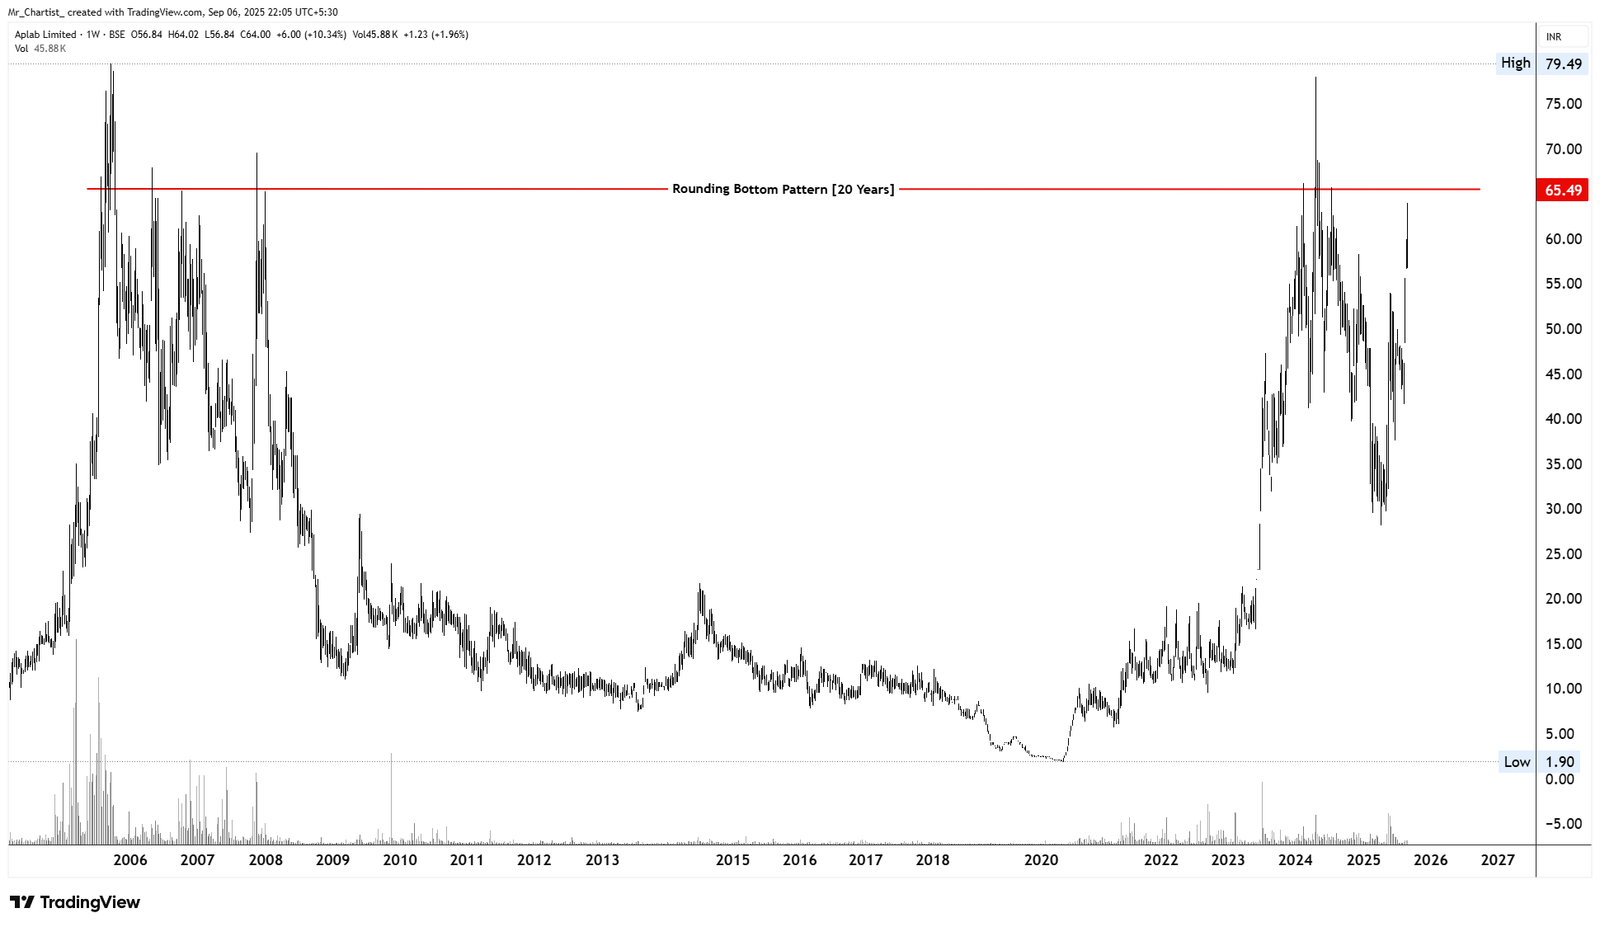
Aplab Ltd. (APLAB)
micro pennyRounding Bottom (Classic Accumulation Pattern)
~20 Years (Weekly Chart – Major Long-Term Reversal)
Thesis & Analysis
Aplab Ltd. is exhibiting a textbook Rounding Bottom formation — a pattern that typically signals a major long-term trend reversal after extended bear markets or stagnation periods. This pattern has developed over the past two decades, showing a multi-phase transition from distribution → deep decline → base building → breakout. The neckline resistance at ₹65.50 has been a major barrier historically, acting as a ceiling since 2006. Now, with price action testing and briefly moving above this level, a structural reversal could be underway.
Price Action
- ■Weekly bullish engulfing candle recently emerged near neckline.
- ■Price is consolidating just under breakout zone, forming a volatility
- ■contraction (tightening range).
- ■Recent attempts to break ₹65.50 have shown rejection, but the increasing
- ■frequency of tests signals strength.
Volume Profile
- ■Volume expansion is evident in the 2022–2025 upmove — reflecting
- ■accumulation after long dormancy.
- ■Volume spikes above 45K+ during rally phases indicate institutional interest.
- ■A breakout above ₹66 on volume >100K would confirm a high-conviction
- ■breakout.
Key Levels
Invalidation Scenario
A weekly close below ₹50 would invalidate the bullish setup and return the stock into consolidation. Lack of volume and false breakouts above ₹65 without follow-through would signal caution.
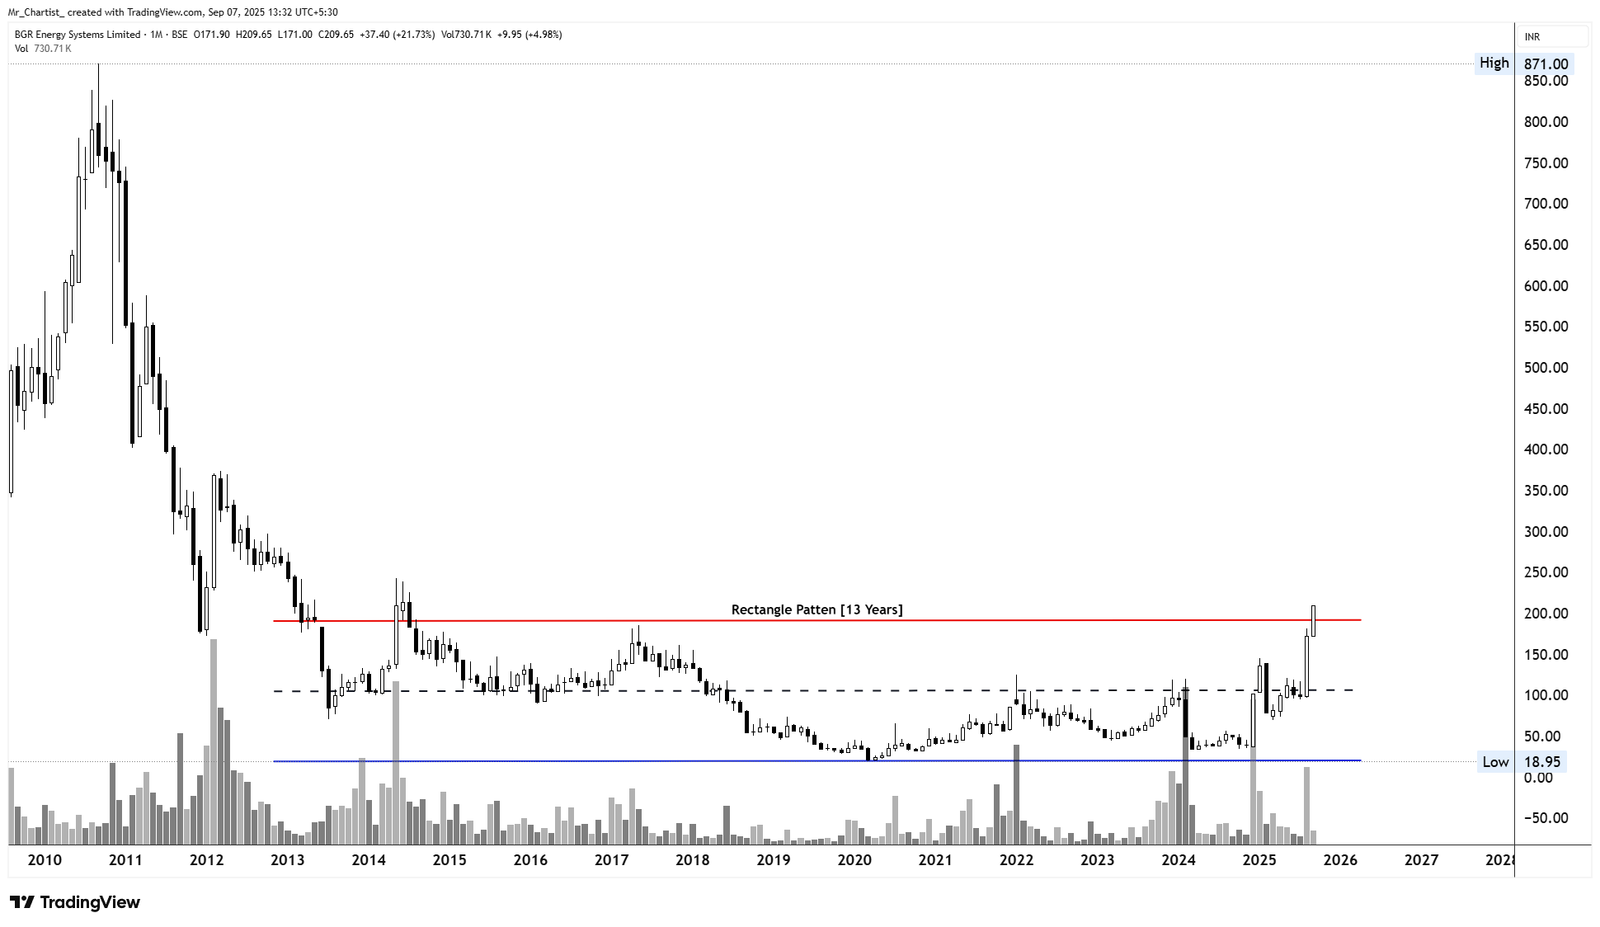
BGR Energy Systems Ltd. (BGRENERGY)
micro pennyRectangle Base (Range Accumulation Pattern)
~13 Years (Monthly Chart – Structural Breakout Attempt)
Thesis & Analysis
BGR Energy has been consolidating within a broad horizontal rectangle pattern between ~₹45 and ₹170 since 2012, effectively undergoing a 13-year-long sideways base formation. This extended base is often termed a “forgotten stock setup”, where prices stagnate for years, and a breakout often leads to a powerful trend — fueled by re- rating and long-term investor interest. The recent monthly breakout above ₹170–₹175 range signals a potential structural shift, possibly marking the beginning of a new bull phase if sustained.
Price Action
- ■Strong monthly candle broke above ₹170 after 13 years of resistance.
- ■Price currently consolidating just above breakout level — a retest may be
- ■healthy.
- ■Shadows above the breakout zone in the current candle indicate slight selling
- ■pressure — needs confirmation follow-through.
Volume Profile
- ■Massive volume surge during recent breakout — highest in years, indicating
- ■fresh accumulation.
- ■Prior volume spikes in 2021 & 2024 failed to push price above resistance —
- ■this time is different as price closed above resistance.
- ■Sustained volume above 500K/month will support the structural breakout.
Key Levels
Invalidation Scenario
A monthly close below ₹130 would signal failed breakout and reversion into the old range. Lack of volume support or prolonged rejection at ₹215–₹225 may slow upside momentum.
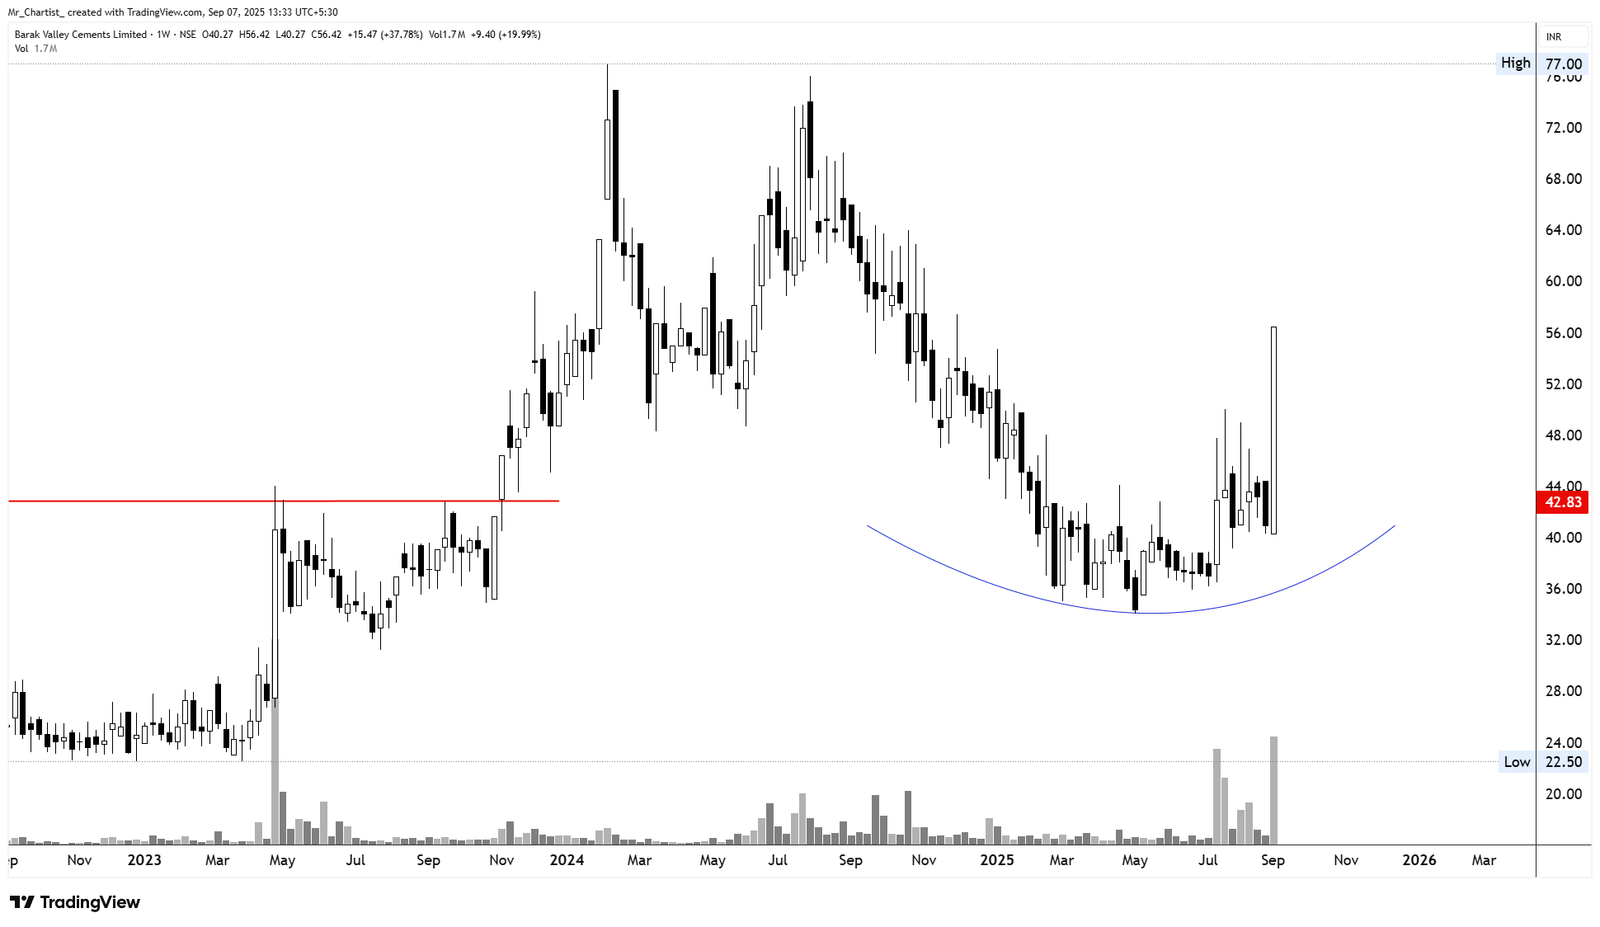
Barak Valley Cements Ltd. (BVCL)
micro pennyRounding Bottom (Cup Formation)
~15 Years (Long-term Weekly Chart)
Thesis & Analysis
Barak Valley Cements has formed a massive long-term rounding bottom pattern — a structure that began forming in 2008 and is finally transitioning from accumulation to markup phase. The neckline resistance near ₹43–₹45 was tested multiple times historically, finally giving way in recent sessions with a powerful breakout candle. This pattern, due to its size and duration, hints at potential for a major structural re-rating if follow-through buying sustains.
Price Action
- ■Recent explosive breakout candle with +37.78% weekly gain, engulfing prior
- ■weeks of consolidation.
- ■Clean breakout above ₹43–₹45 neckline with strong body close — confirming
- ■pattern activation.
- ■Prior handle formation (2024–2025) reflects healthy consolidation within cup
- ■pattern.
- ■Slight upper wick suggests minor profit-booking but body close is decisive.
Volume Profile
- ■Breakout accompanied by sharp volume spike (~1.7M) — strongest in months.
- ■Volume has steadily increased over the past few months during accumulation
- ■phase.
- ■Consistent bullish volume signature since mid-2023 — suggests smart money
- ■activity.
- ■Need follow-through volume confirmation over the next 1–2 weeks for
- ■structural validation.
Key Levels
Invalidation Scenario
Weekly close below ₹36 with high volume would invalidate breakout. Lack of volume follow-through above ₹60 may imply breakout exhaustion. Failure to hold ₹43–₹45 base would signal potential bull trap.
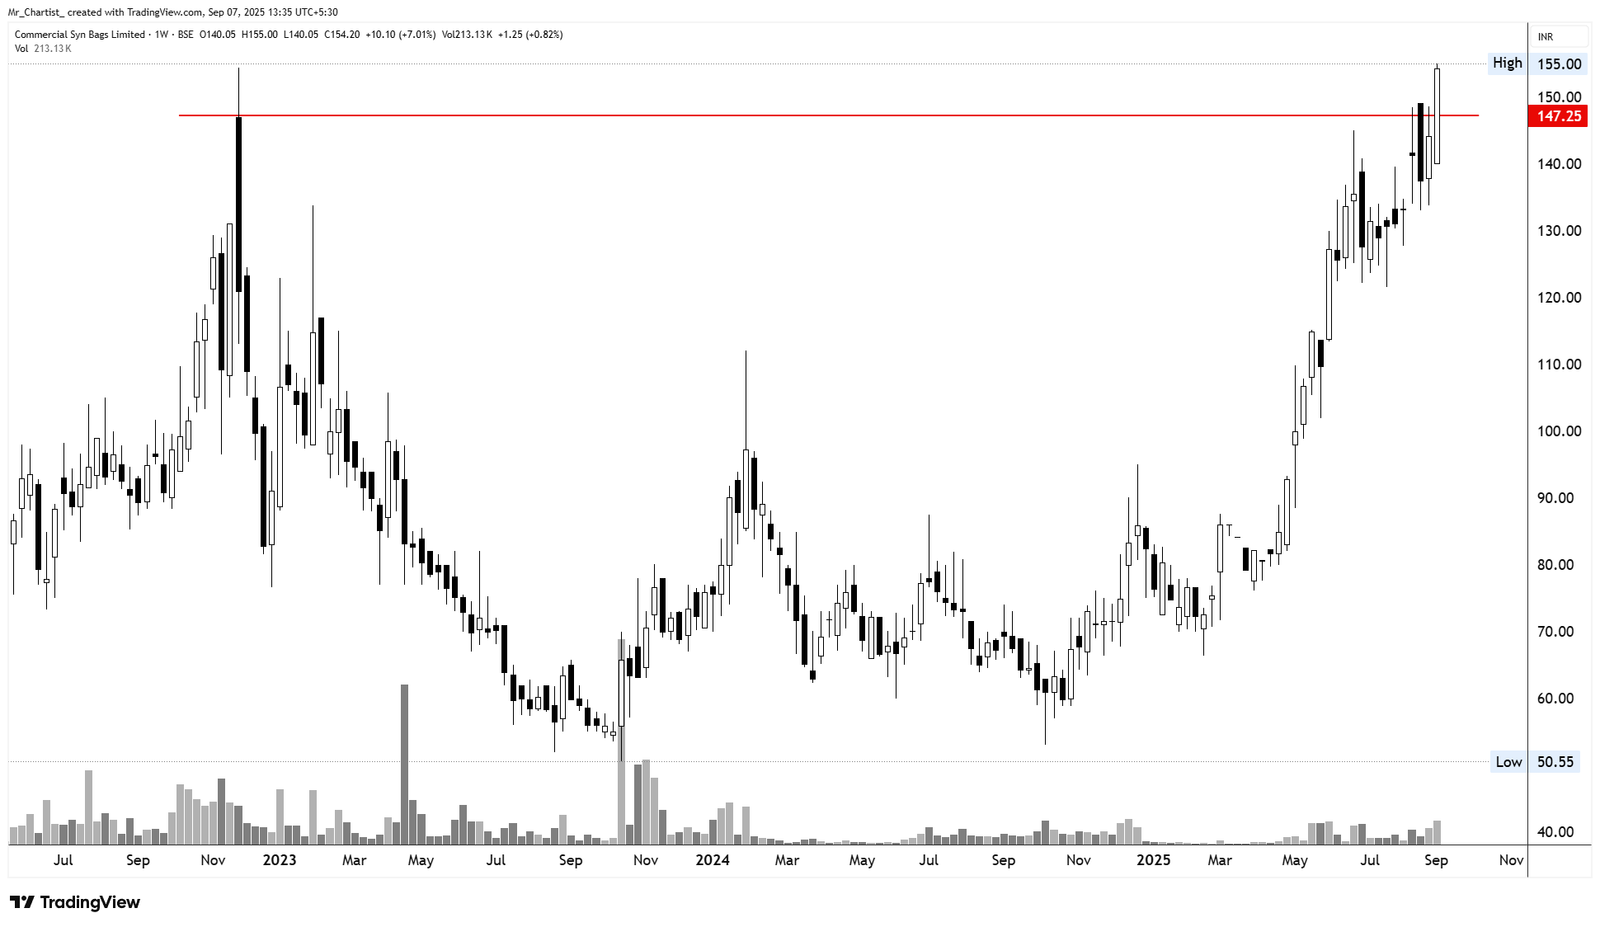
Commercial Syn Bags Ltd. (COMSYN)
micro pennyResistance Breakout (Flat Base)
~2 Years (Weekly Chart – Breakout Continuation)
Thesis & Analysis
Commercial Syn Bags has broken out above a crucial horizontal resistance near ₹147–₹150 that was tested multiple times since mid-2022. The stock formed a rounded accumulation base with flat top resistance — a structure often referred to as a "volatility contraction pattern (VCP)" or “flat base breakout”. This breakout follows a strong, steady uptrend from ₹50 levels, indicating potential for a continued rally, especially with sustained momentum.
Price Action
- ■Bullish breakout candle closed above resistance despite mild rejection wick on
- ■the top.
- ■Multiple consecutive bullish weekly candles with higher highs and higher lows.
- ■Minor bearish reaction in the latest candle (-7%) — likely short-term profit-
- ■booking post breakout.
- ■Needs follow-through to confirm breakout isn’t a bull trap.
Volume Profile
- ■Volume has been consistently rising since April 2025 — typical of institutional
- ■accumulation.
- ■Latest breakout accompanied by above-average volume (~213K) — not a low-
- ■volume breakout.
- ■Prior volume spike during base formation showed signs of shakeout and
- ■absorption.
Key Levels
Invalidation Scenario
Weekly close below ₹130 with rising volume would indicate failed breakout. Failure to reclaim ₹150 quickly could lead to extended consolidation or retracement. Repeated long upper wicks without follow-through may suggest distribution at highs.
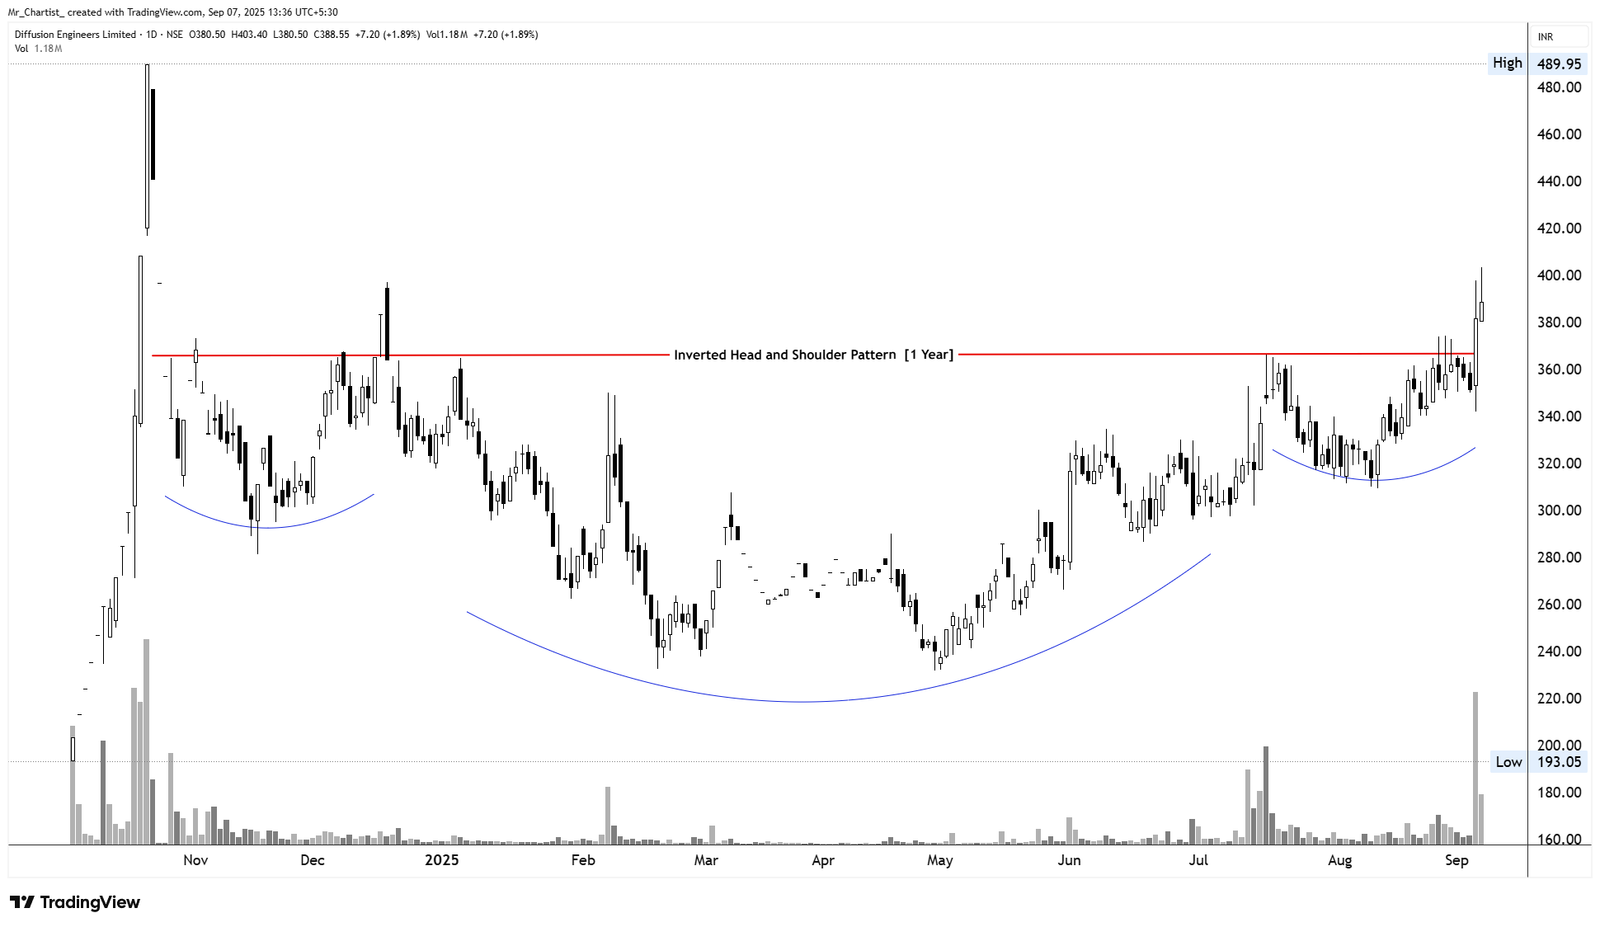
Diffusion Engineers Ltd. (DIFFNKG)
micro pennyInverted Head and Shoulders
~1 Year (Daily Chart – Breakout in Progress)
Thesis & Analysis
Diffusion Engineers has completed an Inverted Head and Shoulders pattern, a classic bullish reversal structure, after a prolonged downtrend and base- building phase. The neckline breakout around ₹360 marks a shift in market sentiment — buyers are beginning to overpower supply. This is one of the most reliable reversal setups in technical analysis, especially when confirmed by volume and follow-through.
Price Action
- ■Breakout candle surged with strong body, minimal wick — bullish intent.
- ■Recent sessions show follow-through strength with price sustaining
- ■above neckline.
- ■Latest candle shows a mild upper shadow — indicating early signs of
- ■resistance near ₹400, but structure remains intact.
Volume Profile
- ■Significant volume spike on breakout — confirms institutional interest.
- ■Prior volume spikes at right shoulder and neckline zone show early
- ■accumulation.
- ■Sustained volume above 800K/day would support continuation.
Key Levels
Invalidation Scenario
Close below ₹320 with volume — invalidates the pattern structure. Failure to reclaim ₹400 soon may result in extended consolidation. Rising volume with bearish candles would indicate distribution.
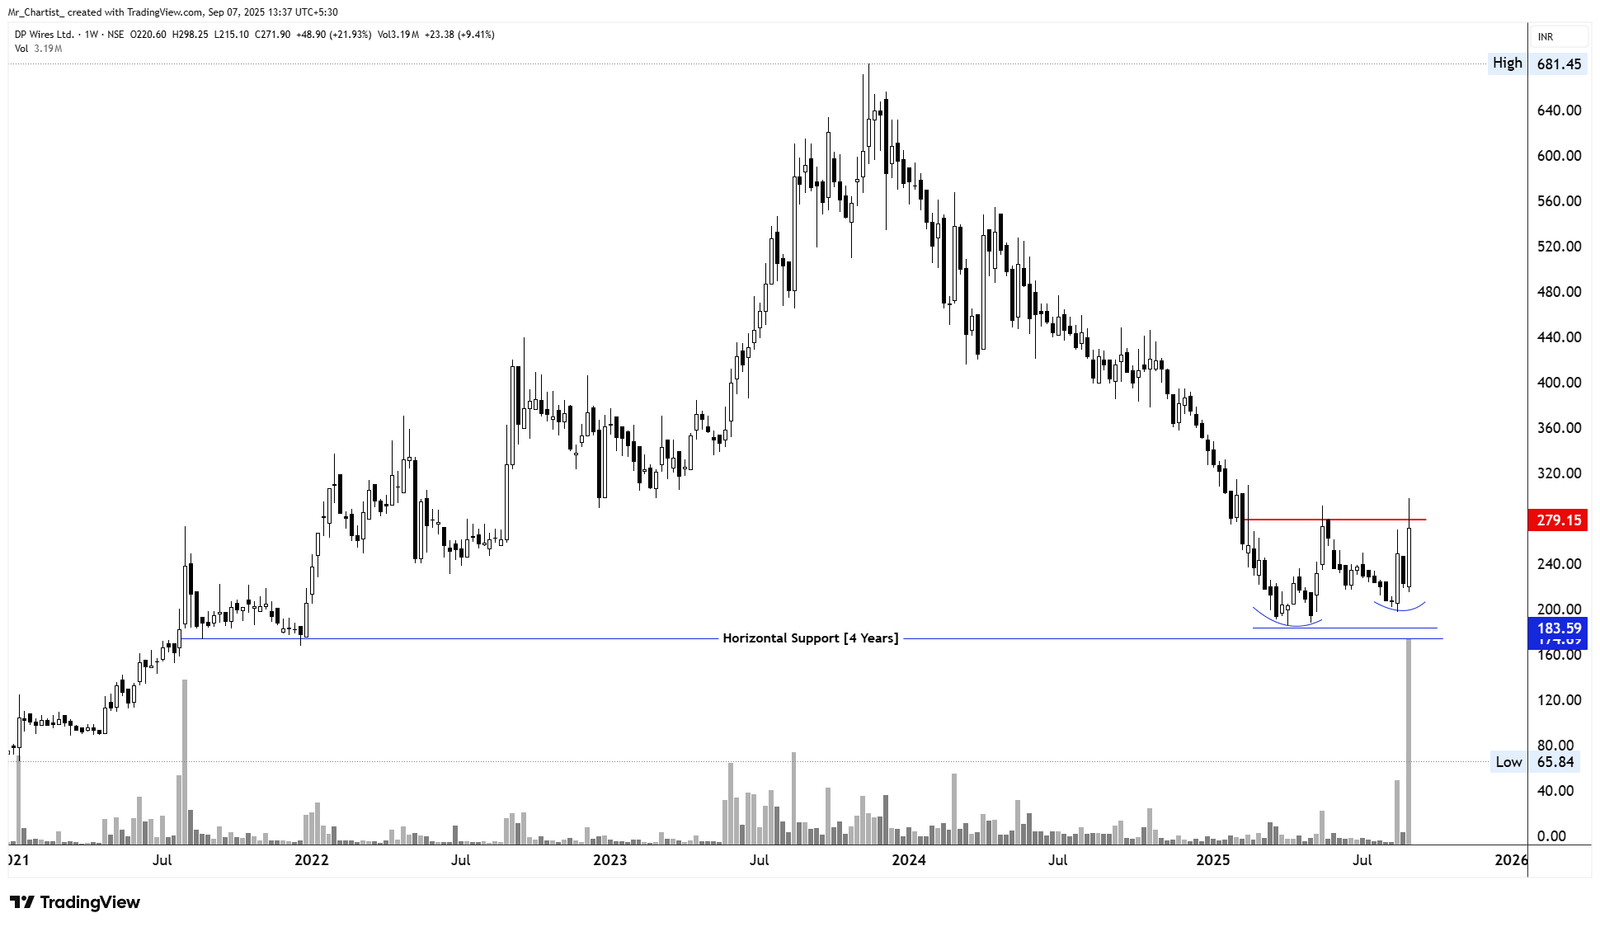
DP Wires Ltd. (DPWIRES)
micro pennyPotential Double Bottom / Rounding Base
1 Year Base within 4-Year Horizontal Support (Weekly Chart –
Thesis & Analysis
Breakout Attempt) DP Wires has formed a rounded base structure supported by a 4-year horizontal support zone near ₹180. After a steep decline from its 2023–2024 highs (₹680), the price has now attempted a breakout above ₹270–₹275, forming a potential bottom reversal. This setup resembles a double bottom or rounding bottom within a major long- term support region, hinting at a possible trend reversal.
Price Action
- ■Bullish weekly candle surged past resistance with strong body and upper
- ■shadow.
- ■Volume-led bullish candle indicates institutional activity post long
- ■accumulation.
- ■Price reacting near resistance zone; follow-through required next week for
- ■confirmation.
Volume Profile
- ■Massive volume spike — highest in recent history, signaling aggressive
- ■accumulation.
- ■Prior consolidation phases lacked volume — current breakout attempt stands
- ■out.
- ■Watch for volume consistency above 1.5M+ to confirm trend sustainability.
Key Levels
Invalidation Scenario
Weekly close below ₹183 would negate bottom formation. Heavy volume but no price progression above ₹280–₹300 may signal bull trap.
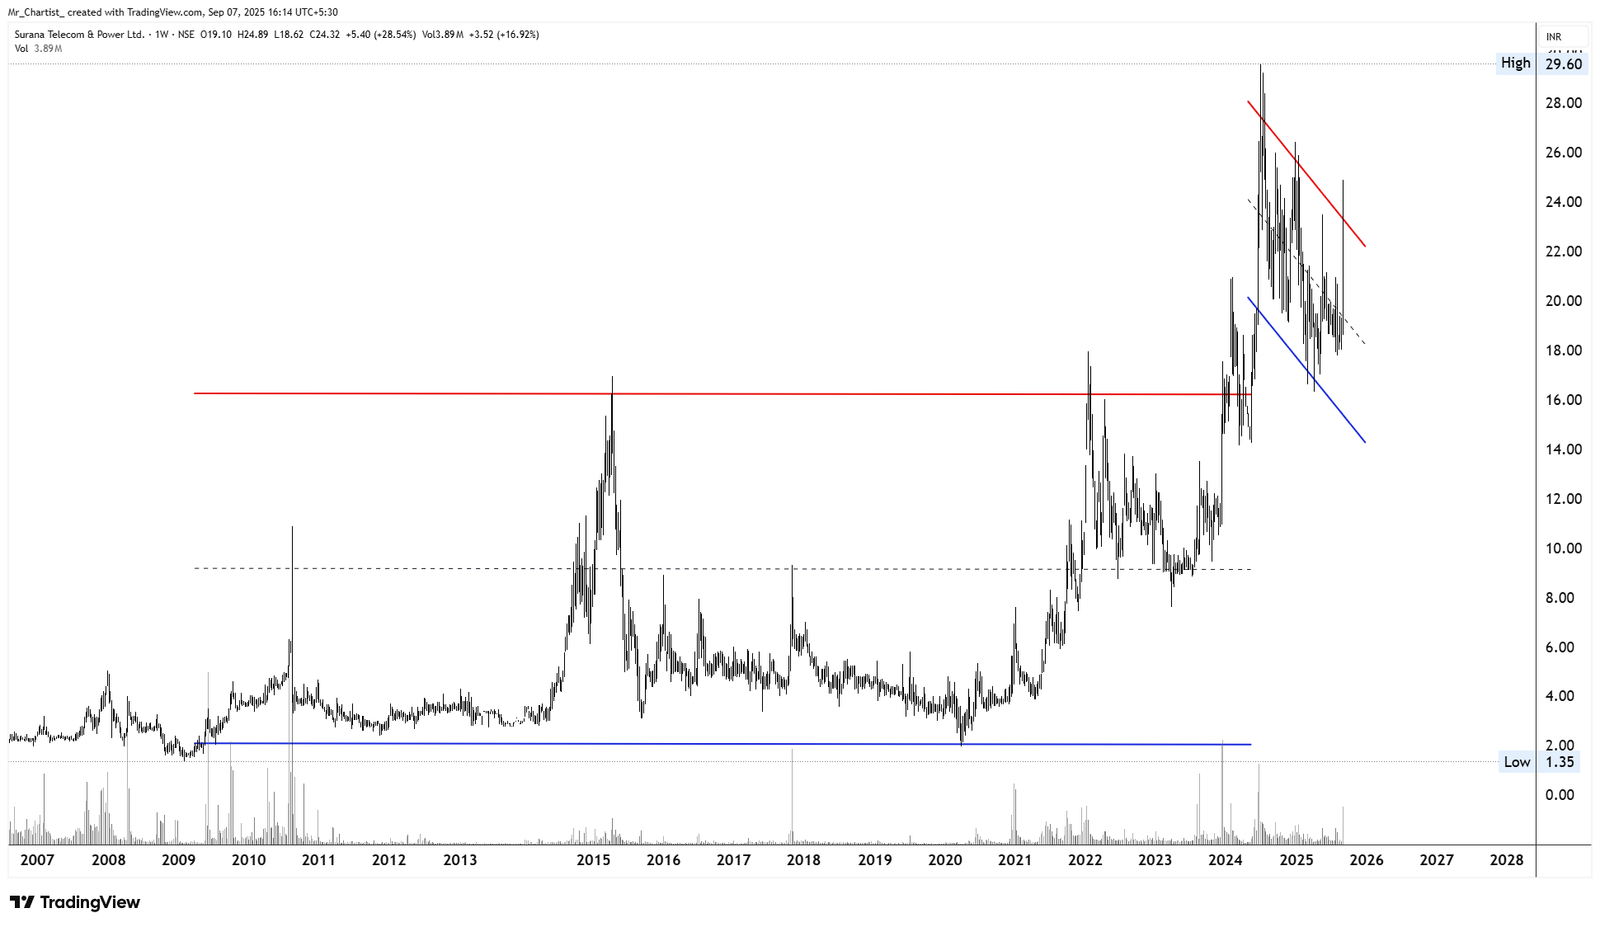
Surana Telecom and Power Ltd. (SURANAT&P)
micro pennyBreakout from Multi-Decade Base + Current Falling Wedge
~18-Year Horizontal Base (2007–2024) + Falling Wedge (9
Thesis & Analysis
Months) Surana Telecom and Power Ltd. has finally broken out of a massive 18-year horizontal base around ₹16–₹17 that capped prices since 2007. This kind of structural breakout is rare and often marks secular trend transitions. Post breakout, price surged to ₹29.60 and entered a broad falling wedge pattern, now attempting a breakout from that short-term correction — suggesting continuation of the primary uptrend.
Price Action
- ■Weekly bullish engulfing near wedge breakout zone suggests renewed
- ■momentum.
- ■Candle shows lower wick, signaling dip-buying near ₹18.
- ■Strong close above ₹23.50 trendline confirms wedge breakout attempt.
Volume Profile
- ■Huge breakout volumes during move above ₹17–₹18 (early 2025) — strongest
- ■in stock's history.
- ■Falling volume during wedge consolidation indicates classic bullish corrective
- ■phase.
- ■Volume spike on recent breakout attempt shows buyers returning.
Key Levels
Invalidation Scenario
Weekly close below ₹17 would signal breakdown back into base — structural failure. Failure to close above ₹26–₹28 may lead to extended consolidation. Volume drop on breakout or sharp rejection from ₹25–₹26 zone would caution upside.
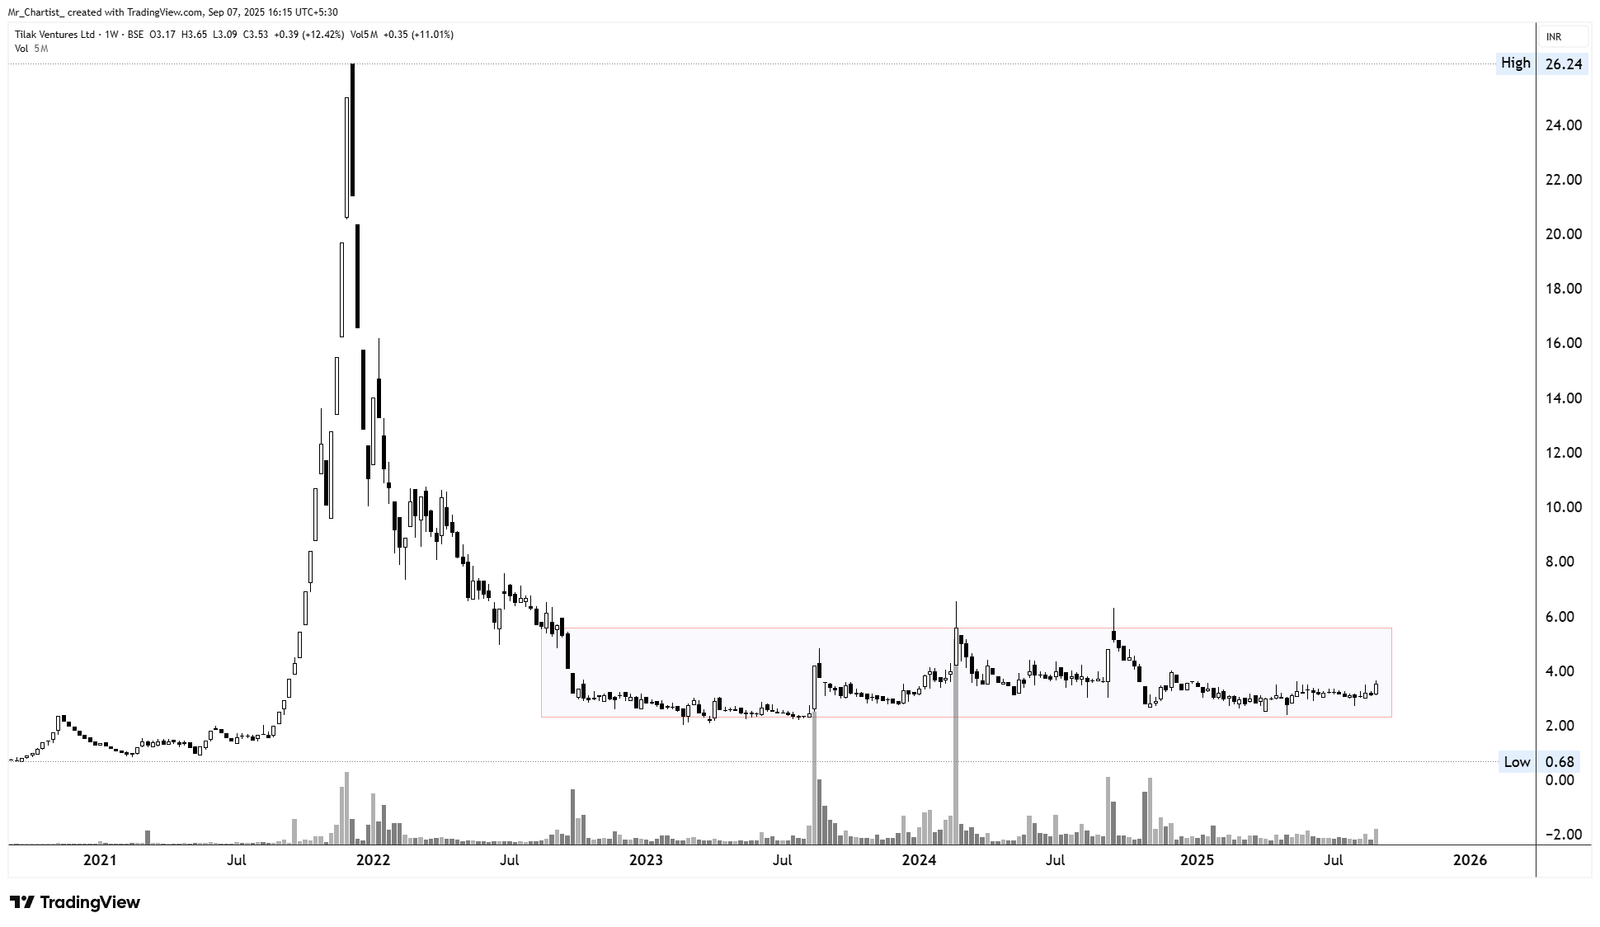
Tilak Ventures Ltd. (TILAK)
micro pennyRectangle Base (Post-Parabolic Correction Accumulation)
~2.5 Years (Weekly Chart – Rangebound Accumulation)
Thesis & Analysis
After witnessing a massive parabolic rally to ₹26.24 in early 2022, Tilak Ventures has undergone a deep correction and subsequent sideways base. Since mid-2022, price has been oscillating within a narrow rectangle between ₹2.80 and ₹5.80, creating a well-defined accumulation range. This type of base after euphoric rallies is common as weak hands exit and long-term accumulation quietly happens. Sustained breakout above ₹6 could indicate the next wave of trend resumption.
Price Action
- ■Multiple failed breakout attempts at ₹5.50–₹5.80 zone — now forming
- ■tighter candles
- ■Recent candles show smaller bodies — signaling volatility contraction
- ■near base highs
- ■Price hugging midpoint of the range — possible base tightness building
Volume Profile
- ■Noticeable volume spikes on upward moves (esp. in May 2023 and Jan
- ■2024)
- ■Down moves have low volume — indicative of lack of aggressive selling
- ■Drying volume during consolidation — textbook signature of an ending
- ■base
Key Levels
Invalidation Scenario
Weekly close below ₹2.20 would invalidate base and signal fresh downtrend Multiple rejections at ₹5.80 without volume may prolong sideways behavior A long-term range breakdown would reset structure to pre-rally levels
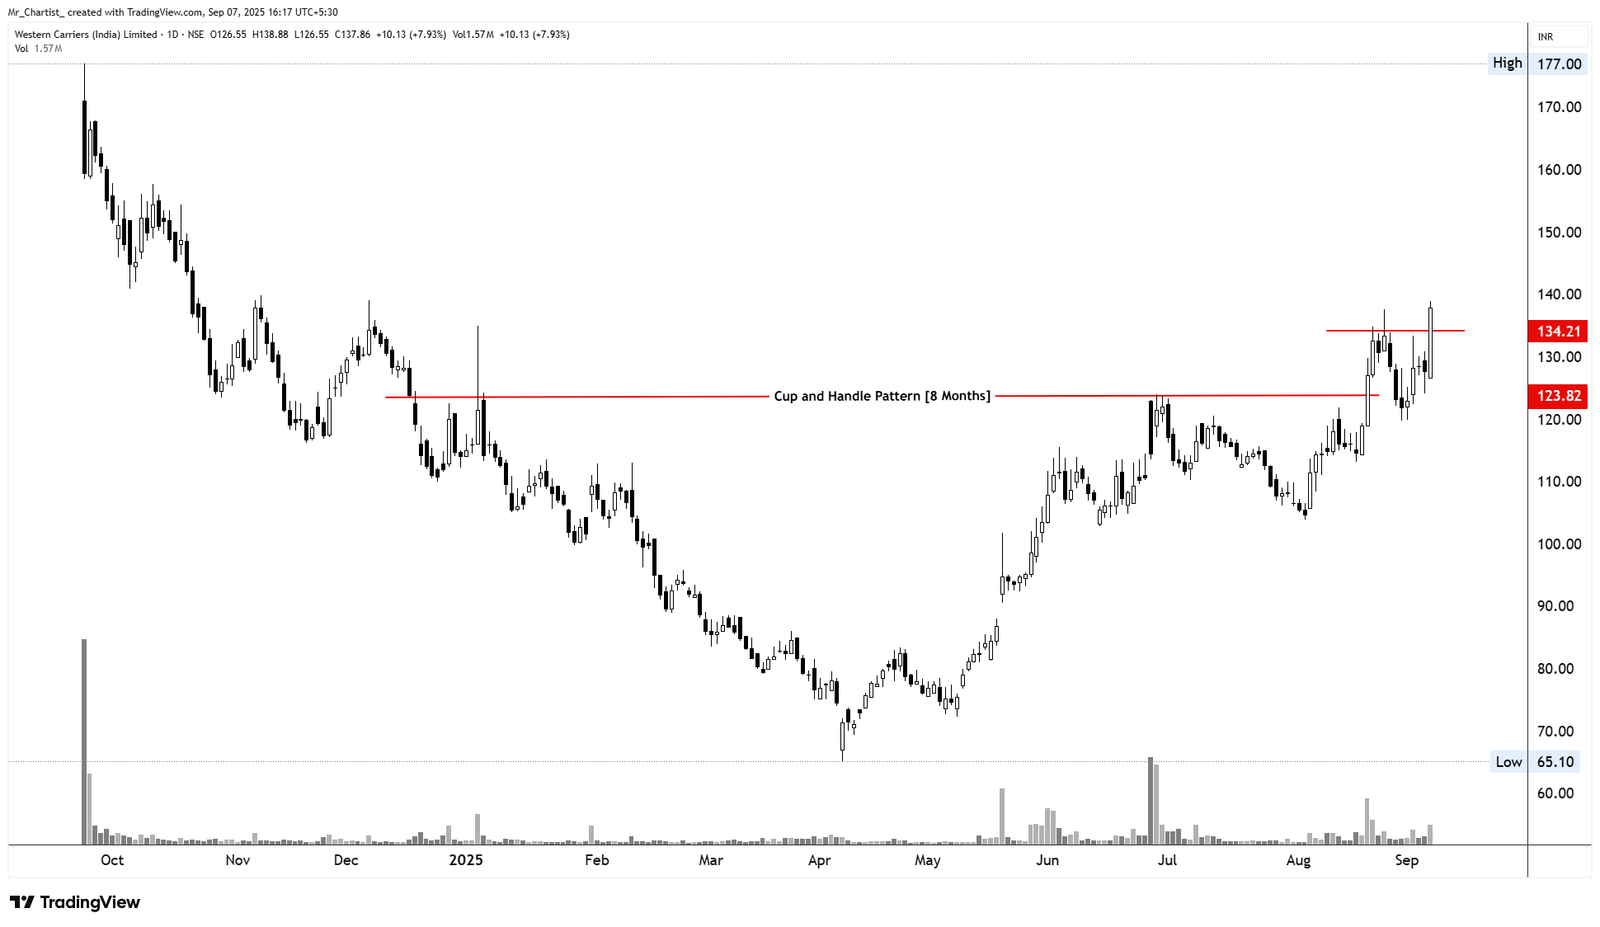
Western Carriers (India) Ltd. (WCIL)
micro pennyCup and Handle
~8 Months (Daily Chart – Breakout Attempt in Progress)
Thesis & Analysis
Western Carriers is displaying a textbook Cup and Handle pattern, a bullish continuation setup indicating a consolidation before the next leg higher. The cup formation began in late 2024 with a rounded bottom, and the recent sideways consolidation in the handle is resolving upward. A breakout above ₹134–₹135, the prior high, suggests fresh bullish momentum and potential trend continuation.
Price Action
- ■Recent breakout candle is long-bodied with good follow-through above the
- ■handle
- ■Minor wick on top suggests slight supply, but price held breakout
- ■Handle consolidation was tight — healthy before breakout attempt
Volume Profile
- ■Volume increased during breakout — confirming buyer interest
- ■Handle formed with decreasing volume — a classic bullish trait
- ■Sustained volume above 1M+ per day will be key to trend continuation
Key Levels
Invalidation Scenario
Daily close below ₹122 would negate breakout and re-enter handle zone Failure to hold ₹135 on high volume could indicate bull trap Flat or declining volume post-breakout may reduce momentum reliability

Yaari Digital Integrated Services Ltd. (YAARI)
micro pennyAccumulation Base with Rounded Rectangle
~1.5 Years (Weekly Chart – Early Stage Breakout Attempt)
Thesis & Analysis
Yaari Digital has been moving sideways since early 2023, forming a long, shallow accumulation base between ₹8 and ₹22. A recent rounded bottom formation within this zone indicates renewed buying interest, and the current weekly candle shows a sharp uptick, suggesting a potential early breakout from this extended base. This setup resembles a classic base formation post-deep downtrend, often seen in turnaround or revival stocks.
Price Action
- ■Strong bullish weekly candle with long body and close near high
- ■Price emerging from the mid-range with a curved base — bottoming
- ■structure visible
- ■First attempt to close above micro-resistance (~₹20) — needs
- ■confirmation
Volume Profile
- ■Volume expanding on breakout attempt — highest since early 2023
- ■Gradual accumulation pattern visible over months — smart money signs
- ■Weekly volume spikes coinciding with higher lows — accumulation in
- ■progress
Key Levels
Invalidation Scenario
A close below ₹13 on volume would signal breakdown into lower base Failure to hold ₹20–₹21 with weak volume could indicate a false breakout Sharp rejection from ₹22 may extend consolidation phase
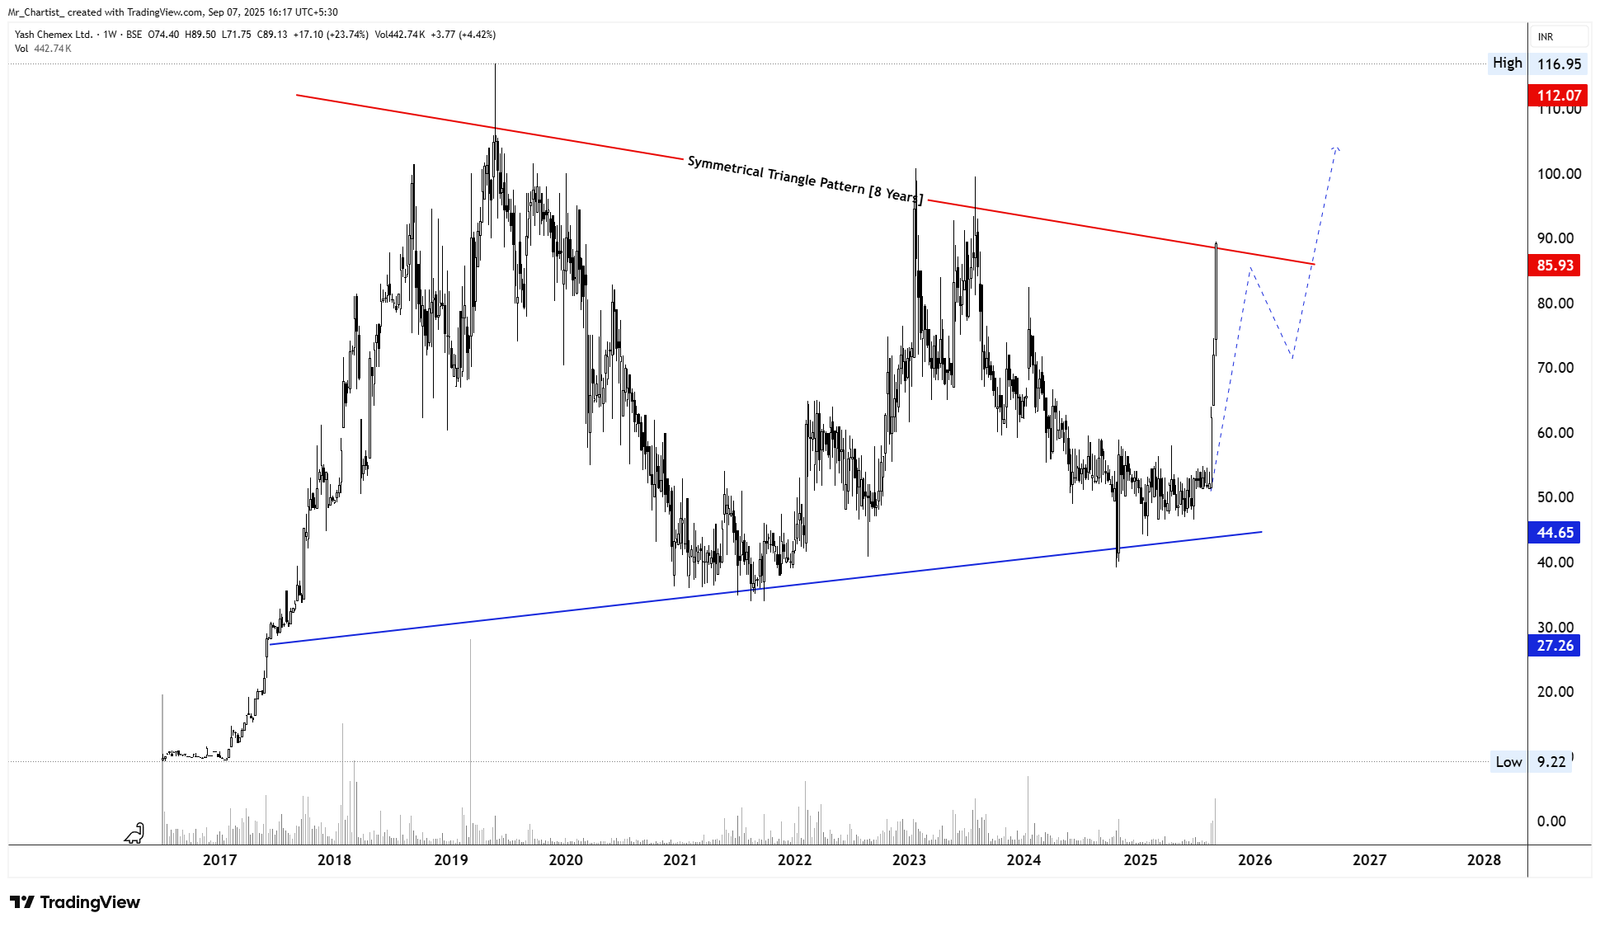
Yash Chemex Ltd. (YASHCHEM)
micro pennySymmetrical Triangle (Multi-Year Contraction)
~8 Years (Weekly Chart – Pattern Breakout Attempt)
Thesis & Analysis
Yash Chemex has formed a massive symmetrical triangle pattern stretching over 8 years — characterized by lower highs and higher lows converging into a tight apex. These patterns often signal strong breakouts upon resolution, especially after long contraction phases. This week’s breakout candle has pierced the upper trendline decisively, indicating a possible structural shift from contraction to expansion.
Price Action
- ■Huge weekly bullish candle with strong body and minor upper shadow —
- ■momentum breakout
- ■Break above falling trendline after 8 years of compression
- ■Price still near breakout point, potential for continuation or retest
Volume Profile
- ■Volume surged significantly with breakout — among highest in years
- ■Past breakouts failed due to weak volume — current breakout supported by
- ■conviction
- ■Sustained weekly volume >300K will confirm breakout validity
Key Levels
Invalidation Scenario
Weekly close below ₹60 with rising volume Failure to hold triangle breakout zone may suggest false breakout Sudden sharp rejection at ₹112 resistance without buildup
SEBI Registered Research Analyst — INH000015297 (INVESTOLOGY). Investment in securities market are subject to market risks. Read all related documents carefully before investing. The content provided is for educational purposes only and should not be considered as financial advice. Past performance is not indicative of future results.