Coming Soon
The Weekend Visual ChartBook is currently undergoing a massive upgrade. Stay tuned for a world-class reading experience.
Return HomeWeekend Visual ChartBook
Edition #277
30 July 2025
Market Pulse
LiveReal-time index prices above. Detailed index chart analysis below in the Indices section.
Bullish Charts [F&O]
Breakout and momentum setups from the F&O universe
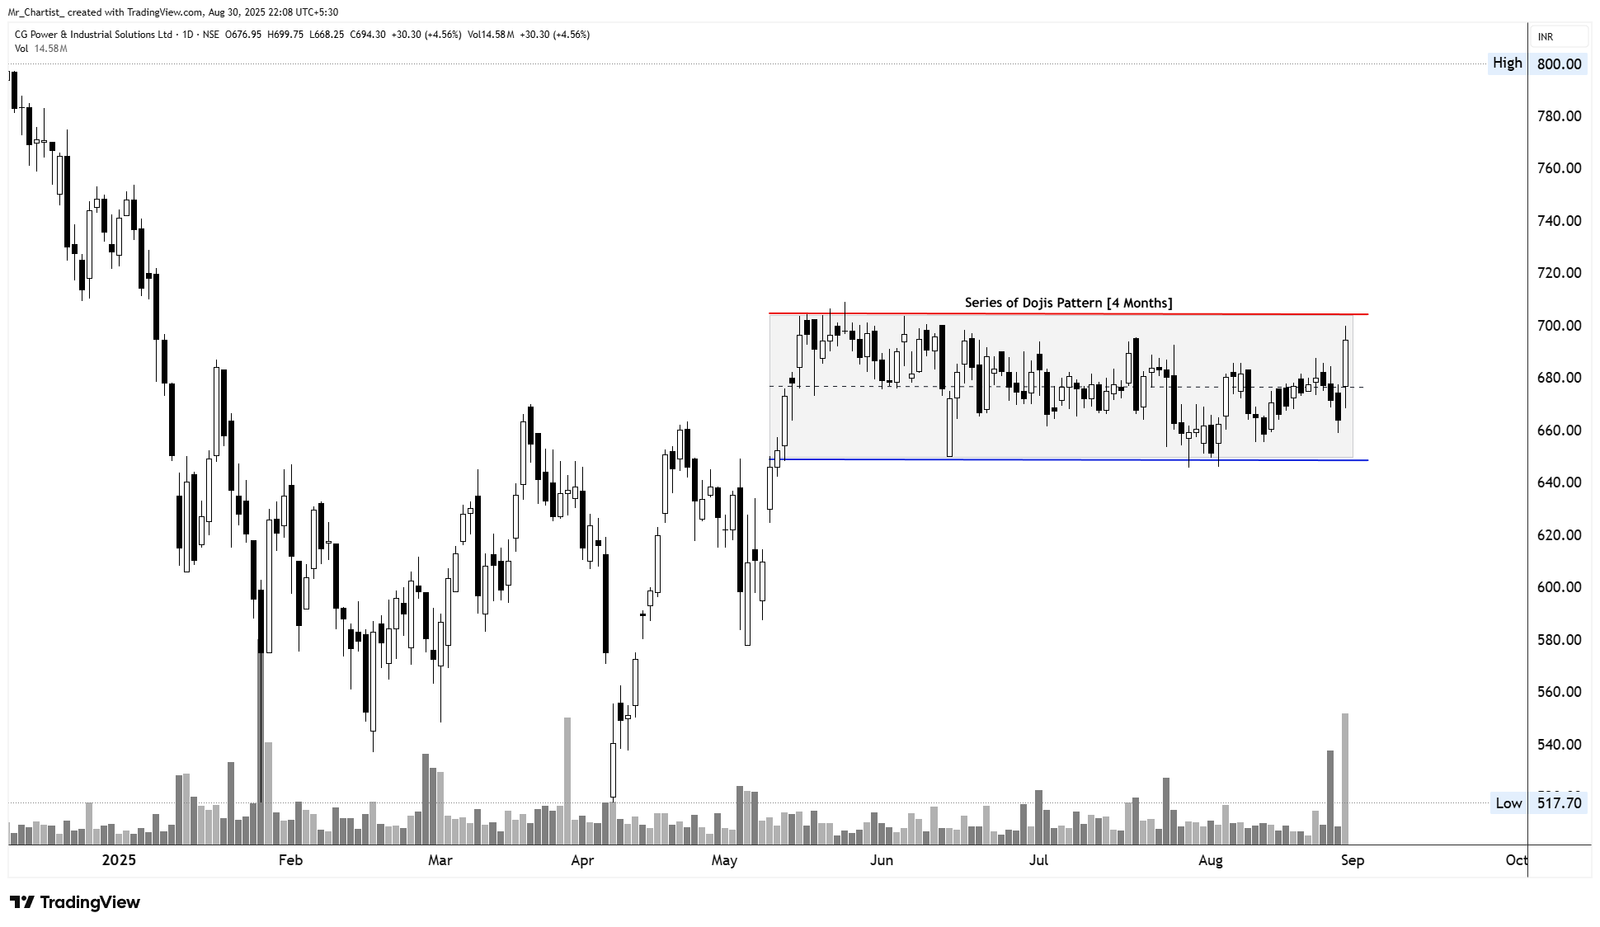
CG Power & Industrial Solutions Ltd
bullish fnoNarrow Range Consolidation with Doji Cluster
4 Months (Daily Chart – Compression Setup Before Expansion)
Thesis & Analysis
CG Power has been trading in a tight consolidation range between ₹645 and ₹705 over the last 4 months. The structure is marked by a series of doji candles, indicating extreme indecision and equilibrium between buyers and sellers. Despite this prolonged sideways price action, a notable shift in volume dynamics has emerged recently. In the last 3 sessions, there has been a dramatic surge in volume, despite the price remaining within the range. This divergence between flat price action and rising volume is often a precursor to a strong directional move — typically a bullish breakout when volume accompanies upper-range testing. 🕯️ Candlestick Behavior: Multiple doji candles in the last 2 months highlight market indecision. Price recently tested the upper range near ₹705 with a long wick but was pulled back — indicating resistance. A clean close above ₹705 with volume could confirm the breakout. 🔊 Volume Analysis: Last 3 sessions have seen unusually high volume. No corresponding major breakdown — suggests absorption of supply. Volume buildup without price collapse = smart money accumulation hypothesis.
Price Action
No specific price action noted.
Volume Profile
No specific volume analysis noted.
Key Levels
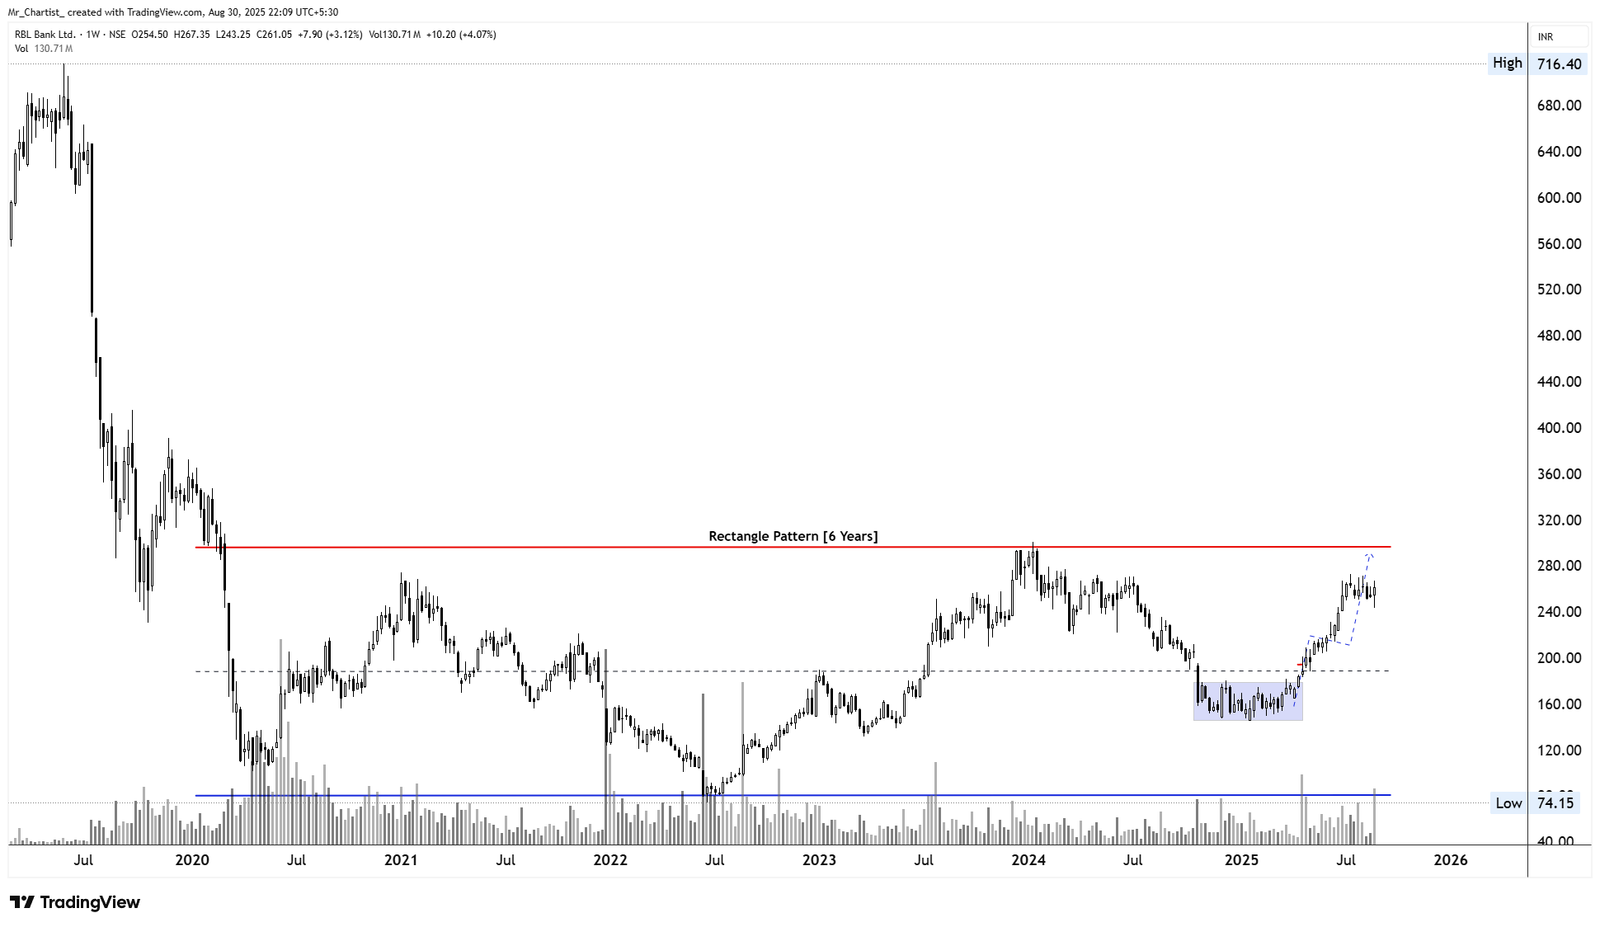
RBL Bank Ltd
bullish fnoRectangle Pattern
6 Years (Weekly Chart – Long-Term Consolidation Structure)
Thesis & Analysis
RBL Bank has been forming a massive rectangle pattern since 2019, spanning over 6 years of price action. The structure reflects a long-term accumulation phase between the approximate range of ₹320 (resistance) and ₹75 (support). The stock has recently completed a base formation near the lower end of the range (₹150–₹170 zone) and is now staging a sharp rally toward the upper resistance near ₹320. This kind of structural move, especially after a multi-year sideways phase, often leads to a powerful breakout and trend transition. The current setup hints at a potential breakout above ₹320, which would mark a significant positional trade opportunity with long-term upside potential. 🕯️ Candlestick Behavior: Bullish momentum visible in the recent weeks with strong weekly candles. Higher highs and higher lows emerging from the ₹150 base. Bullish continuation pattern shaping up as price approaches major resistance. 🔊 Volume Analysis: Volume has increased steadily since the breakout from the lower base. Notably higher volume clusters during upward candles — institutional accumulation. Volume in the consolidation box near ₹150 showed signs of absorption before the rally.
Price Action
No specific price action noted.
Volume Profile
No specific volume analysis noted.
Key Levels
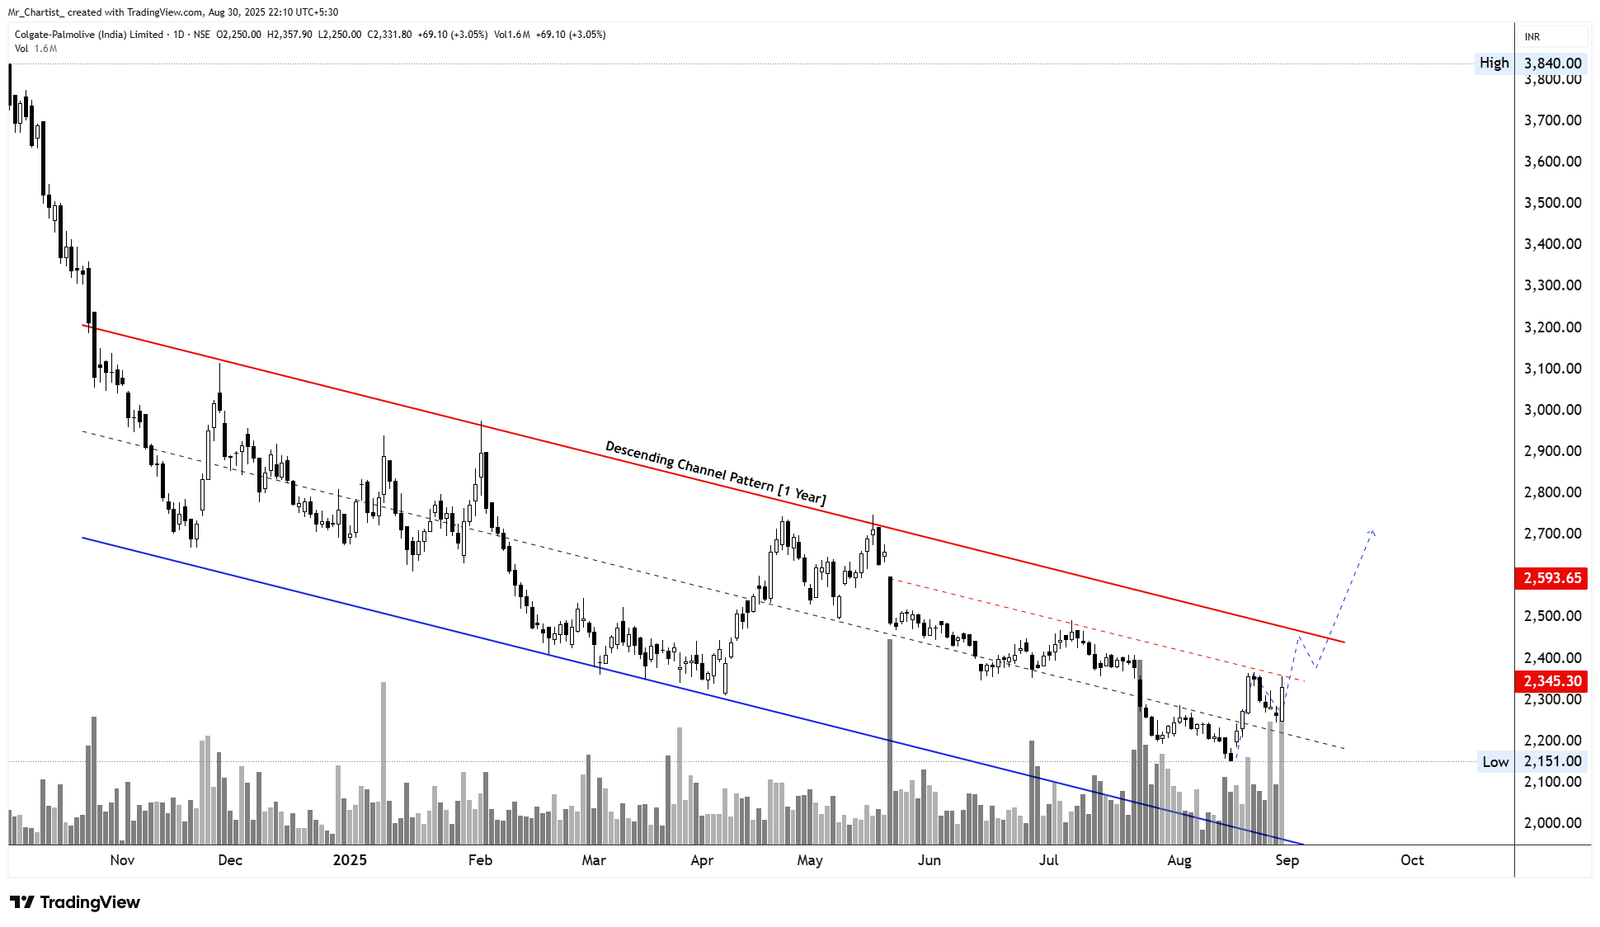
CESC Ltd
bullish fnoDescending Channel Pattern
1 Year (Daily Chart – Intermediate-Term Trend Reversal)
Thesis & Analysis
Colgate-Palmolive has been moving within a descending channel for the past 12 months, reflecting a controlled downtrend with lower highs and lower lows. The stock recently rebounded sharply from the lower boundary of this channel with high volume, and has now approached the upper boundary, signaling a possible breakout attempt. This breakout scenario, if confirmed, could trigger a trend reversal and initiate a swing rally toward higher levels. 🕯️ Candlestick Behavior: Recent candles show strong bullish momentum with large-bodied green candles. Price broke past the midline of the channel and is now testing the upper trendline. Volatility expansion after a tight compression zone is a bullish sign. 🔊 Volume Analysis: Volume surged significantly in the last 3 sessions — highest in months. The breakout from the compression zone was accompanied by large volume, suggesting institutional participation. Sustained volume above 2 million shares would reinforce breakout strength.
Price Action
No specific price action noted.
Volume Profile
No specific volume analysis noted.
Key Levels
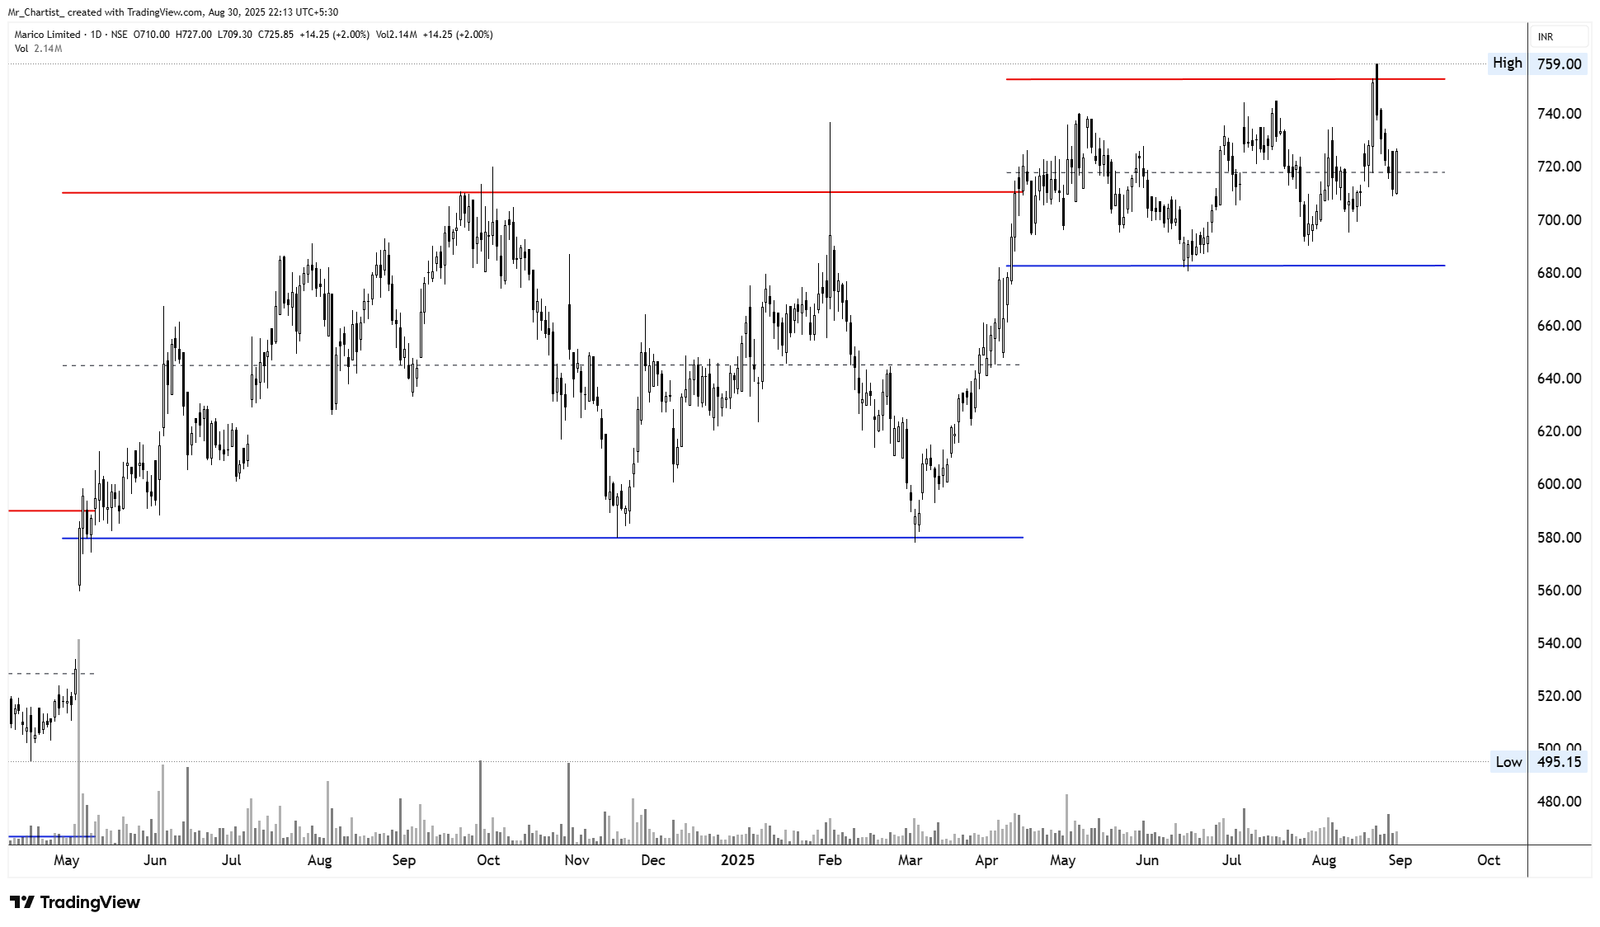
Marico Ltd
bullish fnoHorizontal Range Breakout Watch
1.5 Years (Daily Chart – Medium-Term Accumulation Range)
Thesis & Analysis
Marico has been consolidating in a well-defined horizontal range between ₹680 and ₹755 for over 18 months, forming a broad accumulation base. Multiple rejections from the upper resistance zone (~₹755) suggest strong supply, but price action has recently shown renewed strength with a sharp move toward the upper band. Friday's session saw a strong 2% rally closing near ₹726, reinforcing bullish sentiment. A decisive breakout above ₹755 with volume would confirm a range breakout and open doors to a fresh leg higher. 🕯️ Candlestick Behavior: Recent candles show higher lows and expanding body size. Last two sessions formed a bullish structure after a mild pullback — indicating accumulation. No immediate supply rejection visible yet from ₹755. 🔊 Volume Analysis: Volume remains steady but not explosive yet — watch for volume > 4–5M during breakout. Previous breakouts in this stock have been supported by follow-through volume. A breakout above ₹755 on high volume would indicate institutional participation.
Price Action
No specific price action noted.
Volume Profile
No specific volume analysis noted.
Key Levels
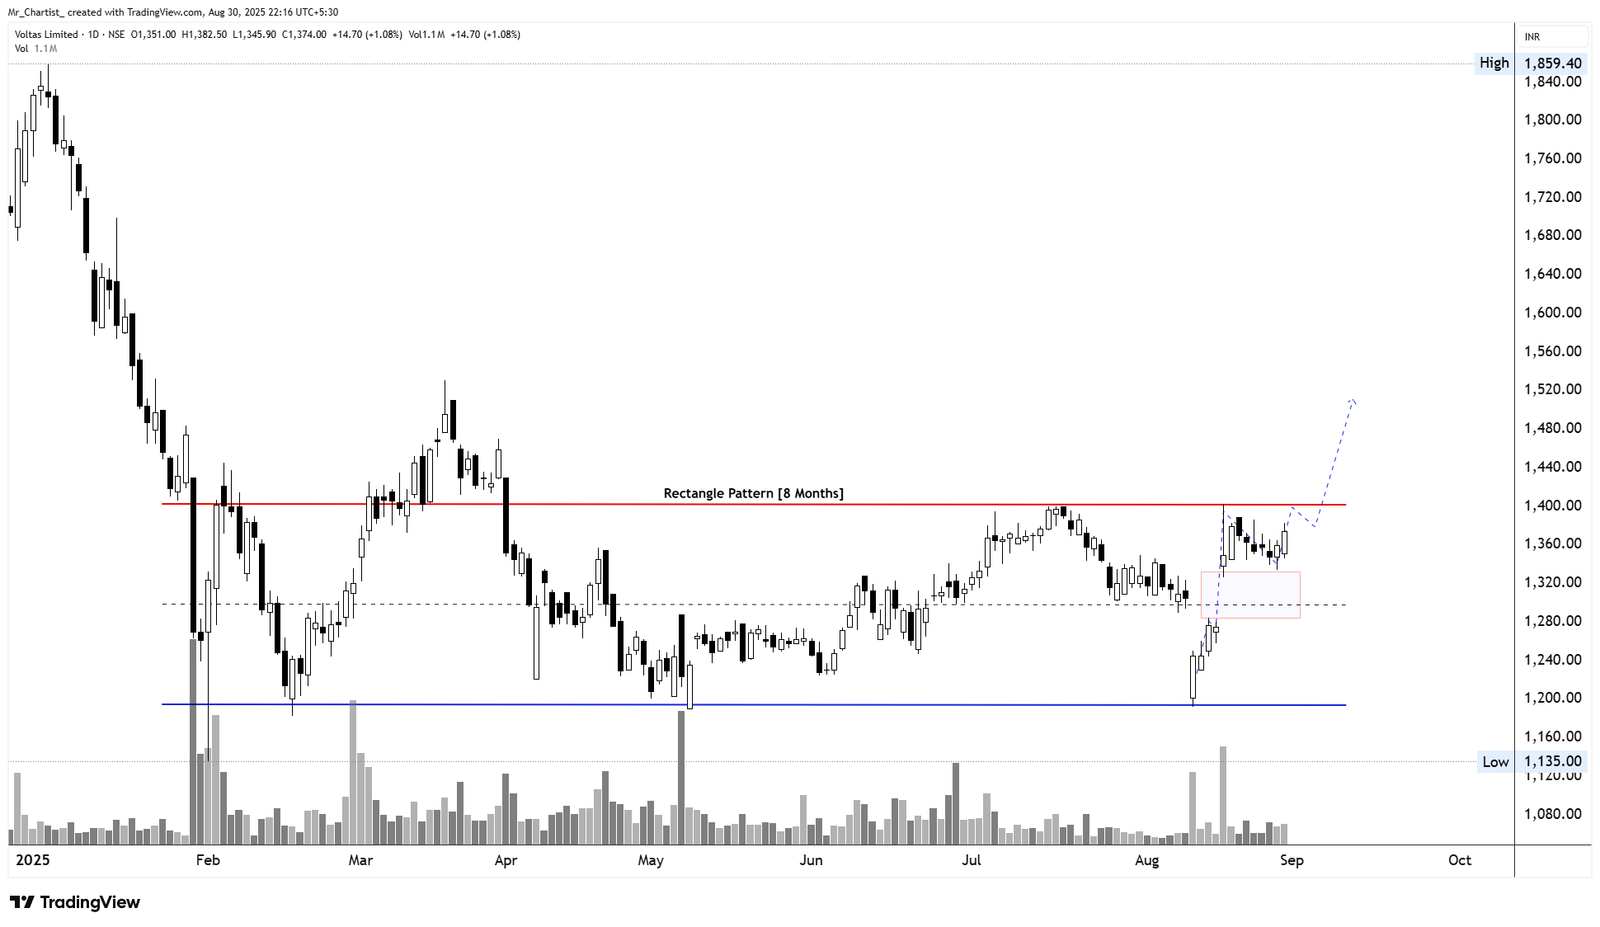
Voltas Ltd
bullish fnoRectangle Pattern
8 Months (Daily Chart – Medium-Term Consolidation Breakout Watch)
Thesis & Analysis
Voltas has been moving within a well-defined rectangle pattern for the last 8 months, oscillating between ₹1,150 on the downside and ₹1,420 on the upside. The stock faced resistance multiple times near the ₹1,420 zone, making it a strong horizontal breakout level. Following a sharp fall in August 2025, price formed a gap reversal and is now approaching the top of the rectangle again — showing bullish intent and setting up for a potential breakout above the range. 🕯️ Candlestick Behavior: Recent candles have been bullish with follow-through after a strong recovery from ₹1,250. Clean bounce from mid-rectangle zone and forming higher lows. Today's candle broke above short-term swing resistance — momentum building. 🔊 Volume Analysis: Volume surged during the reversal rally from the ₹1,250 levels. Volume has stayed elevated in the last few sessions, indicating accumulation before a potential breakout. Watch for volume spike above 1.5M for breakout confirmation.
Price Action
No specific price action noted.
Volume Profile
No specific volume analysis noted.
Key Levels
Bearish Charts [F&O]
Breakdown and weakness watch setups
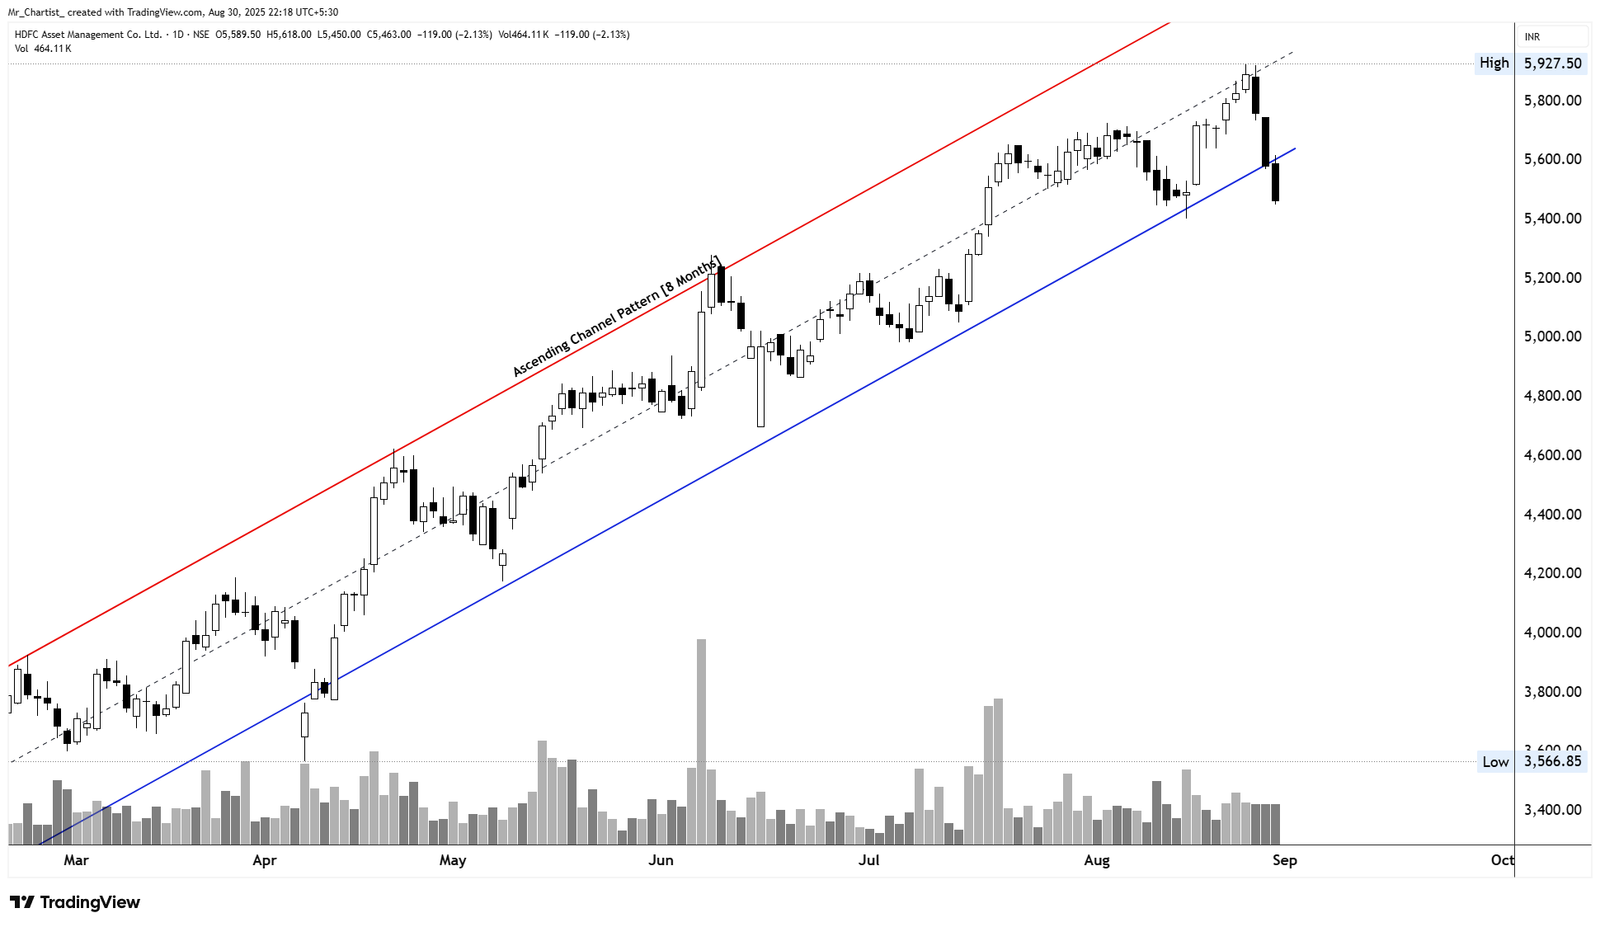
HDFC AMC Ltd
bearish fnoAscending Channel Pattern
9 Months (Daily Chart – Rising Channel Breakdown Risk)
Thesis & Analysis
HDFC AMC has been trending inside a rising/ascending channel for the past 9 months. This structure captured a healthy uptrend with well-defined higher highs and higher lows, supported by consistent volume participation. However, the recent sharp breakdown below the lower trendline of the ascending channel puts the ongoing uptrend at risk. A bearish engulfing candle with strong volume has closed below this key dynamic support, indicating weakness and a possible trend change in the short to medium term. 🕯️ Candlestick Behavior: Large bearish candle breaking below the channel support. Failed attempt to bounce off the lower trendline was quickly sold into. Formation suggests bearish momentum gaining traction. 🔊 Volume Analysis: Volume on breakdown day is significantly higher than average — confirms distribution. Volume rising during the decline = sign of exit by smart money. Past pullbacks had lower volume; this one is different.
Price Action
No specific price action noted.
Volume Profile
No specific volume analysis noted.
Key Levels
SME Bullish Charts
Small & Medium Enterprise breakout opportunities
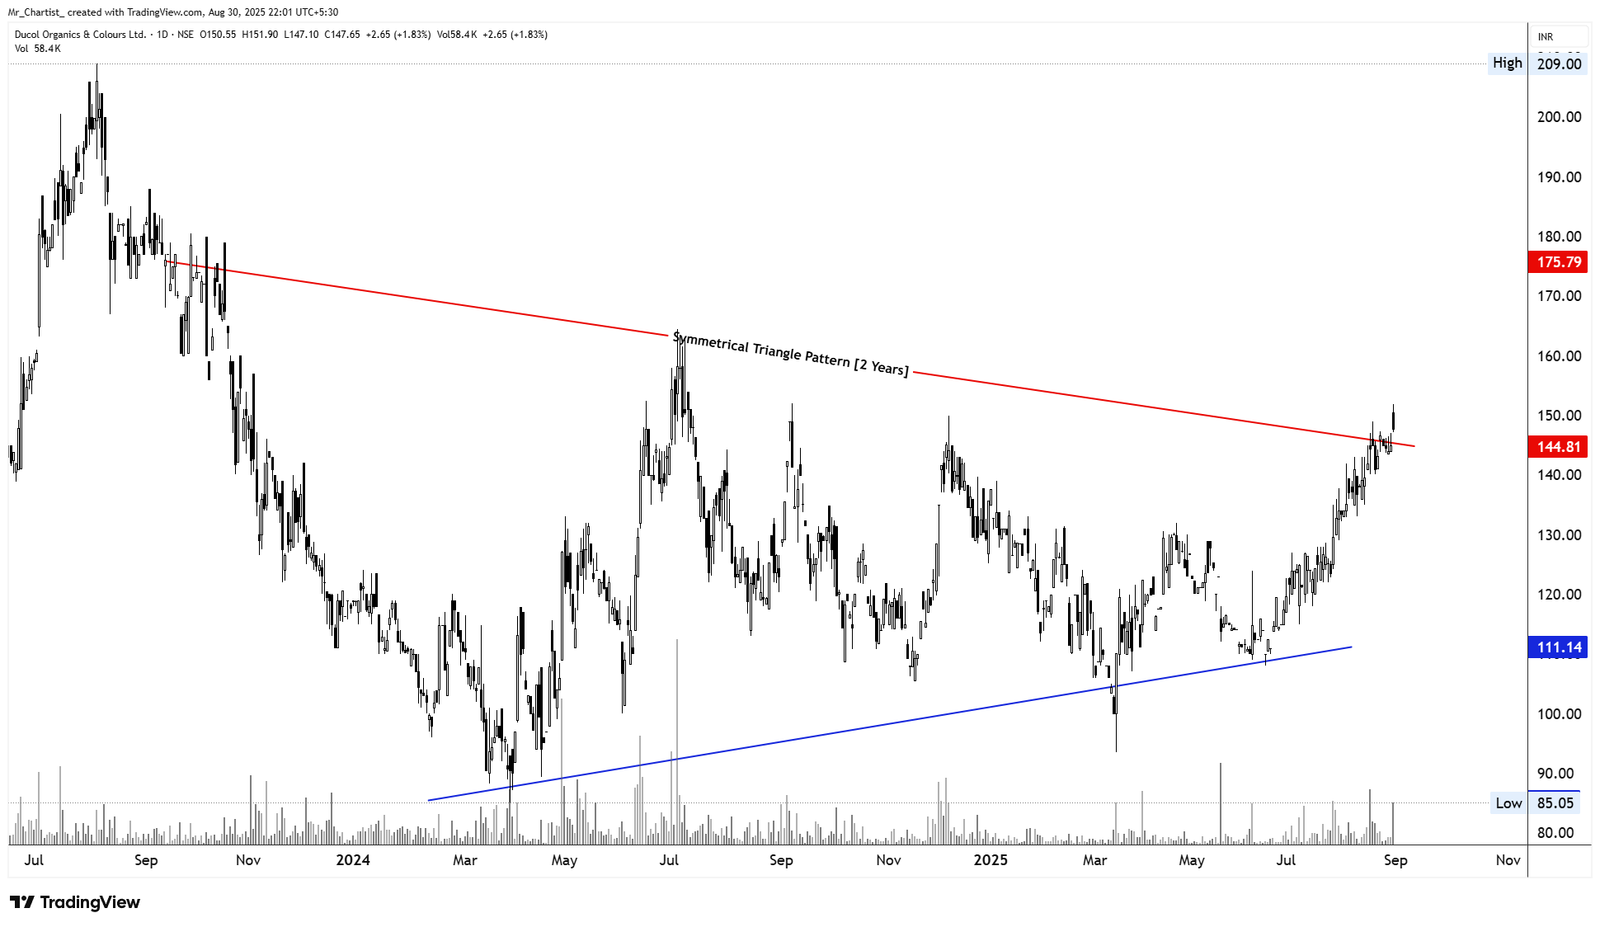
Prime Fresh Ltd
sme bullishSymmetrical Triangle Breakout
2 Years (Daily Chart – Long-Term Compression Breakout)
Thesis & Analysis
Ducol Organics & Colours Ltd has broken out of a well-defined symmetrical triangle pattern that had been forming for over 24 months. This pattern displayed progressively narrowing price action with lower highs and higher lows, indicating long-term consolidation and buildup. The breakout has occurred just above the ₹145–₹147 zone, with a clean candle close above the descending trendline, marking a strong bullish shift in structure. This breakout breaks the dominant compression zone and opens room for a trend reversal. Candlestick Behavior: The breakout candle is long-bodied and bullish, signaling strong buyer intent. Previous candles showed lower volatility – typical of breakout compression buildup. Clean and decisive structure with minimal upper wick, confirming strength. Volume Analysis: Volume expanded sharply on the breakout day – the highest in several weeks. Previous breakout attempts lacked volume confirmation – this one stands out. Sustained participation above average in coming sessions would confirm strength continuation.
Price Action
No specific price action noted.
Volume Profile
No specific volume analysis noted.
Key Levels
No zones specified
No zones specified
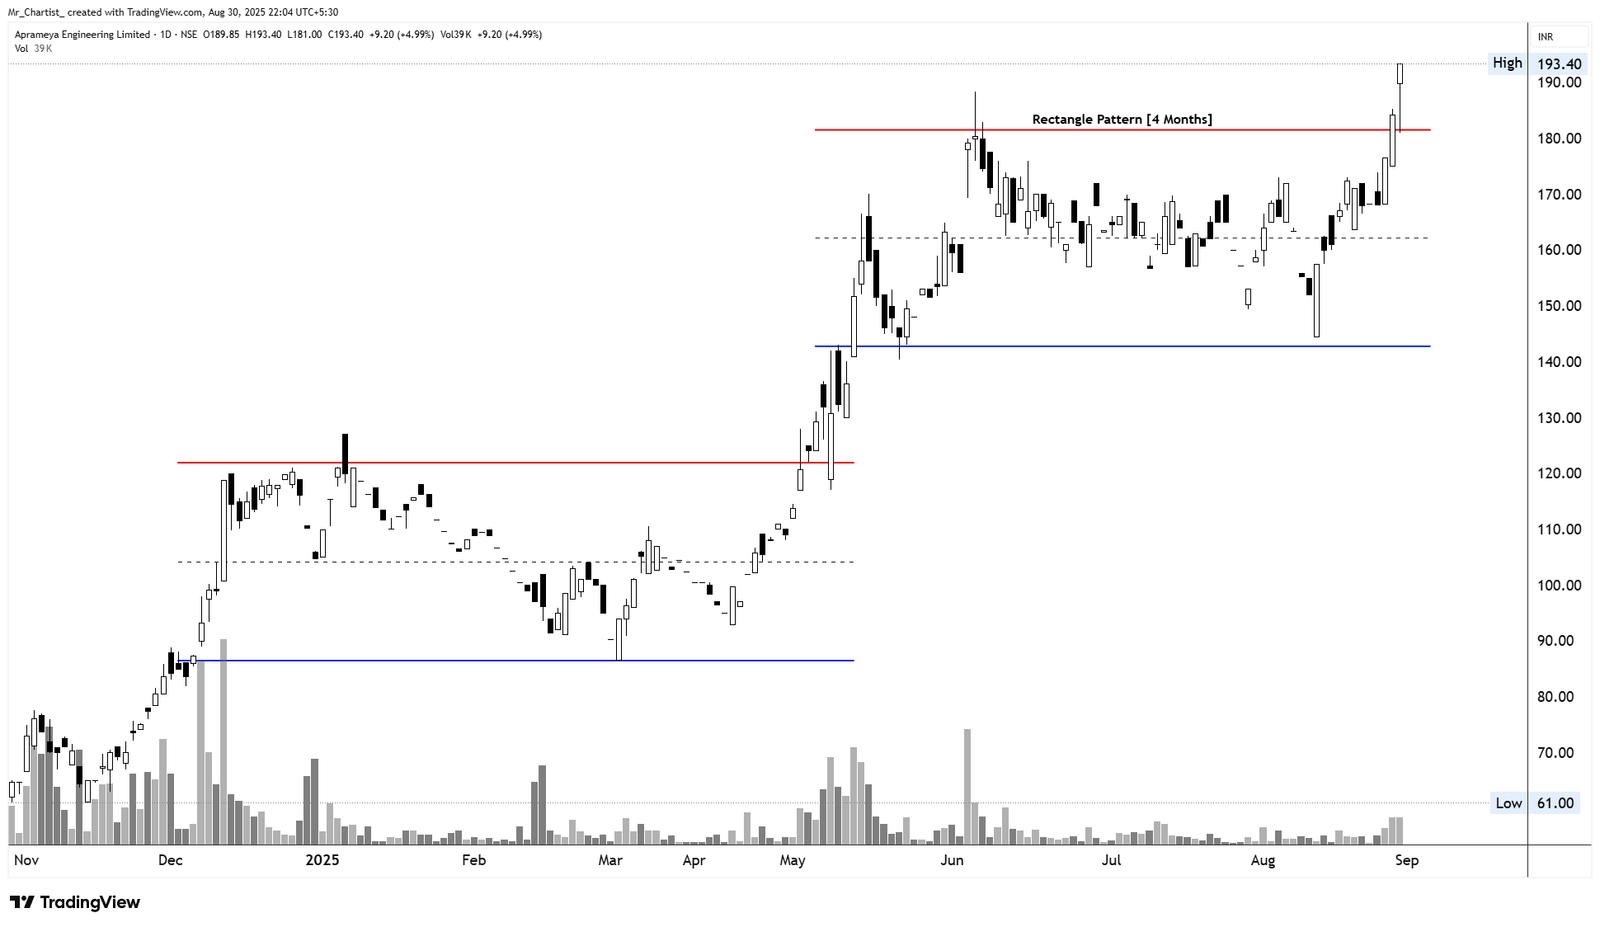
Aprameya Engineering Ltd
sme bullishRectangle Pattern Breakout
4 Months (Daily Chart – Intermediate Continuation Pattern)
Thesis & Analysis
Aprameya Engineering Ltd has broken out of a 4-month Rectangle Pattern, with price breaching the ₹180 resistance zone decisively. This structure indicates a consolidation phase within an ongoing uptrend, now resolving in favor of the bulls. The breakout was clean and supported by a strong bullish candle, suggesting that the accumulation phase has transitioned into a fresh momentum leg. Candlestick Behavior: Breakout candle is wide-ranged, bullish, and closes near the high – classic breakout strength. Prior candles within the rectangle showed balanced supply/demand, consistent with consolidation. No signs of exhaustion; structure remains bullish with a strong push above resistance. Volume Analysis: Volume picked up significantly on breakout day, supporting a valid breakout. Previous volume spikes near rectangle lows suggested accumulation. Sustained volume above 30–40K shares would be healthy for trend continuation.
Price Action
No specific price action noted.
Volume Profile
No specific volume analysis noted.
Key Levels
Cash Bullish Charts
Equity delivery-based bullish setups
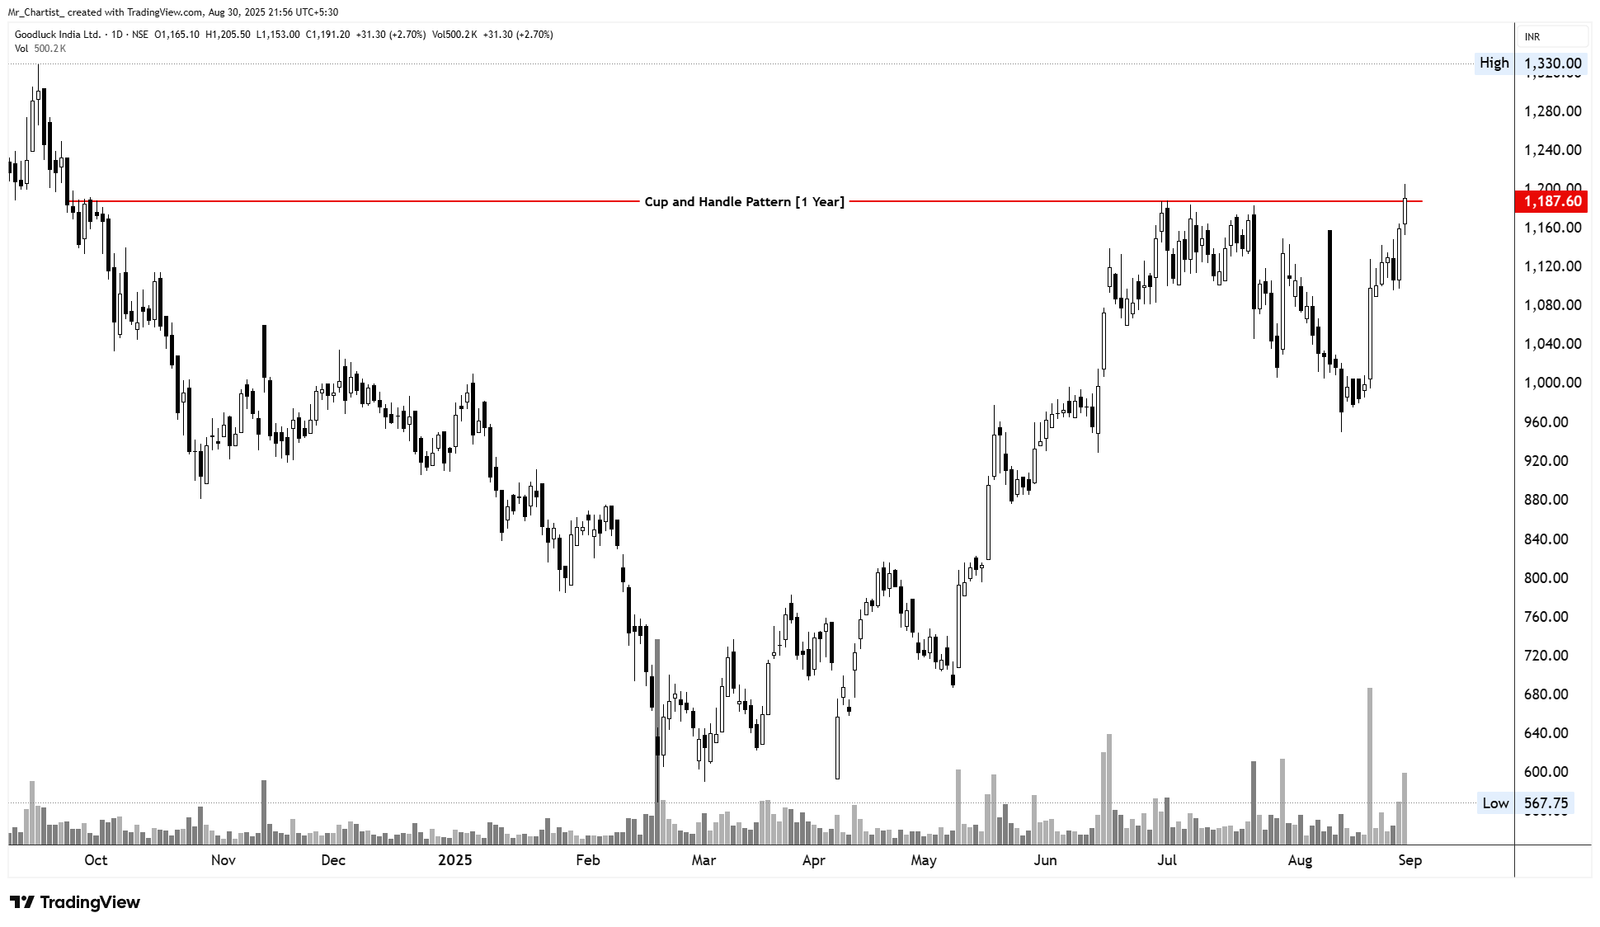
Goodluck India Ltd
cash bullishCup and Handle Pattern Breakout
1 Year (Daily Chart – Trend Continuation Pattern)
Thesis & Analysis
Goodluck India Ltd has completed and broken out of a 1-year Cup and Handle pattern, a classic bullish continuation formation. The breakout from the neckline at ₹1,187.60 is occurring after a well-formed rounded base followed by a brief handle consolidation, marking the resumption of the prior uptrend. This bullish breakout suggests a potential upside extension in the near to medium term, provided the breakout sustains above the neckline. Candlestick Behavior: Breakout candle is bullish, relatively large, and closes above the neckline with a strong body. Previous handle structure had small-bodied candles and decreasing volume – a textbook consolidation. The breakout follows a clean retest of demand near ₹1,000 during the handle phase. Volume Analysis: Volume increased notably on breakout, confirming buyer participation. Handle formation saw lower volumes, indicating weak supply – a bullish sign. Sustained volume above 400–500K would confirm continuation.
Price Action
No specific price action noted.
Volume Profile
No specific volume analysis noted.
Key Levels
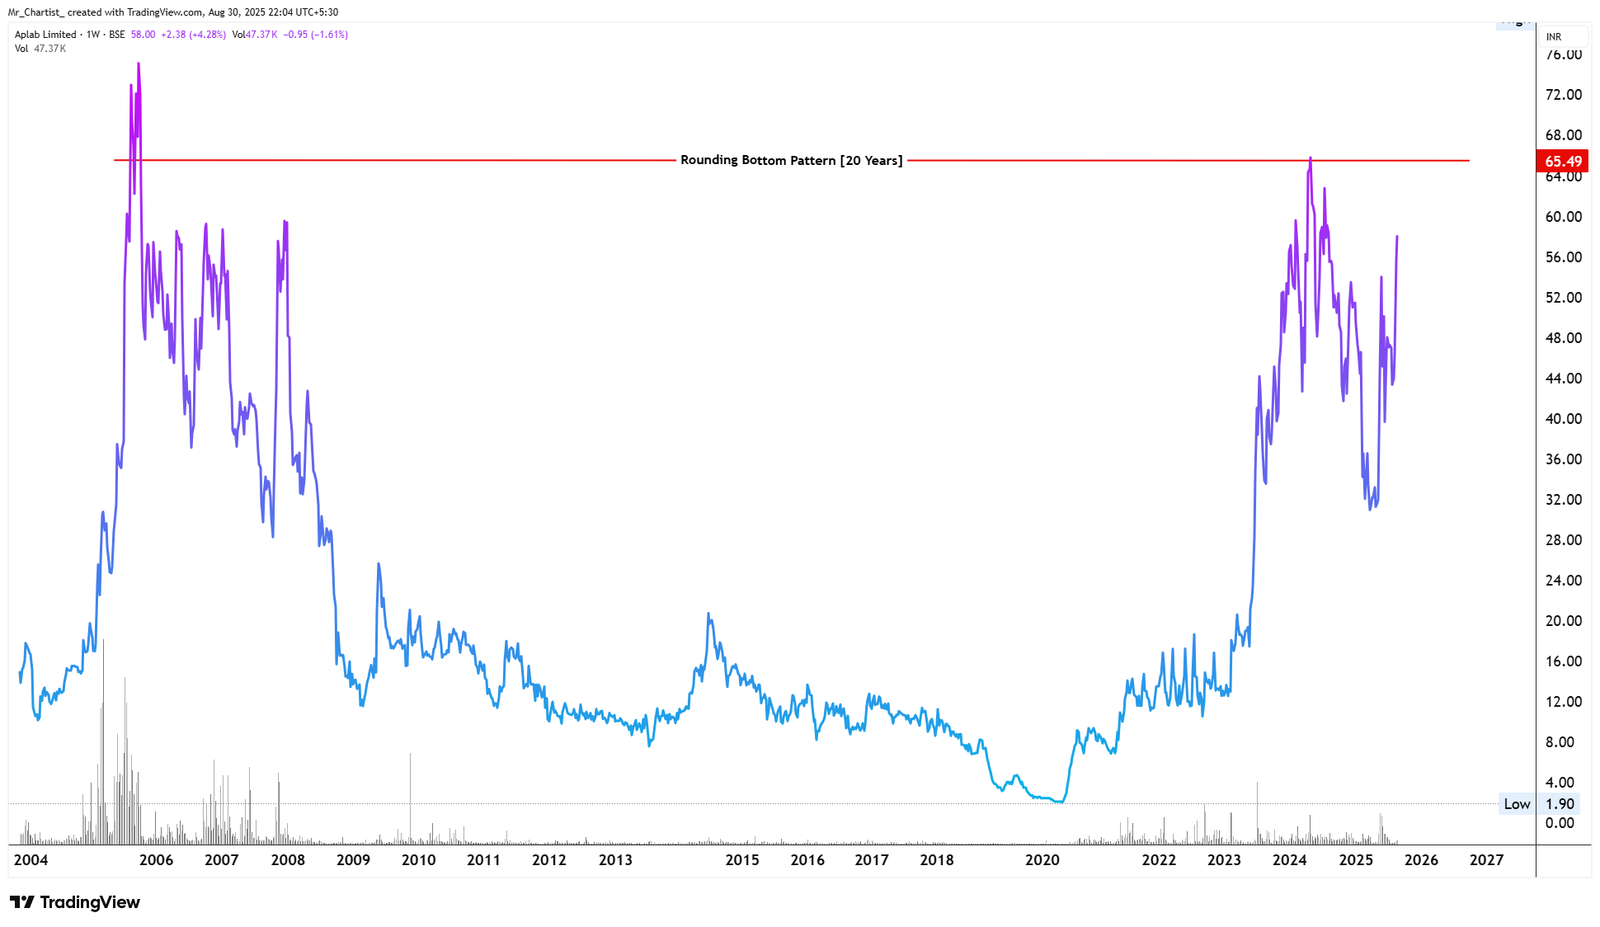
Aplab Limited
cash bullishRounding Bottom Pattern
20 Years (Weekly Chart – Multi-Decade Reversal)
Thesis & Analysis
Aplab Ltd is forming a rare 20-year Rounding Bottom pattern, a classic long-term reversal structure. After two decades of underperformance and a broad base, the stock has climbed significantly from its 2020 lows and is now testing the neckline resistance around ₹65.50. The pattern suggests a potential structural turnaround from a secular downtrend to a long- term uptrend. The final leg of the rounding structure is marked by a parabolic rise in 2023– 2024, followed by consolidation just below resistance. Candlestick Behavior: The price action in recent months has shown a series of higher highs and higher lows, aligning with breakout characteristics. Long upper wicks near resistance indicate selling pressure, but the base remains intact. Weekly candles show increased range and bullish closes in recent weeks. Volume Analysis: Volume has expanded meaningfully since 2022, especially during the sharp rally from sub-₹10 levels — indicating strong accumulation. Despite recent volatility, the volume base remains much higher than the past 15 years — confirming broader participation. A breakout above ₹65.50 with volume >100K would confirm the long-term reversal.
Price Action
No specific price action noted.
Volume Profile
No specific volume analysis noted.
Key Levels
Micro & Penny Cap Opportunities
High-risk, high-reward micro and penny cap setups
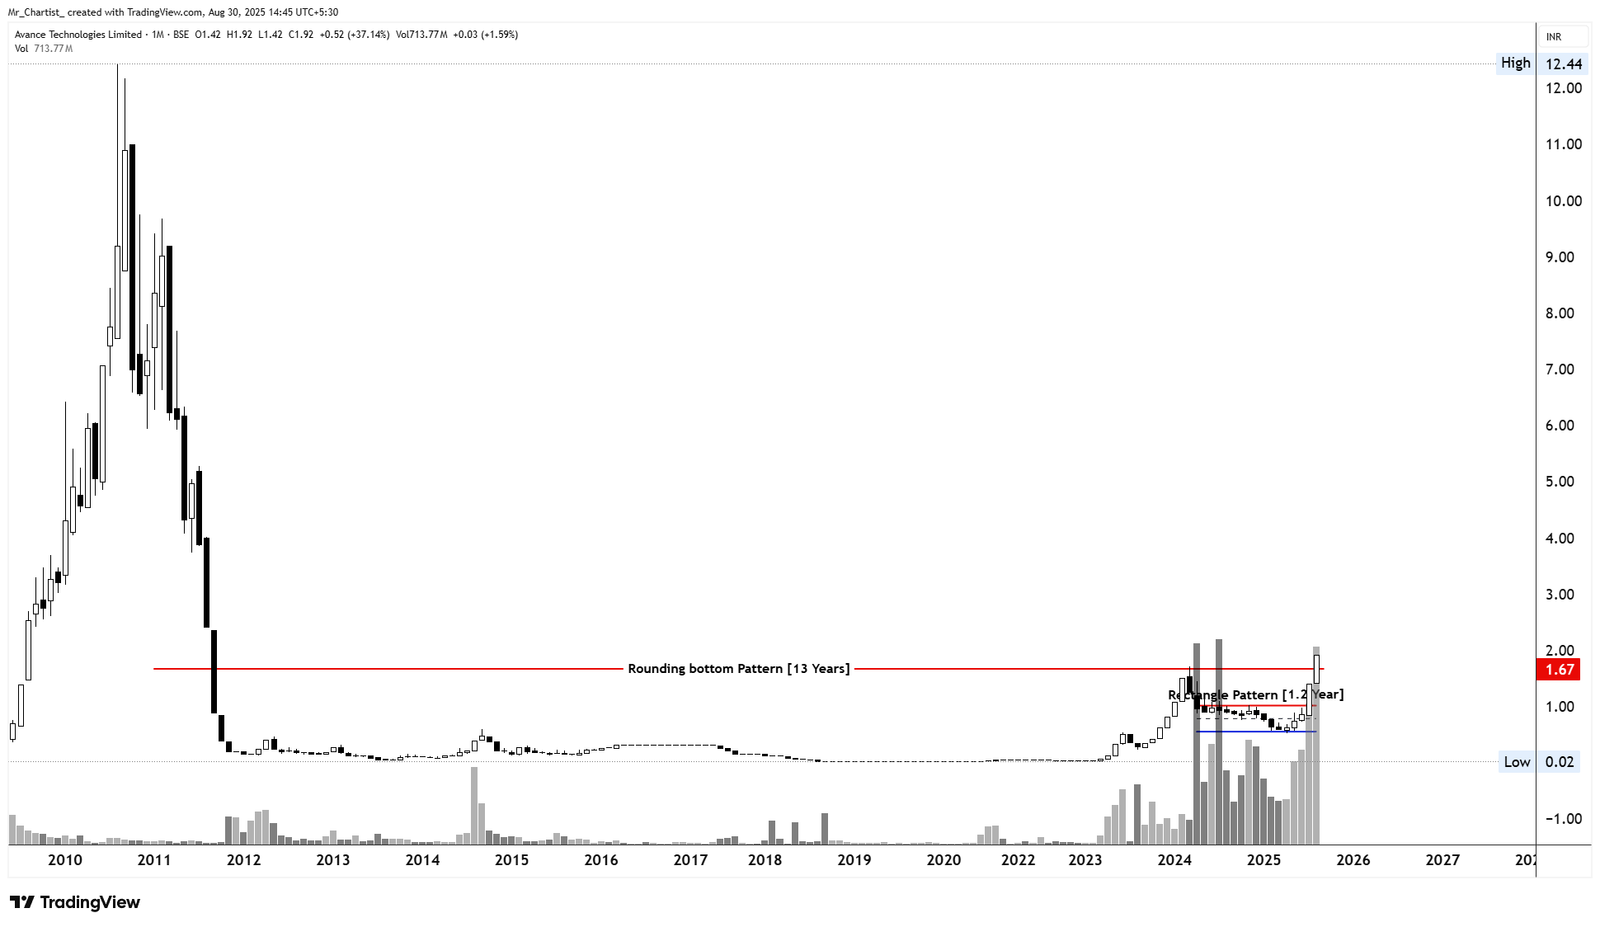
Avance Technologies Ltd
micro pennyRounding Bottom Pattern + Rectangle Breakout
13 Years (Monthly Chart – Long-Term Bottom Formation)
Thesis & Analysis
Avance Technologies Ltd has completed a 13-year Rounding Bottom formation, indicating a major structural reversal from a historic downtrend that began in 2010. The neckline at ₹1.67 — a multi-year resistance level — has recently been reclaimed after years of base building. Adding strength to this setup is a Rectangle Pattern breakout within the handle portion of the structure, lasting 1.2 years. This consolidation acted as a final accumulation phase before the breakout above ₹1.67. Candlestick Behavior: The recent monthly candle is large-bodied and bullish, closing strongly above the key resistance zone. The prior candles within the rectangle showed tightening ranges and wicks — indicative of absorption of supply before breakout. Price action now confirms intent to exit a long-term base. Volume Analysis: Breakout accompanied by one of the highest monthly volumes in the stock’s history — signaling institutional interest. Volume steadily built up over the past 2 years, a typical sign in base breakouts. Sustaining volume >500M would further confirm breakout strength.
Price Action
No specific price action noted.
Volume Profile
No specific volume analysis noted.
Key Levels
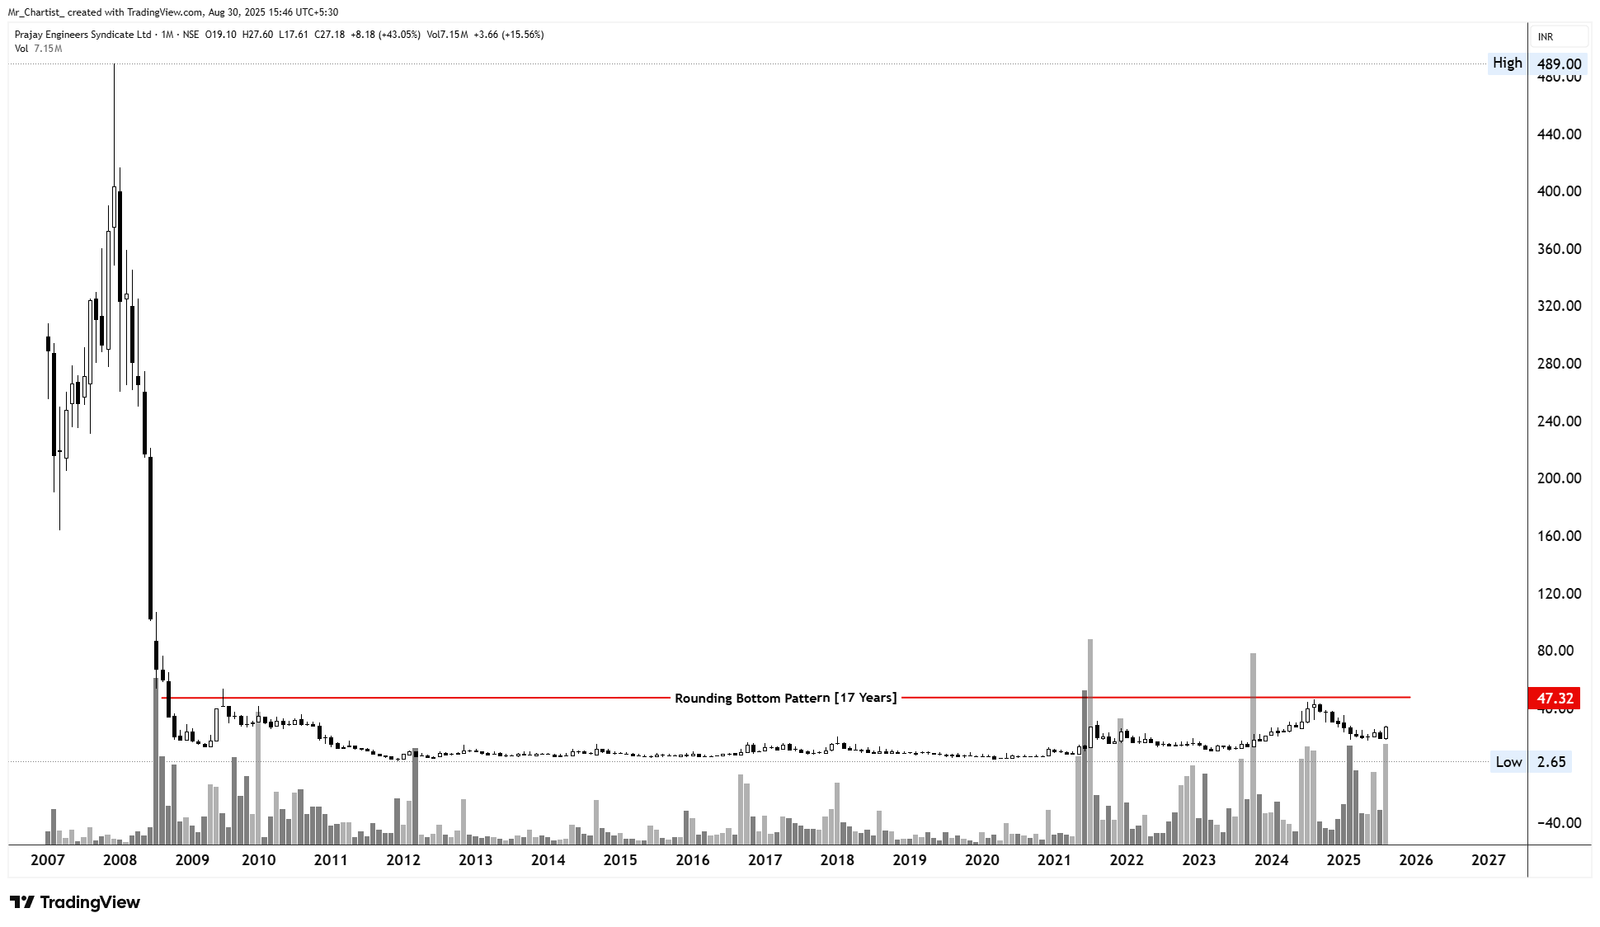
Prayag Engineers Syndicate Ltd
micro pennyRounding Bottom Pattern
17 Years (Monthly Chart – Ultra Long-Term Reversal Base)
Thesis & Analysis
Prayag Engineers Syndicate has been forming a massive rounding bottom pattern since 2007, marking a classic long-term base after a historic collapse from ₹489. The rounding structure reflects gradual accumulation over the years, slowly shifting the balance from sellers to buyers. The neckline resistance at ₹47.32 is a critical level—tested multiple times in the past few years but not convincingly breached. The current price action is staging another potential attempt at breakout after forming a higher base around ₹18– ₹20. Candlestick Behavior: The recent monthly candle is a strong bullish bar with a wide range and significant volume—potentially initiating the next leg up. Multiple inside bars and tight ranges in previous candles represent healthy consolidation before this breakout attempt. No visible supply shadows in recent candles—suggesting clean upward movement. Volume Analysis: Volume spikes during rallies, especially around ₹45–₹47 zones, indicate major interest from institutional buyers. Current volume ranks among the highest in recent years—a major sign of renewed participation. Sustained volume over 5M monthly would be key for a confirmed breakout above ₹47.
Price Action
No specific price action noted.
Volume Profile
No specific volume analysis noted.
Key Levels
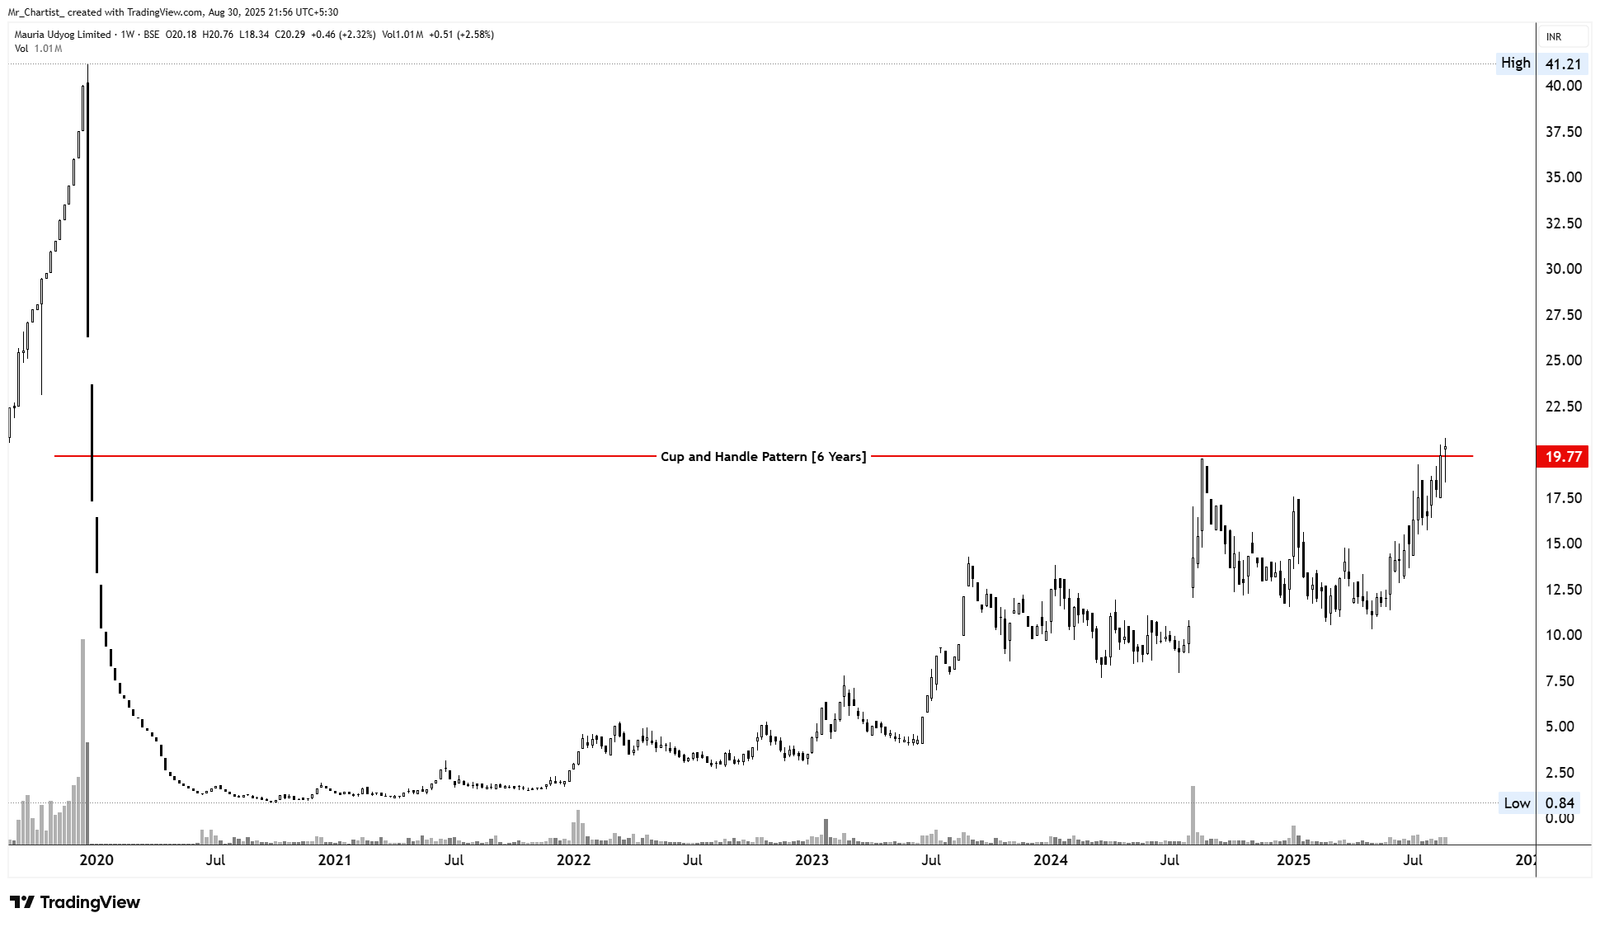
Mauria Udyog Limited
micro pennyCup and Handle Pattern
6 Years (Weekly Chart – Long-Term Reversal Setup)
Thesis & Analysis
Mauria Udyog has developed a well-formed Cup and Handle pattern over a 6-year span, indicating a strong accumulation base post a major decline in 2019. The neckline at ₹19.77 has been a key resistance level, tested multiple times over the years and now challenged again with strength. The handle portion saw a healthy consolidation between ₹12–₹16, creating a final shakeout before the breakout attempt. Candlestick Behavior: This week’s candle attempted to break above the neckline with a strong body but closed just below it—suggesting the possibility of minor hesitation or a small retest before confirmation. Recent candles have shown higher highs and higher lows with growing momentum. Volume Analysis: Volume has been rising steadily during the recent upmove, confirming growing interest. A breakout above ₹20 with a weekly close backed by volume above 1.5M would validate the pattern’s completion.
Price Action
No specific price action noted.
Volume Profile
No specific volume analysis noted.
Key Levels
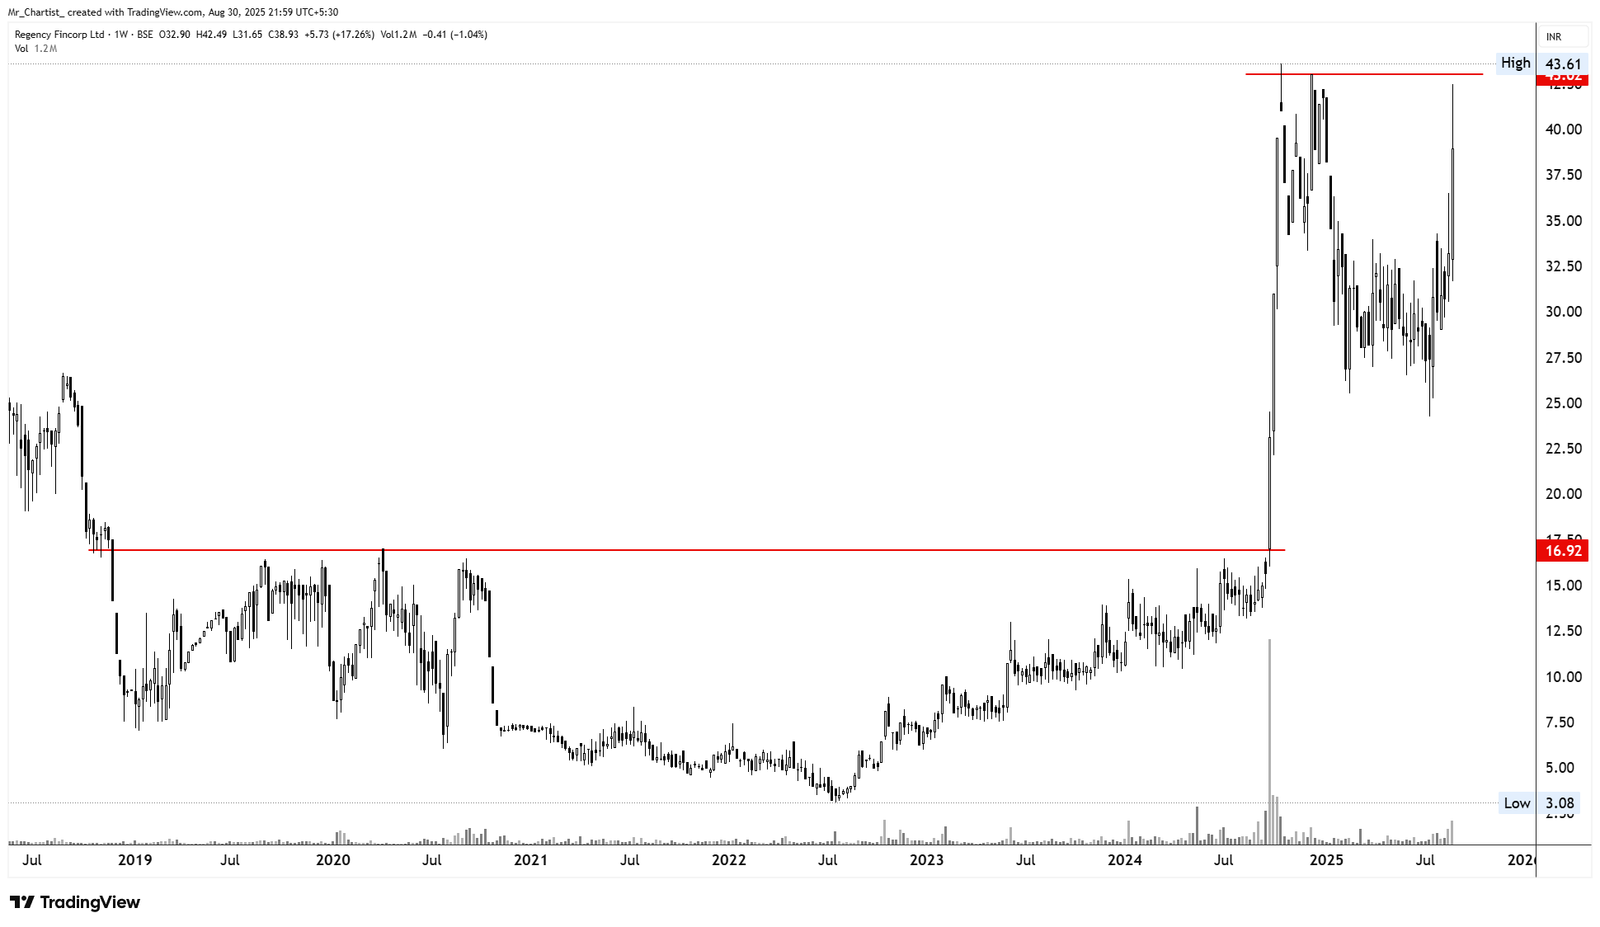
Regency Fincorp Ltd
micro pennyMulti-Year Breakout & Post-Breakout Consolidation
6 Years (Weekly Chart – Structural Breakout Follow-Through)
Thesis & Analysis
Regency Fincorp broke out above a long-standing horizontal resistance at ₹16.92, marking the end of a 5+ year base structure. This level had repeatedly acted as a strong ceiling since 2018. After the breakout in early 2025, the stock witnessed a sharp vertical rally toward ₹43.61, forming a swift pole. It has since consolidated in a volatile, choppy range between ₹26 and ₹40, digesting gains. Candlestick Behavior: The recent bullish candle shows strong follow-through from support near ₹30, suggesting the potential start of the next leg higher. Price is approaching the prior high of ₹43.61; a breakout above this would signal a continuation. Volume Analysis: Volume spiked significantly on the breakout above ₹17, confirming institutional buying interest. Post-breakout, volume normalized during consolidation — a healthy digestion phase.
Price Action
No specific price action noted.
Volume Profile
No specific volume analysis noted.
Key Levels
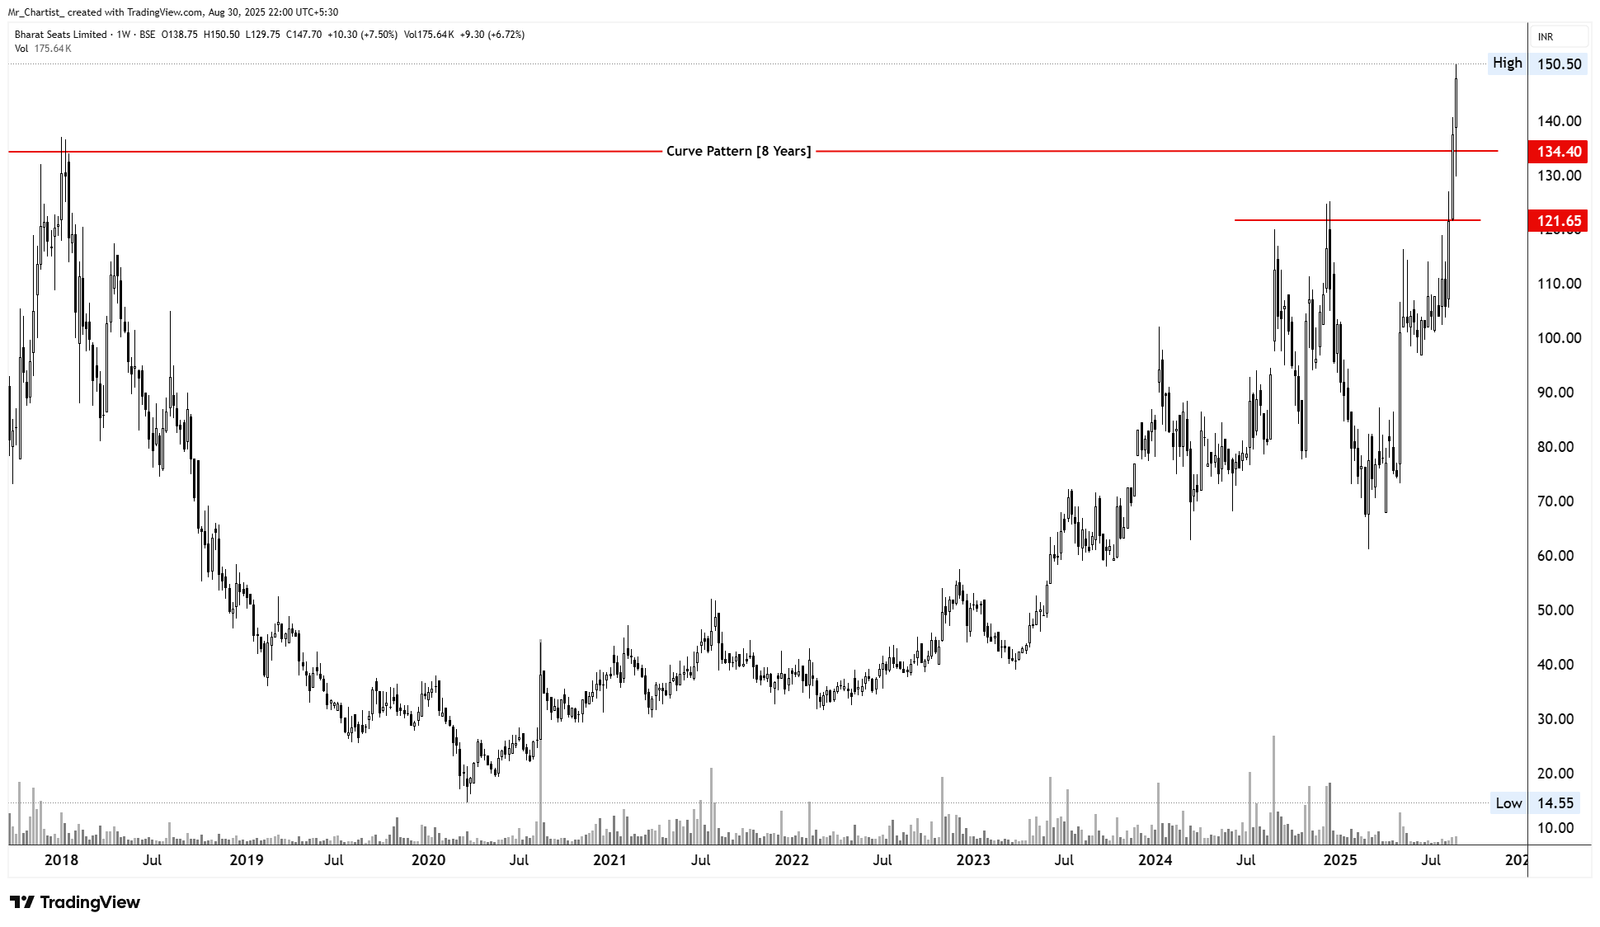
Bharat Seats Ltd
micro pennyCurve (Rounded Bottom) Pattern
8 Years (Weekly Chart – Long-Term Reversal)
Thesis & Analysis
Bharat Seats Ltd has formed a classic Curve or Rounding Bottom pattern over an 8-year period, signaling a slow but steady transition from a downtrend into a powerful uptrend. The neckline of this pattern was at ₹134.40, a level tested multiple times since 2018. The stock recently gave a strong breakout above ₹134.40, accompanied by increased volume, confirming long-term trend reversal and bullish control. Candlestick Behavior: The recent bullish candle broke above both the 8-year neckline and the intermediate swing high at ₹121.65. The latest candle touched ₹150.50 before closing a bit lower, showing slight profit booking post-breakout. Volume Analysis: Volume expanded on breakout above ₹134.40, suggesting strong institutional participation. No signs of exhaustion in volume yet; continued momentum possible.
Price Action
No specific price action noted.
Volume Profile
No specific volume analysis noted.
Key Levels
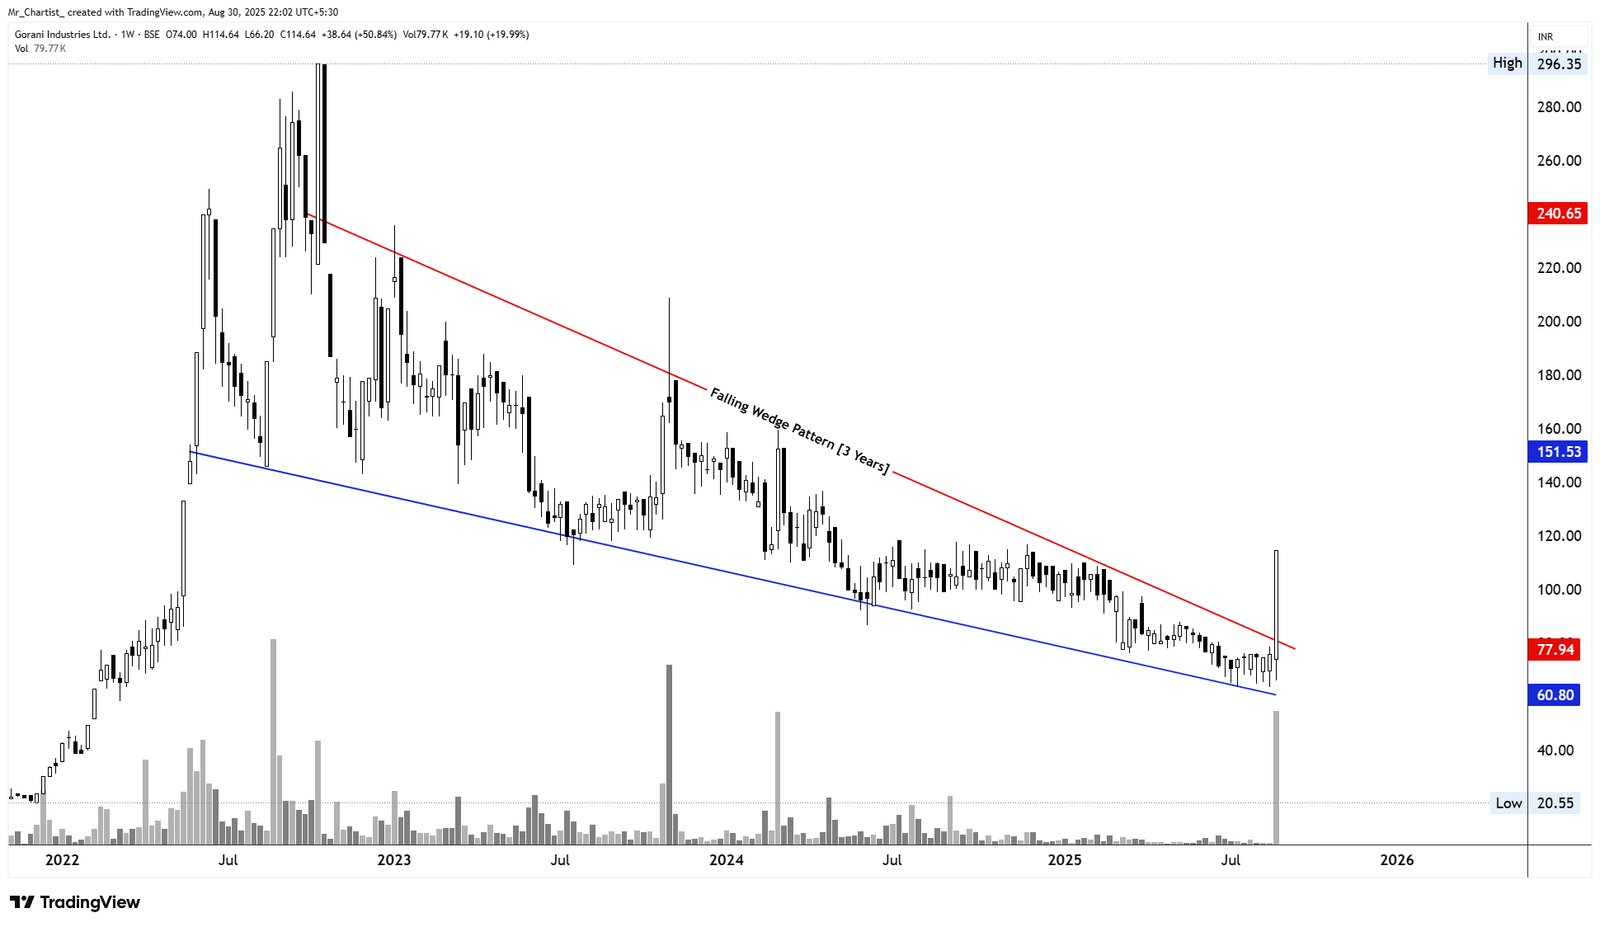
Gorani Industries Ltd
micro pennyFalling Wedge Pattern
3 Years (Weekly Chart – Long-Term Reversal)
Thesis & Analysis
Gorani Industries has been confined within a falling wedge for over 3 years, a pattern typically viewed as bullish when it breaks to the upside. The recent candle decisively broke above the wedge’s upper resistance (₹77.94) on a sharp gain of nearly 20%. However, volume remains significantly low, which raises caution about the strength and sustainability of the breakout. Candlestick Behavior: Strong wide-range bullish candle (+19.99%) breaking out of a tightly compressed wedge. Price surged from the wedge base near ₹60 to close around ₹114.64 in one week. Next resistance lies significantly higher, creating ample upside space—if sustained. Volume Analysis: Despite the breakout, volume is relatively low compared to past spikes and general breakout norms. The lack of broad participation is a red flag for conviction. May be vulnerable to a fakeout or sharp retracement if follow-up volume doesn't support.
Price Action
No specific price action noted.
Volume Profile
No specific volume analysis noted.
Key Levels
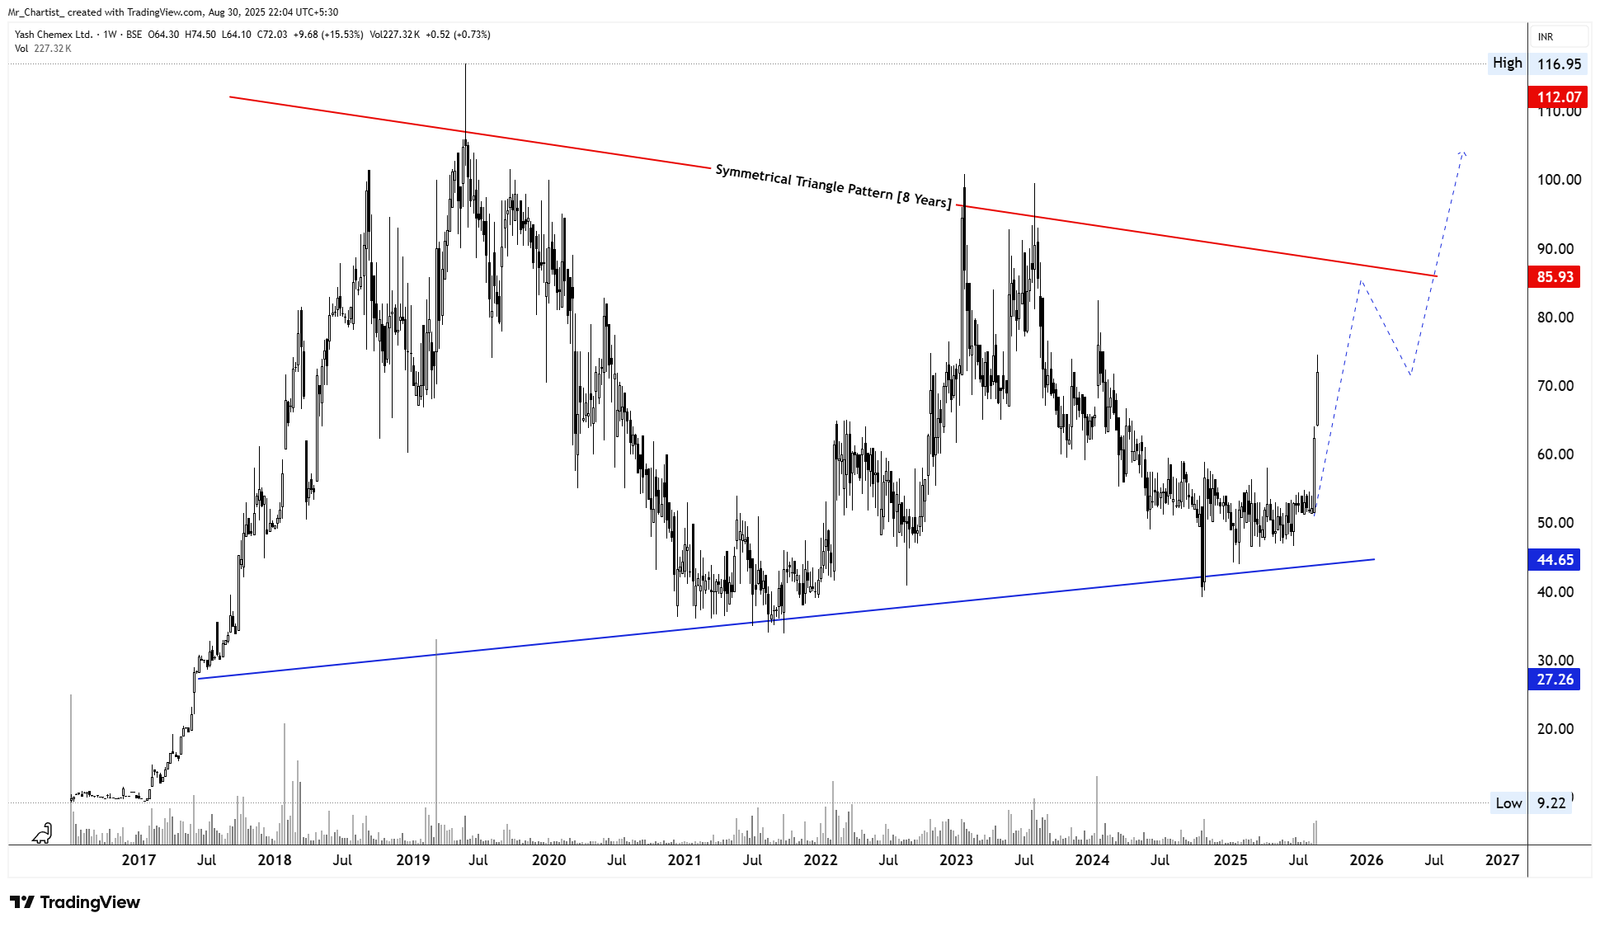
Yash Chemex Ltd
micro pennySymmetrical Triangle Pattern
8 Years (Weekly Chart – Long-Term Consolidation Breakout Candidate)
Thesis & Analysis
Yash Chemex has been consolidating within a symmetrical triangle for 8 years, forming lower highs and higher lows converging toward an apex. The stock has recently bounced sharply from the lower trendline near ₹44.65, indicating a potential pre- breakout buildup. Candlestick Behavior: Recent candles show an explosive vertical move from ₹50 to ₹72 within a few weeks. Long-range bullish bars with rising volume, testing mid-triangle resistance around ₹72–₹76. Near-term trajectory suggests momentum could carry the stock toward the upper triangle boundary at ₹85.93. Volume Analysis: Volume expanded to 227.3K, which is significantly higher than the triangle’s average volumes over the past few years. Sustained buying above ₹76–₹80 on higher volume would confirm a pattern breakout.
Price Action
No specific price action noted.
Volume Profile
No specific volume analysis noted.
Key Levels
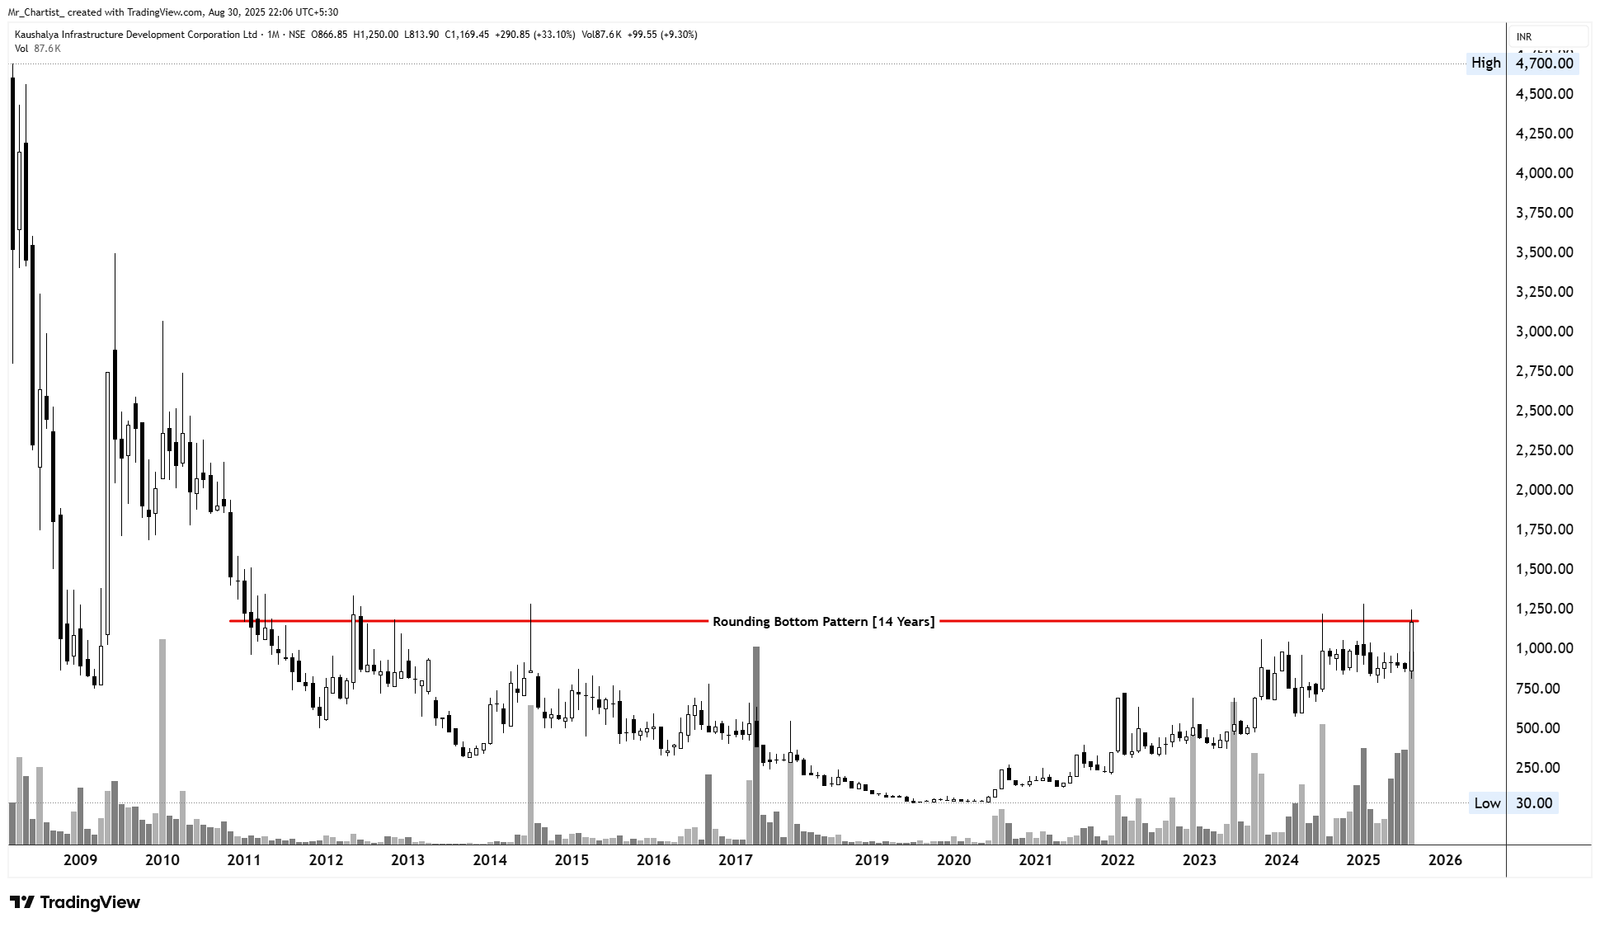
Kaushalya Infrastructure Development Corp Ltd
micro pennyRounding Bottom Pattern Breakout
14 Years (Monthly Chart – Long-Term Reversal Structure)
Thesis & Analysis
Kaushalya Infra has broken out of a 14-year Rounding Bottom — a powerful bullish reversal pattern that signals a potential shift from a prolonged downtrend to a fresh long-term uptrend. The breakout above the neckline near ₹1,250 is backed by increasing volume and a long accumulation base, marking a structural change in trend. This multi-year base formation often leads to strong directional moves once neckline resistance is breached, and the current breakout candle has strong conviction characteristics. Candlestick Behavior: The breakout candle is large, bullish, and closes near the highs of the month. Minimal upper wick suggests strong buying interest and no major supply overhead. The pattern shows clear contraction and breakout from a low-volatility zone into expansion. Volume Analysis: Volume surged significantly in the breakout month – a vital confirmation for a long-term breakout. Past few quarters show steadily increasing volume – classic base-building behavior. Sustained monthly volume above 75K–100K will strengthen the conviction of the trend.
Price Action
No specific price action noted.
Volume Profile
No specific volume analysis noted.
Key Levels
SEBI Registered Research Analyst — INH000015297 (INVESTOLOGY). Investment in securities market are subject to market risks. Read all related documents carefully before investing. The content provided is for educational purposes only and should not be considered as financial advice. Past performance is not indicative of future results.