Strategy Tester & Replay Trading
Backtesting strategies, paper trading, and connecting to live brokers.
Mr. Chartist Workflow
Read with a trading desk mindset.
Every TradingView article now follows a practical pattern: understand the tool, map it to a charting workflow, apply it on Indian market instruments, and turn it into a repeatable workspace habit.
8
Sections
7m
Read
bottom
Level
Open a clean chart and locate the exact TradingView area covered in "Strategy Tester & Replay Trading".
Apply it on one liquid NSE stock, one index, and one weekly timeframe so the concept is not learned in isolation.
Save the layout, write one note about what improved your decision-making, and remove anything that adds noise.
TradingView provides a complete, end-to-end pipeline for transforming a raw trading idea into a validated, executable strategy: Research → Backtest → Practice → Execute. The Strategy Tester, Replay Trading, Paper Trading, and Live Broker Integration are the four stages of this pipeline.
Most retail traders skip directly from 'I think this pattern works' to 'I just risked ₹50,000 on it.' The professional approach is radically different: you write your hypothesis as a Pine Script strategy, backtest it against decades of historical data, validate the equity curve and drawdown metrics, practice it in a simulated environment, and only then deploy real capital.
In this extensive guide, we will walk through every stage of this pipeline in granular detail—from understanding backtesting metrics like Profit Factor and Sharpe Ratio, to using Replay Trading for discretionary practice, to connecting your Dhan or Fyers broker for live execution directly from the chart.
1. The Professional Trading Pipeline
Before diving into individual tools, it is critical to understand how they fit together as a unified workflow. Each tool in TradingView's bottom panel addresses a specific stage in the professional trading development cycle.
Stage 1 (Research): Use the Stock Screener and chart analysis to identify a potential trading edge. Stage 2 (Backtest): Encode that edge as a Pine Script strategy() and run it against historical data using the Strategy Tester. Stage 3 (Practice): Use Paper Trading or Replay Trading to simulate the strategy in real-time or historical conditions without risk. Stage 4 (Execute): Connect a live broker and deploy the validated strategy with real capital.
Alt+S
2. Strategy Tester: The Backtesting Engine
The Strategy Tester is TradingView's built-in backtesting engine. It activates automatically whenever you apply a Pine Script that uses the `strategy()` declaration (as opposed to `indicator()`). The key difference: `indicator()` scripts can only plot visual data on the chart, while `strategy()` scripts gain access to the `strategy.*` namespace—functions like `strategy.entry()`, `strategy.exit()`, and `strategy.close()` that simulate actual order execution.
When you add a strategy to your chart, TradingView replays every historical bar, executing your buy/sell logic as if you were trading in real-time. The Strategy Tester panel then generates a comprehensive performance report across four sub-tabs: Overview, Performance Summary, List of Trades, and the visual Equity Curve.
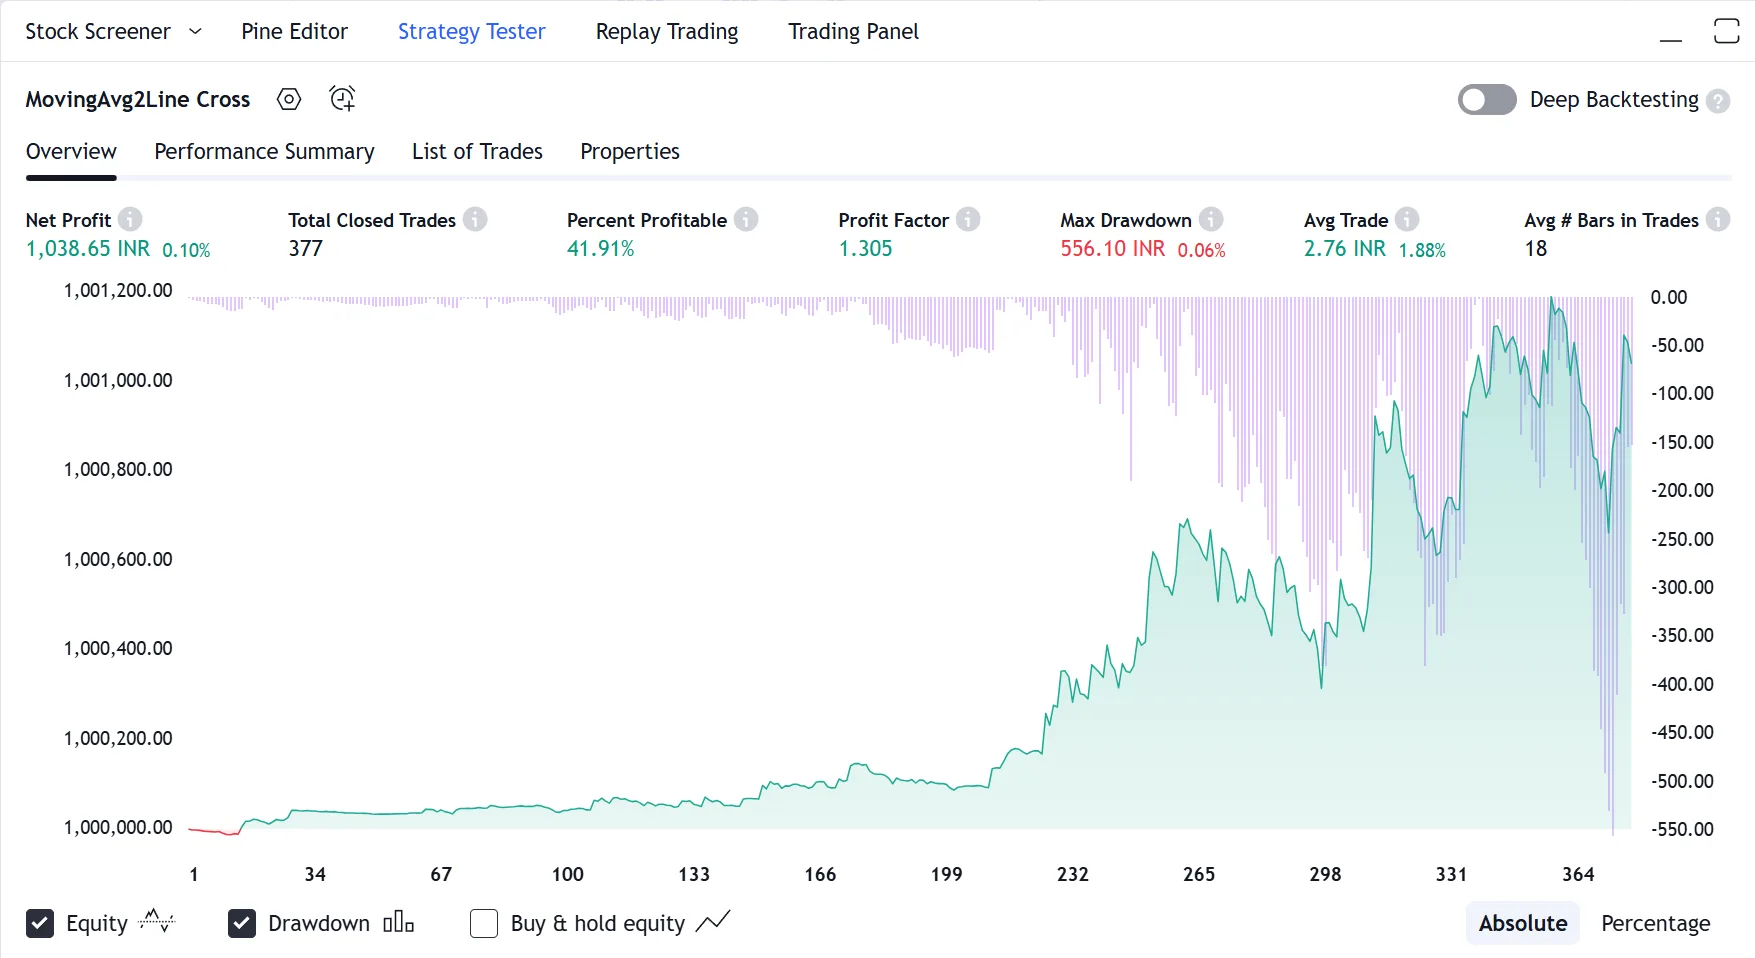
Overview Tab
- Net Profit: Total P&L after all simulated trades.
- Total Closed Trades: How many round-trip trades were executed.
- Percent Profitable (Win Rate): % of trades that ended in profit.
- Profit Factor: Gross Profit ÷ Gross Loss.
Equity Curve & Drawdown
- Visual graph of your account balance over the entire backtest period.
- Drawdown chart showing peak-to-trough declines.
- Smooth, upward-sloping equity = robust strategy.
- Erratic, volatile equity = unreliable or curve-fitted strategy.
List of Trades
- Chronological record of every simulated entry and exit.
- Shows exact entry/exit price, timestamp, and P&L per trade.
- Click any trade to jump to that exact candle on the chart.
- Invaluable for reviewing WHY specific trades won or lost.
3. Understanding Backtesting Metrics
Raw numbers are meaningless without context. A strategy showing '+₹5,00,000 Net Profit' sounds impressive, but if it required a ₹10,00,000 Max Drawdown to achieve it, the strategy is dangerously fragile. Here is how to interpret every critical metric like a professional fund manager.
The Profit Factor is the single most important number. It is calculated as Gross Profit divided by Gross Loss. A Profit Factor of 1.0 means you break even. Below 1.0, you are losing money. Above 1.5 is considered viable. Above 2.0 is excellent. A Profit Factor of 3.0+ is exceptional but should be viewed with suspicion—it may indicate overfitting.
The Sharpe Ratio measures risk-adjusted return. A strategy that returns 50% annually with 5% drawdown has a vastly superior Sharpe compared to one that returns 50% annually with 40% drawdown. A Sharpe above 1.0 is acceptable. Above 1.5 is good. Above 2.0 is institutional-grade.
| Features | TradingView | Traditional Brokers |
|---|---|---|
| Net Profit | Total P&L after commissions | Must be positive |
| Profit Factor | Gross Profit ÷ Gross Loss | > 1.5 = viable, > 2.0 = excellent |
| Max Drawdown | Largest peak-to-trough decline | < 20% = manageable risk |
| Sharpe Ratio | Risk-adjusted return metric | > 1.0 = acceptable, > 2.0 = great |
| Win Rate | % of profitable trades | 45% with 1:3 R:R > 90% with 1:0.1 R:R |
| Avg Trade | Average P&L per trade | Must exceed commission costs |
Critical Warning
Do NOT optimize for a 90% Win Rate. A 45% win rate with a 1:3 risk-reward ratio mathematically outperforms a 90% win rate with a 1:0.1 risk-reward ratio. Focus on Profit Factor and the shape of the Equity Curve, not the raw win percentage.
4. Backtesting Pitfalls: Avoiding Self-Deception
A backtest is a simulation, not a guarantee. The financial markets are filled with strategies that looked incredible on historical data but collapsed immediately in live trading. Understanding the common pitfalls is essential to avoid this trap.
Overfitting (or 'curve-fitting') is the most dangerous trap. It occurs when you optimize your strategy's parameters so precisely that they perfectly fit the specific historical data you tested on, but fail completely on new, unseen data. If your strategy has 15 adjustable parameters and you've fine-tuned each one to maximize profit on the last 3 years of data, you have almost certainly overfit.
Candle-close execution is another critical limitation. Standard backtesting in TradingView executes orders at the close of each candle. It does not simulate what happens inside the candle. A strategy might show a profitable entry at the close of a 1-hour candle, but in reality, the intra-candle price action may have hit your stop-loss before the close price was ever reached.
Snapshot & Takeaways
5. Replay Trading: The Discretionary Practice Lab
While the Strategy Tester evaluates algorithmic strategies, Replay Trading is designed for discretionary traders—those who rely on visual pattern recognition and manual decision-making rather than coded rules.
Replay Trading is an enhanced version of Bar Replay. When activated, a Buy/Sell panel appears directly on your chart. As historical candles print one by one, you can place simulated Market orders, set Stop-Loss and Take-Profit brackets by dragging lines on the chart, and watch your hypothetical P&L fluctuate in real-time.
Unlike Paper Trading (which operates on the live market), Replay Trading operates entirely on historical data. This means you can practice 100 trade setups in a single afternoon by replaying different historical periods—compressing months of screen time into hours of deliberate practice.
At the end of each session, TradingView generates a complete trade log showing your entries, exits, win rate, and total P&L for that specific historical period. This is the ultimate training ground for building the psychological discipline required for live execution.
Professional Tip
Replay a random, unknown week of Bank Nifty from 2 years ago. If your 'system' cannot generate consistent results on out-of-sample historical data that you've never seen before, your approach is either curve-fitted to recent conditions or influenced by hindsight bias.
6. Paper Trading: Risk-Free Live Simulation
Trade virtual money with realistic broker simulation — zero risk.
Paper Trading operates on the live, real-time market—but with virtual capital (default: $100,000 USD). You can place Market, Limit, Stop, and Stop-Limit orders. You can attach bracket orders (Take-Profit + Stop-Loss) to any position. You can manage multiple open positions simultaneously. Every order fills against the actual live market data, giving you the closest possible simulation of real trading without financial risk.
The Trading Panel displays your portfolio summary, open positions with live P&L, working orders, and full trade history. You can reset your paper account at any time to start fresh.
Supported Order Types
- Market Orders: Instant execution at current price.
- Limit Orders: Execute at a specific price or better.
- Stop Orders: Trigger a market order when a stop price is hit.
- Stop-Limit: Trigger a limit order when a stop price is hit.
- Bracket Orders: Attach TP and SL to any position.
Why Paper Trade?
- Test a new strategy on live data before risking real capital.
- Practice order management: adding to winners, scaling out.
- Build confidence in your execution speed and decision-making.
- Diagnose psychological weaknesses (e.g., cutting winners too early).
- Recommended minimum: 3 months before going live.
If you cannot generate consistent paper trading profits over 3 months, you are not ready for live trading. Paper Trading is not an optional step—it is a mandatory prerequisite.
7. Live Broker Integration: From Chart to Execution
The final stage of the pipeline is connecting a live brokerage account. TradingView integrates with 100++ brokerages worldwide, including Indian-specific platforms.
For Indian traders, the supported brokers include Dhan, Fyers, Kotak Securities. Once connected via secure OAuth authentication, you can place real orders, manage live positions, and monitor your portfolio—all without leaving the TradingView chart.
The critical advantage of broker integration is the elimination of context-switching. Instead of identifying a setup on TradingView, then opening your broker's separate terminal, then manually entering the ticker, quantity, and price, you simply click the Buy/Sell button directly on the chart where your analysis lives. This reduces execution latency and eliminates the risk of data entry errors.
Dhan
- Full integration with TradingView charts. Popular choice for Indian retail traders.
- OAuth-based secure authentication
- Real-time order sync with exchange
Fyers
- Direct integration with order execution from TradingView.
- OAuth-based secure authentication
- Real-time order sync with exchange
Kotak Securities
- One of India's largest brokerages with TradingView integration.
- OAuth-based secure authentication
- Real-time order sync with exchange
8. Deep Backtesting: Maximum Historical Depth
Standard backtesting in TradingView only tests your strategy against the bars currently loaded on your chart (typically a few thousand bars depending on the timeframe). For a 5-minute chart, this might only cover a few months of data—far too little for statistical significance.
Deep Backtesting (available on Premium and Ultimate plans) solves this by running your strategy against the maximum available historical data on TradingView's servers, regardless of what is loaded on your chart. This can mean testing against 10+ years of 5-minute data or 30+ years of daily data.
The result is a far more statistically robust performance report. A strategy that shows a Profit Factor of 1.8 over 30 years and 5,000 trades is vastly more reliable than one showing a Profit Factor of 3.0 over 6 months and 50 trades.
Professional Tip
After running a Deep Backtest, examine the equity curve for 'regime changes'. If your strategy was profitable from 2010-2020 but started losing money in 2021, the market regime may have shifted. This is critical intelligence that surface-level backtesting would never reveal.
Unlock TradingView Pro
Gain unrestricted access to multiple charts, custom timeframes, and unlimited technical indicators to perfect your edge.
Frequently Asked Questions
Common questions about this topic
Apply any strategy indicator to your chart (search 'strategy' in the indicators menu, or write your own in Pine Script using the strategy() declaration). TradingView automatically runs it against historical data and displays results in the Strategy Tester panel at the bottom. View Net Profit, Profit Factor, Max Drawdown, Sharpe Ratio, Win Rate, the equity curve, and a chronological list of every simulated trade.
Official TradingView Resources
Curated links from TradingView's Help Center & Blog
What is bar magnifier backtesting mode
You can obtain more realistic order fills in your strategy backtesting by using the "Bar Magnifier" option. This tool uses intrabar inspection to give...
What are strategies, backtesting and forward testing?
Strategies are specific scripts, written in Pine Script language, which are able to send, modify, execute, and cancel buy or sell orders and simulate ...
How Deep Backtesting works
Deep Backtesting allows you to test strategies using all available historical data for a selected symbol, rather than being limited to the data curren...
Why are the results of Deep Backtesting not shown on the chart?
Trades visible on the chart are always calculated without Deep Backtesting, whether it has been enabled or not.Trades calculated when Deep Backtesting...
Backtest more accurately with the Bar Magnifier
Read fresh TradingView updates: Backtest more accurately with the Bar Magnifier. Discover more in our blog and stay connected with the latest platform news.
Understanding The New Strategy Tester Report
Read fresh TradingView updates: Understanding The New Strategy Tester Report. Discover more in our blog and stay connected with the latest platform news.
Dive into the world of Deep Backtesting (BETA)
Read fresh TradingView updates: Dive into the world of Deep Backtesting (BETA). Discover more in our blog and stay connected with the latest platform news.
Deep Backtesting is out of beta
Read fresh TradingView updates: Deep Backtesting is out of beta. Discover more in our blog and stay connected with the latest platform news.
Related Articles
Continue your learning journey
Bar Replay & Backtesting
Practice trading with historical data in a risk-free simulation environment.
ModuleStock Screener & Pine Script Editor
Filtering thousands of stocks and building custom indicators with Pine Script.
ModulePaper Trading Simulator
How to use TradingView's built-in virtual environment to practice strategies risk-free.
ModuleConnecting Indian Brokers
A step-by-step guide to connecting Dhan, Fyers, and others directly to the Trading Panel.

Written By
Rohit Singh
Mr. Chartist
With 14+ years of experience in Indian financial markets, Rohit Singh (Mr. Chartist) is a SEBI Registered Research Analyst, Amazon #1 bestselling author, and the founder of Investology — a premium trading ecosystem trusted by a 1.5 Lakh+ strong community across India.
TradingView is a registered trademark of TradingView, Inc. All screenshots, logos, and platform imagery are the property of TradingView, Inc. and are used here for educational purposes only under fair use. This content is not affiliated with, endorsed, or sponsored by TradingView.
(c) 2026 TradingView, Inc. All rights reserved. - www.tradingview.com