Stock Screener & Pine Script Editor
Filtering thousands of stocks and building custom indicators with Pine Script.
Mr. Chartist Workflow
Read with a trading desk mindset.
Every TradingView article now follows a practical pattern: understand the tool, map it to a charting workflow, apply it on Indian market instruments, and turn it into a repeatable workspace habit.
8
Sections
7m
Read
bottom
Level
Open a clean chart and locate the exact TradingView area covered in "Stock Screener & Pine Script Editor".
Apply it on one liquid NSE stock, one index, and one weekly timeframe so the concept is not learned in isolation.
Save the layout, write one note about what improved your decision-making, and remove anything that adds noise.
The Bottom Menu is where TradingView transforms from a charting tool into a complete research, screening, and algorithmic development workstation. It houses 7 multi-asset screener types with 400+ filter fields, the Pine Script v6 integrated development environment, the Strategy Tester backtesting engine, and the Trading Panel for live and simulated execution.
While the Top Menu and Left Toolbar handle visual analysis, the Bottom Menu handles computational analysis—scanning thousands of instruments in real-time, writing custom indicator code, backtesting decades of historical data, and connecting directly to your brokerage for order execution.
In this extensive guide, we will dissect every tab in the Bottom Menu, walk through the professional workflow for building custom stock screeners for the Indian equity market, explain how Pine Script empowers non-programmers to create institutional-grade tools, and demonstrate the full backtesting pipeline from code to equity curve.
1. The Bottom Menu: 5 Power Tabs
The Bottom Menu is a collapsible panel that sits directly below the chart canvas. Click any tab label to expand it upward, revealing its full interface. The panel can be resized by dragging its top edge, giving you as much or as little screen real estate as you need.
Each tab represents an entirely separate analytical engine. Understanding what lives in each tab prevents you from hunting through menus when you need to switch workflows.
Stock Screener
- 7 screener types (Stock, Forex, Crypto, ETF, Bond, DEX, Coins).
- 400+ fundamental and technical filter fields.
- Real-time auto-refresh during market hours.
Pine Script Editor
- Version v6 with full cloud IDE.
- 150,000+ community scripts published.
- Syntax highlighting, autocomplete, and runtime logging.
Strategy Tester
- Full backtesting engine with equity curve visualization.
- Performance metrics: Sharpe Ratio, Profit Factor, Max Drawdown.
- Trade-by-trade breakdown with entry/exit timestamps.
Trading Panel
- Paper Trading simulator (risk-free).
- Live broker connections (Dhan, Fyers, etc.).
- Full order management from the chart.
| Features | TradingView | Traditional Brokers |
|---|---|---|
| Custom Filters | Code your own in Pine Script | Pre-defined dropdowns only |
| Refresh Rate | Real-time ticking | End-of-day or 15m delay |
| Chart Integration | Click result to load chart instantly | Copy-paste tickers manually |
1//"text-[#">2962ff] font-bold">@version="text-[#089981]">52indicator("Screener Condition")3fastMA = ta.sma(close, "text-[#089981]">50)4slowMA = ta.sma(close, "text-[#089981]">200)56// True when fast crosses over slow7bullCross = ta.crossover(fastMA, slowMA)8"text-[#">2962ff] font-bold">plotshape(bullCross, style=shape.triangleup, color=color.green, size=size.large)Simple Moving Average Crossover Screener Condition
The Stock Screener finds opportunities. Pine Script builds the edge. Together, they form the most powerful automated scanning pipeline available to retail traders.
Official Resources
2. Stock Screener: The Discovery Engine
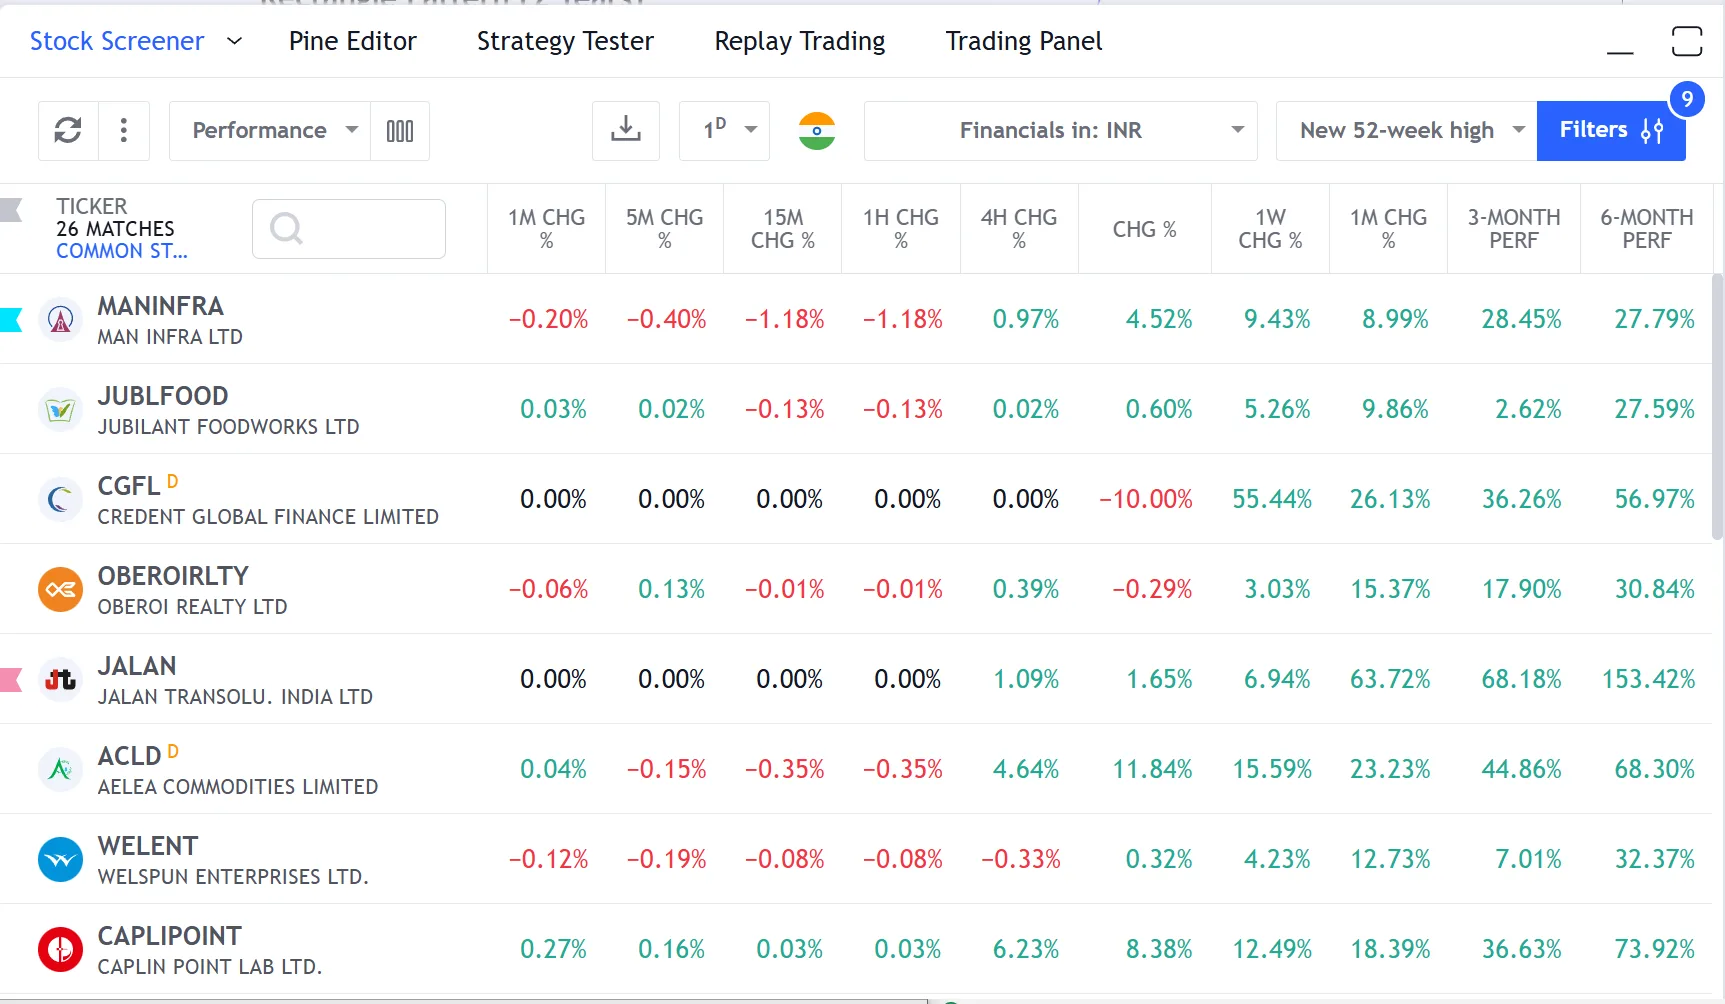
The Stock Screener is arguably the most powerful free research tool available to Indian retail traders. It allows you to filter thousands of NSE and BSE listed stocks using a combination of fundamental metrics, technical indicators, and descriptive categories—all updating in real-time during market hours.
To access it, click the 'Stock Screener' tab in the Bottom Menu. The default view shows a table of all available instruments sorted by market capitalization. From here, you can begin layering filters to narrow down your universe.
A practical example: 'Show me all NSE stocks with a Market Cap above ₹10,000 Crore, a P/E ratio below 20, RSI between 30 and 40 (oversold), and price trading above the 200-day Simple Moving Average.' This single query combines fundamental value screening with technical momentum filtering, producing a highly focused list of undervalued stocks in a long-term uptrend that are currently pulling back to attractive entry levels.
Fundamental Filters
- Market Cap, Enterprise Value, Revenue, Net Income.
- P/E Ratio, P/B Ratio, PEG Ratio, EV/EBITDA.
- EPS Growth (Quarterly & Annual), ROE, ROA, ROIC.
- Debt-to-Equity, Current Ratio, Dividend Yield.
Technical Filters
- RSI (14), MACD Signal, Stochastic %K.
- Price vs. 20/50/100/200 SMA and EMA.
- Average Volume (10-day, 30-day, 90-day).
- 52-Week High/Low proximity, ATR, ADX.
3. All Screener Types: Beyond Stocks
TradingView doesn't limit screening to equities. The platform provides dedicated screener engines for every major asset class, each with filters tailored to that market's unique characteristics.
The Crypto Screener, for example, includes filters for 24-hour trading volume, circulating supply, market dominance percentage, and blockchain-specific metrics that don't exist in equity screeners. The Forex Screener provides filters for pip-based performance, swap rates, and currency pair correlation.
Stock Screener
- Find world stocks by hundreds of filters — dividends, multipliers, performance, technicals.
- Access: https://www.tradingview.com/screener/
ETF Screener
- Pinpoint exchange-traded funds matching your investment goals by AUM and performance.
- Access: https://www.tradingview.com/etf-screener/
Bond Screener
- Navigate the bond market by yield, maturity, credit rating, and more.
- Access: https://www.tradingview.com/bond-screener/
Crypto Coins Screener
- Analyze crypto coins by market caps, circulating supply, address metrics, and social virality.
- Access: https://www.tradingview.com/crypto-coins-screener/
CEX Screener
- Traverse trading pairs across 40+ centralized exchanges by volume and technicals.
- Access: https://www.tradingview.com/cex-screener/
DEX Screener
- Insights into liquidity pools, token pairs, and transaction activity on decentralized exchanges.
- Access: https://www.tradingview.com/dex-screener/
Pine Screener
- Scan assets using your own Pine Script scripts or community scripts.
- Access: https://www.tradingview.com/pine-screener/
Professional Tip
Save your most-used screener configurations as 'Presets'. For example, create a preset called 'NSE Value + Momentum' that combines your fundamental and technical filters. Each morning, simply load this preset to instantly generate your daily watchlist without re-entering all filters.
4. Heatmaps: The Bird's-Eye View
While screeners produce lists, Heatmaps produce visual maps. TradingView's Heatmap tool displays every stock in a market as a colored rectangle. The size of each rectangle represents market capitalization, and the color represents performance over your chosen timeframe (green for gains, red for losses, with color intensity reflecting magnitude).
This provides an instant, at-a-glance understanding of where money is flowing. If the entire IT sector is deep green while Banking is red, you immediately know there is a sector rotation underway—without reading a single number.
Heatmaps are available for Stocks, Crypto, and ETFs. You can filter by country (India), sector, and industry to drill down into specific segments of the market.
Snapshot & Takeaways
5. Pine Script Editor: Your Cloud IDE
The Pine Script Editor is TradingView's integrated development environment for Pine Script v6—the platform's proprietary programming language designed specifically for financial analysis. Unlike Python or JavaScript, Pine Script is purpose-built for markets: every function, every data type, and every construct is optimized for working with price series, volume data, and indicator calculations.
The editor sits in the Bottom Menu and provides a full-featured coding environment: syntax highlighting with financial-specific keywords, intelligent autocomplete for all built-in functions (like `ta.rsi()`, `ta.macd()`, `strategy.entry()`), real-time error diagnostics that highlight issues before you compile, and runtime logging (`log.info()`) for debugging complex strategies.
One of the most powerful learning features: click the `{}` icon next to any built-in indicator's name on your chart to view its complete Pine Script source code. This allows you to study how professional indicators like MACD, Bollinger Bands, and Supertrend are actually constructed—and then modify them to create your own variants.
Editor Features
- Syntax highlighting for Pine Script keywords.
- Intelligent autocomplete for `ta.*`, `math.*`, `strategy.*` namespaces.
- Real-time error diagnostics before compilation.
- Runtime logging with `log.info()` for debugging.
What You Can Build
- Indicators: Custom visual overlays on the chart (`indicator()`).
- Strategies: Backtestable buy/sell logic (`strategy()`).
- Libraries: Reusable function modules importable by other scripts.
- Pine Screener Scripts: Custom scanning criteria for watchlists.
6. Pine Screener: Custom Algorithmic Scanning
The built-in Stock Screener covers standard filters like P/E and RSI. But what if you need to scan for something hyper-specific—like 'All NSE stocks where the 9 EMA just crossed above the 21 EMA on the Daily chart, AND the RSI is between 50 and 60, AND the MACD histogram is positive for the first time in 5 bars'?
This is where the Pine Screener becomes indispensable. You write a custom Pine Script indicator that encodes your exact scanning logic, add it to your Favorites, and then apply it across an entire watchlist using the Pine Screener interface.
The Pine Screener scans every symbol in your selected watchlist against your custom indicator's conditions, producing a filtered list of instruments that meet your algorithmic criteria. This is the closest thing to a fully custom, institutional-grade stock scanner available for free.
Critical Warning
Pine Screener scripts have specific limitations: a maximum lookback of 500 bars, restricted use of `request.*` functions, and the script must be saved to your Favorites before it appears in the Screener menu. Results are generated on-demand when you click 'Scan', not in real-time.
7. Strategy Tester: Backtesting Engine
When you write a Pine Script `strategy()` instead of an `indicator()`, the Strategy Tester tab in the Bottom Menu comes alive. It executes your buy/sell logic against the entire historical dataset of the current chart, producing a comprehensive performance report.
The Strategy Tester displays four key sub-tabs: (1) Overview—showing Net Profit, Profit Factor, Max Drawdown, and Sharpe Ratio. (2) Performance Summary—breaking down long vs. short trade statistics. (3) List of Trades—a chronological record of every simulated entry and exit with timestamps and P&L. (4) Equity Curve—a visual graph of your account balance over time.
This is the engine that allows you to test hypotheses before risking real capital. If your strategy shows a negative Profit Factor or a Max Drawdown exceeding 20%, you know to iterate on the logic before deploying it live.
Snapshot & Takeaways
8. Chart Range & Go to Date
The Chart Range selector sits at the very bottom of the chart, providing predefined zoom presets: 1D, 5D, 1M, 3M, 6M, YTD, 1Y, 5Y, and All Time. Clicking any button instantly adjusts your chart's visible range to fit that exact period.
The 'Go to Date' feature (shortcut: `Alt+G` on Windows, `Option+G` on Mac) opens a calendar dialog that teleports your chart to any specific historical date. This is essential for studying price reactions to known macro events—Budget Day, election results, RBI rate decisions, or COVID crash dates.
Instead of endlessly scrolling backward through years of data, you type '2020-03-23' and instantly land on the exact candle where Nifty hit its COVID low. From there, you can begin your analysis, draw levels, and test hypotheses.
Professional Tip
Combine 'Go to Date' with Bar Replay for maximum efficiency. Press Alt+G to jump to a historical event, then activate Bar Replay to watch how the market unfolded from that exact moment forward—one candle at a time.
Unlock TradingView Pro
Gain unrestricted access to multiple charts, custom timeframes, and unlimited technical indicators to perfect your edge.
Frequently Asked Questions
Common questions about this topic
Click the 'Screener' tab in the Bottom Menu (or navigate to Products → Screeners). Choose from Stock, Forex, Crypto, ETF, Bond, or DEX screeners. Click 'Filters' to add criteria—for Indian stocks, start by setting Exchange to 'NSE' or 'BSE'. Layer fundamental filters (P/E, Market Cap, ROE) with technical filters (RSI, price vs. SMA) to build a focused watchlist. Save your configuration as a Preset for daily reuse.
Official TradingView Resources
Curated links from TradingView's Help Center & Blog
How do I find a mobile screener?
Unfortunately, mobile screener (on both iOS and Android apps) is not supported at the moment. However, we plan to implement it in the nearest future. ...
Earnings report date
The Report date in the Earnings card on the chart shows the expected or confirmed date when a company will publish its earnings report.Exact vs. appro...
Total Cash Dividends Paid
What are Total Cash Dividends Paid?Total Cash Dividends Paid represent the total dividends paid to common and preferred shareholders of a company for ...
Introduction to Dividend Calendar
The Dividend Calendar is designed for you to compare which stocks were the most profitable the previous quarter in relation to other stocks. If you're...
All the world’s stocks, now in one screener
Read fresh TradingView updates: All the world’s stocks, now in one screener. Discover more in our blog and stay connected with the latest platform news.
CEX Screener by TradingView: the ultimate addition to the collection
Read fresh TradingView updates: CEX Screener by TradingView: the ultimate addition to the collection. Discover more in our blog and stay connected with the latest platform news.
Chart view in Stock, ETF, and Crypto coins screeners
Read fresh TradingView updates: Chart view in Stock, ETF, and Crypto coins screeners. Discover more in our blog and stay connected with the latest platform news.
New filters and columns in the Stock Screener: Recent and Upcoming earnings dates
Read fresh TradingView updates: New filters and columns in the Stock Screener: Recent and Upcoming earnings dates. Discover more in our blog and stay connected with the latest platform news.
Related Articles
Continue your learning journey
Introduction to Pine Script
The basics of TradingView's proprietary programming language for building custom indicators.
ModuleStrategy Tester & Replay Trading
Backtesting strategies, paper trading, and connecting to live brokers.
ModuleIndicators, Metrics & Strategies
Your complete technical analysis toolkit — from moving averages to Pine Script.
ModuleCreating Alerts — Never Miss a Trade
Price alerts, indicator alerts, webhooks, and the complete alert automation system.

Written By
Rohit Singh
Mr. Chartist
With 14+ years of experience in Indian financial markets, Rohit Singh (Mr. Chartist) is a SEBI Registered Research Analyst, Amazon #1 bestselling author, and the founder of Investology — a premium trading ecosystem trusted by a 1.5 Lakh+ strong community across India.
TradingView is a registered trademark of TradingView, Inc. All screenshots, logos, and platform imagery are the property of TradingView, Inc. and are used here for educational purposes only under fair use. This content is not affiliated with, endorsed, or sponsored by TradingView.
(c) 2026 TradingView, Inc. All rights reserved. - www.tradingview.com