Coming Soon
The Weekend Visual ChartBook is currently undergoing a massive upgrade. Stay tuned for a world-class reading experience.
Return HomeWeekend Visual ChartBook
Edition #275
Extracted Edition
Market Pulse
LiveReal-time index prices above. Detailed index chart analysis below in the Indices section.
Bullish Charts [F&O]
Breakout and momentum setups from the F&O universe
Uno Minda
bullish fnoDouble Bottom Breakout
Daily Chart
Thesis & Analysis
No detailed thesis provided for this setup.
Price Action
- ■Price action is structurally positive.
- ■Forming higher highs and higher lows.
Volume Profile
- ■Volume is supportive of the price action.
- ■Wait for volume expansion on breakout.
Key Levels
No zones specified
No zones specified
Invalidation Scenario
A weekly close below the support level invalidates this structure.
UNO MINDA
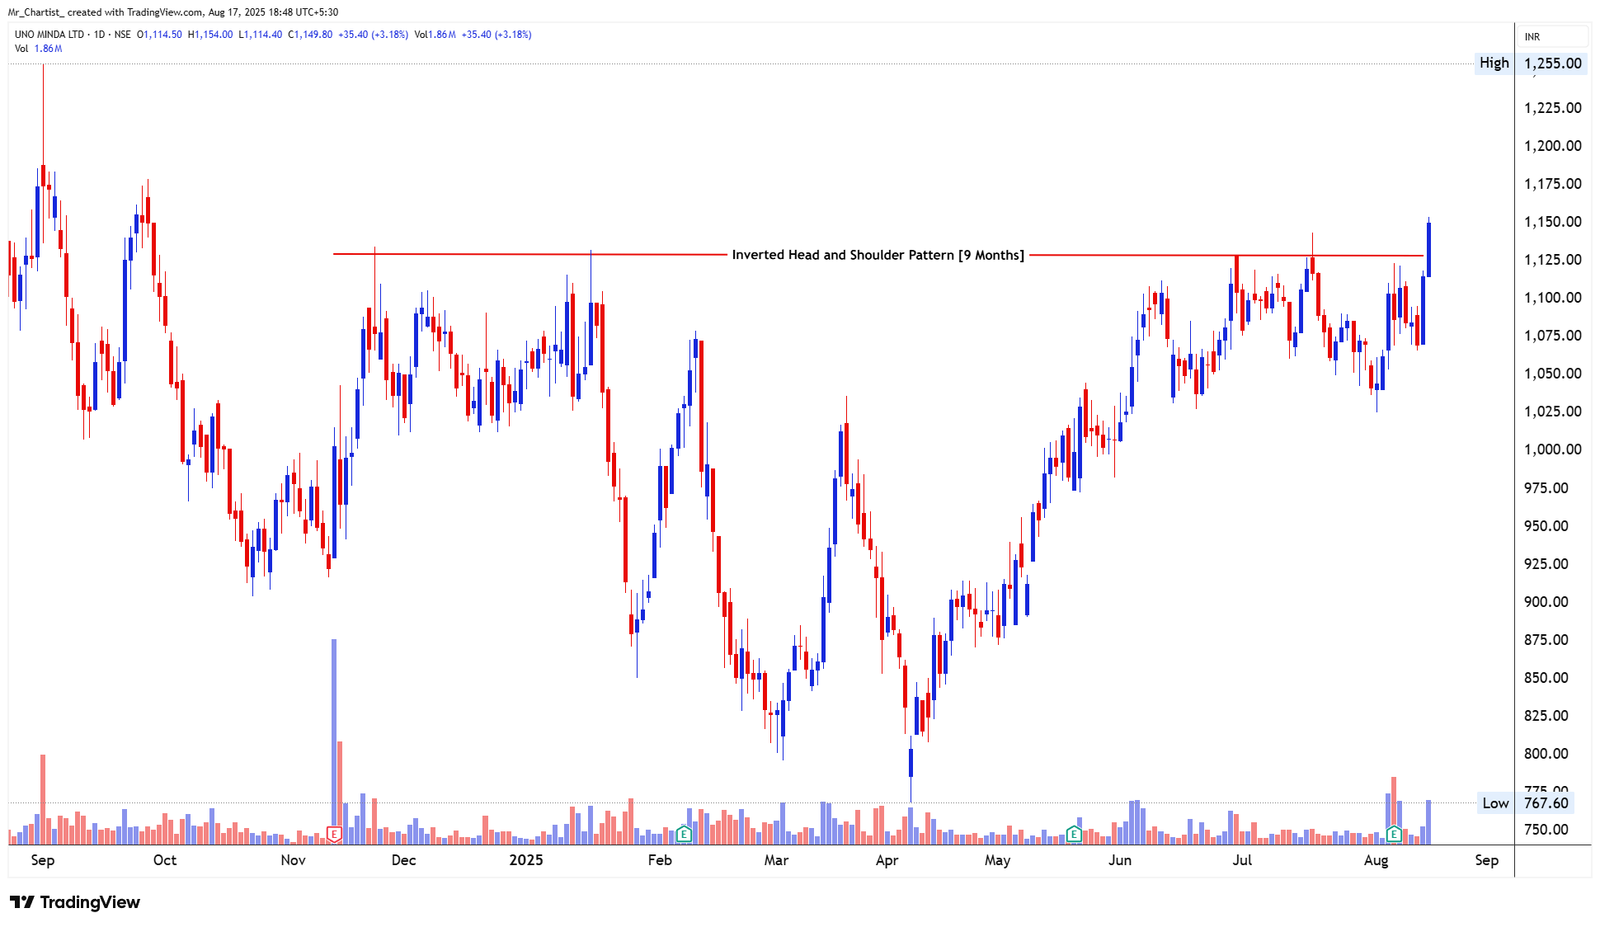
bullish fnoInverted Head & Shoulders
9 Months (Daily Chart – Medium-Term Trend)
Thesis & Analysis
Uno Minda has confirmed a bullish breakout from a 9-month inverted head and shoulders pattern with strong follow-through price action. The neckline breakout occurred at ₹1,125, accompanied by back-to-back bullish marubozu candles and above-average volumes, reinforcing breakout strength. This suggests that momentum has shifted decisively in favor of the bulls, opening room for an extended rally toward higher targets. Candlestick Behavior: Back-to-back bullish marubozu candles confirm strong buyer dominance. Follow-up candles holding above the neckline will be key for sustaining momentum. Volume Analysis: Breakout was supported by high trading volume, confirming institutional participation. Sustained high volumes above ₹1,125 would strengthen bullish conviction. 2. Crucial Support and Resistance Levels Support Zones: 1,125–1,100 – Breakout support zone; holding above this level keeps the breakout valid. 1,075 – Secondary cushion if price retests lower. 1,025 – Deeper support; range base if false breakout occurs. Resistance Zones: 1,200 – First major upside target. 1,255 – Upper breakout extension and recent swing projection. 1,300 – Psychological round-number resistance on further momentum. 3. Strategic Trade Scenarios 🔸 Primary Setup – Breakout Continuation If Uno Minda sustains above ₹1,125, bullish momentum is likely to extend toward ₹1,200–1,255 in the short term. A decisive move beyond ₹1,255 could open room for a test of ₹1,300. 🔹 Alternate Setup – Pullback/Consolidation If the stock slips below ₹1,100, a retest of the breakout zone is possible, leading to sideways consolidation between ₹1,025–1,125 before the next directional move.
Price Action
- ■Price action is structurally positive.
- ■Forming higher highs and higher lows.
Volume Profile
- ■Volume is supportive of the price action.
- ■Wait for volume expansion on breakout.
Key Levels
No zones specified
No zones specified
Invalidation Scenario
A weekly close below the support level invalidates this structure.
Info Edge
bullish fnoDouble Bottom Breakout
Daily Chart
Thesis & Analysis
No detailed thesis provided for this setup.
Price Action
- ■Price action is structurally positive.
- ■Forming higher highs and higher lows.
Volume Profile
- ■Volume is supportive of the price action.
- ■Wait for volume expansion on breakout.
Key Levels
No zones specified
No zones specified
Invalidation Scenario
A weekly close below the support level invalidates this structure.
INFO EDGE
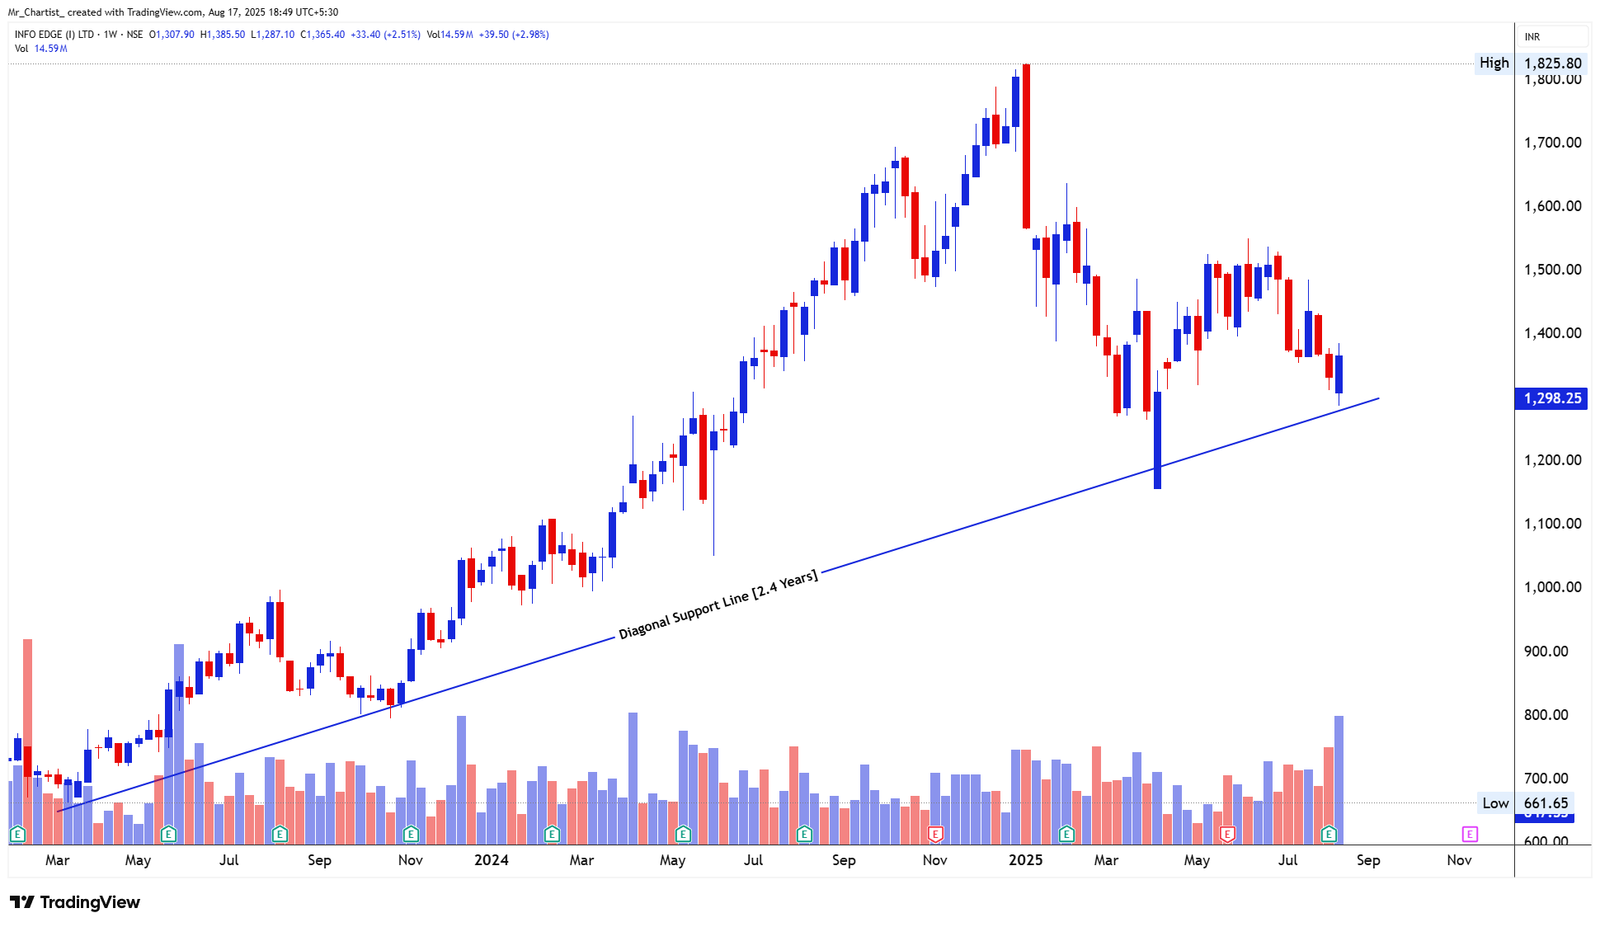
bullish fnoDiagonal Support Trendline
2.4 Years (Weekly Chart – Long-Term Support Zone)
Thesis & Analysis
Info Edge is trading near a long-term diagonal support line that has held strong for over 2 years. Recently, the index formed a piercing candlestick pattern near this support, accompanied by higher volumes – a sign of potential bullish reversal interest at lower levels. If the stock sustains above ₹1,400, it would confirm a rebound from support and could lead toward ₹1,500–1,550 in the coming weeks. However, a failure to hold above ₹1,290 on a weekly close would weaken the bullish structure and open the way for further downside. Candlestick Behavior: Weekly piercing pattern signals early bullish intent near support. Follow-up candles and sustained closes above ₹1,400 are crucial for confirmation. Volume Analysis: Spike in volumes near support zone suggests accumulation. Sustained high volumes on an upward move would validate breakout strength. 2. Crucial Support and Resistance Levels Support Zones: 1,320–1,290 – Immediate support; failure here risks breakdown. 1,200 – Major long-term support along the diagonal trendline. 1,050 – Extended downside if structure fully weakens. Resistance Zones: 1,400 – Immediate breakout confirmation level. 1,500–1,550 – Short-term upside targets. 1,625–1,650 – Medium-term hurdle if momentum extends. 3. Strategic Trade Scenarios 🔸 Primary Setup – Rebound from Long-Term Support If Info Edge sustains above ₹1,400, it could trigger a recovery toward ₹1,500–1,550. Sustaining above ₹1,550 would shift momentum back into a medium-term bullish structure. 🔹 Alternate Setup – Breakdown Below ₹1,290 A weekly close below ₹1,290 would signal trendline weakness, exposing the stock to further downside toward ₹1,200 initially, and possibly ₹1,050 on extended weakness.
Price Action
- ■Price action is structurally positive.
- ■Forming higher highs and higher lows.
Volume Profile
- ■Volume is supportive of the price action.
- ■Wait for volume expansion on breakout.
Key Levels
No zones specified
No zones specified
Invalidation Scenario
A weekly close below the support level invalidates this structure.
Eternal Ltd
bullish fnoDouble Bottom Breakout
Daily Chart
Thesis & Analysis
No detailed thesis provided for this setup.
Price Action
- ■Price action is structurally positive.
- ■Forming higher highs and higher lows.
Volume Profile
- ■Volume is supportive of the price action.
- ■Wait for volume expansion on breakout.
Key Levels
No zones specified
No zones specified
Invalidation Scenario
A weekly close below the support level invalidates this structure.
ETERNAL LTD
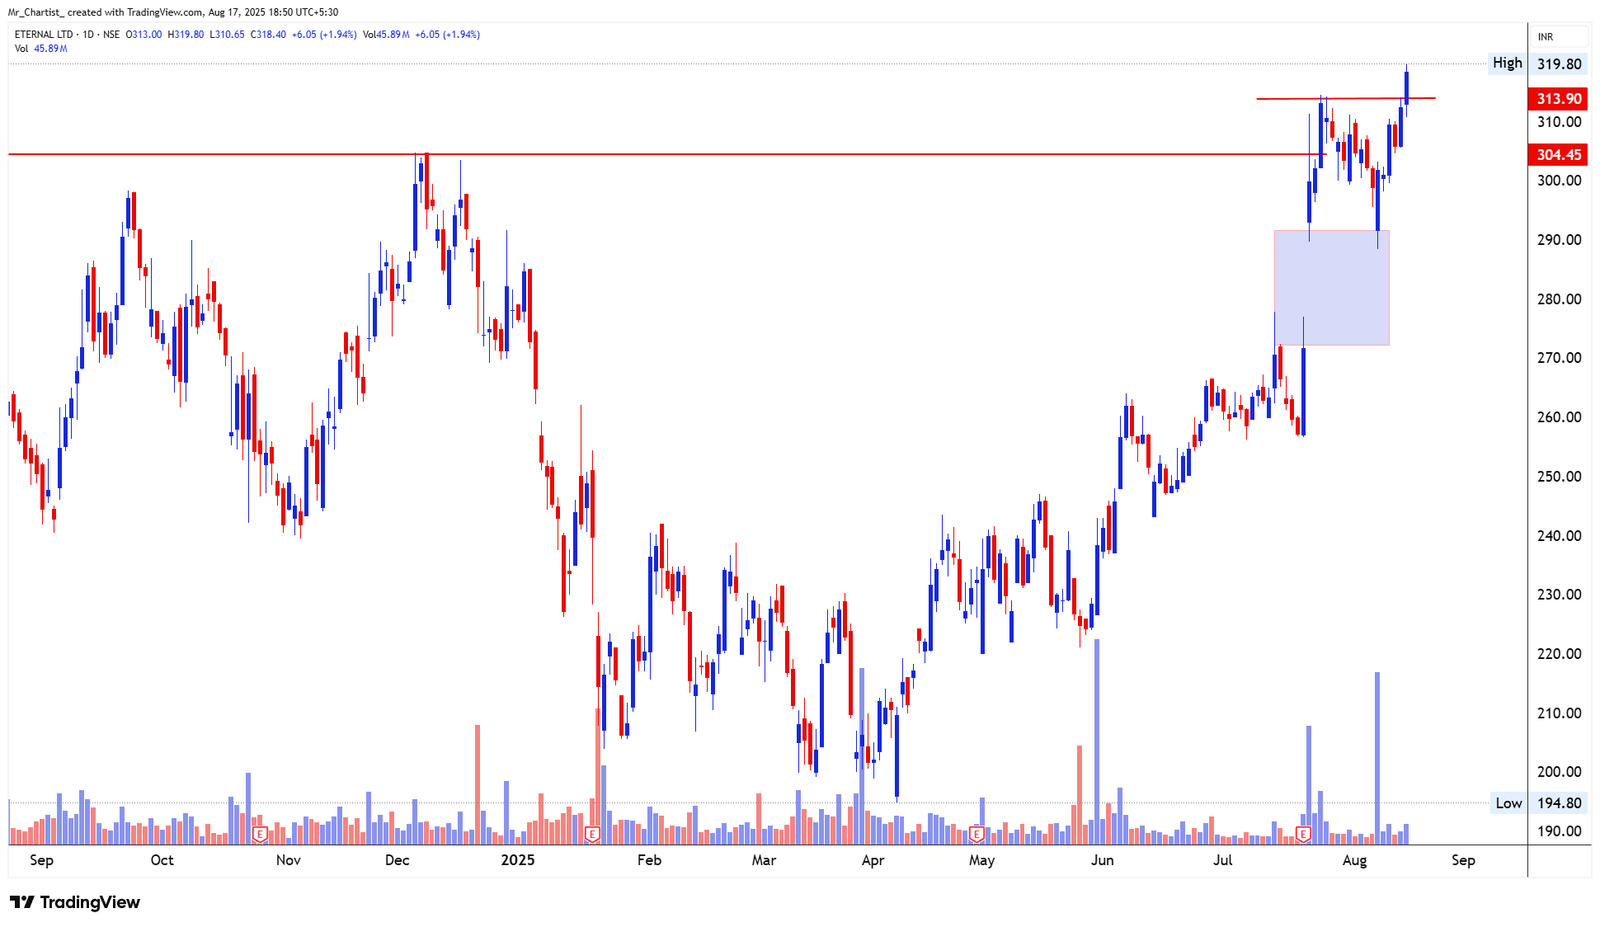
bullish fnoBreakout from Consolidation + Gap Support Retest
Daily Chart – Recent All-Time High
Thesis & Analysis
Eternal Ltd is trading at a new all-time high, supported by strong volume participation. The price recently retested the gap support zone near ₹280–₹290 and rebounded strongly, confirming bullish demand at lower levels. After consolidating briefly near the ₹304–₹314 zone, the stock has given a fresh breakout on strong volume, suggesting continuation of the uptrend. If momentum sustains, price action indicates scope for a move toward ₹340–₹360 in the near term. However, failure to hold the breakout zone around ₹300–₹305 could lead to renewed weakness and consolidation. Candlestick Behavior: Bullish follow-through candles after gap retest confirm buyers’ control. Breakout candles are wide-bodied, signaling conviction. Volume Analysis: Strong volume spike aligns with the breakout. Continued high volume on up-moves would validate bullish strength. 2. Crucial Support and Resistance Levels Support Zones: ₹305–₹300 – Key breakout and gap-support zone; must hold for sustained strength. ₹285–₹290 – Gap retest zone, strong demand base. ₹265 – Deeper fallback level if momentum fails. Resistance Zones: ₹330–₹340 – First short-term upside target zone. ₹355–₹360 – Higher extension target. Above ₹360 – Open upside, continuation into uncharted territory. 3. Strategic Trade Scenarios 🔸 Primary Setup – Sustained Breakout Rally If Eternal Ltd sustains above ₹305, the breakout remains valid, with potential upside toward ₹340–₹360. Strong volumes add confidence to the bullish setup. 🔹 Alternate Setup – Breakdown Below ₹300 If the stock fails to hold above ₹300, weakness could drag it back to the ₹285– ₹290 gap zone, with deeper downside risk toward ₹265 if selling intensifies.
Price Action
- ■Price action is structurally positive.
- ■Forming higher highs and higher lows.
Volume Profile
- ■Volume is supportive of the price action.
- ■Wait for volume expansion on breakout.
Key Levels
No zones specified
No zones specified
Invalidation Scenario
A weekly close below the support level invalidates this structure.
Blue Star Ltd
bullish fnoDouble Bottom Breakout
Daily Chart
Thesis & Analysis
No detailed thesis provided for this setup.
Price Action
- ■Price action is structurally positive.
- ■Forming higher highs and higher lows.
Volume Profile
- ■Volume is supportive of the price action.
- ■Wait for volume expansion on breakout.
Key Levels
No zones specified
No zones specified
Invalidation Scenario
A weekly close below the support level invalidates this structure.
BLUE STAR LTD
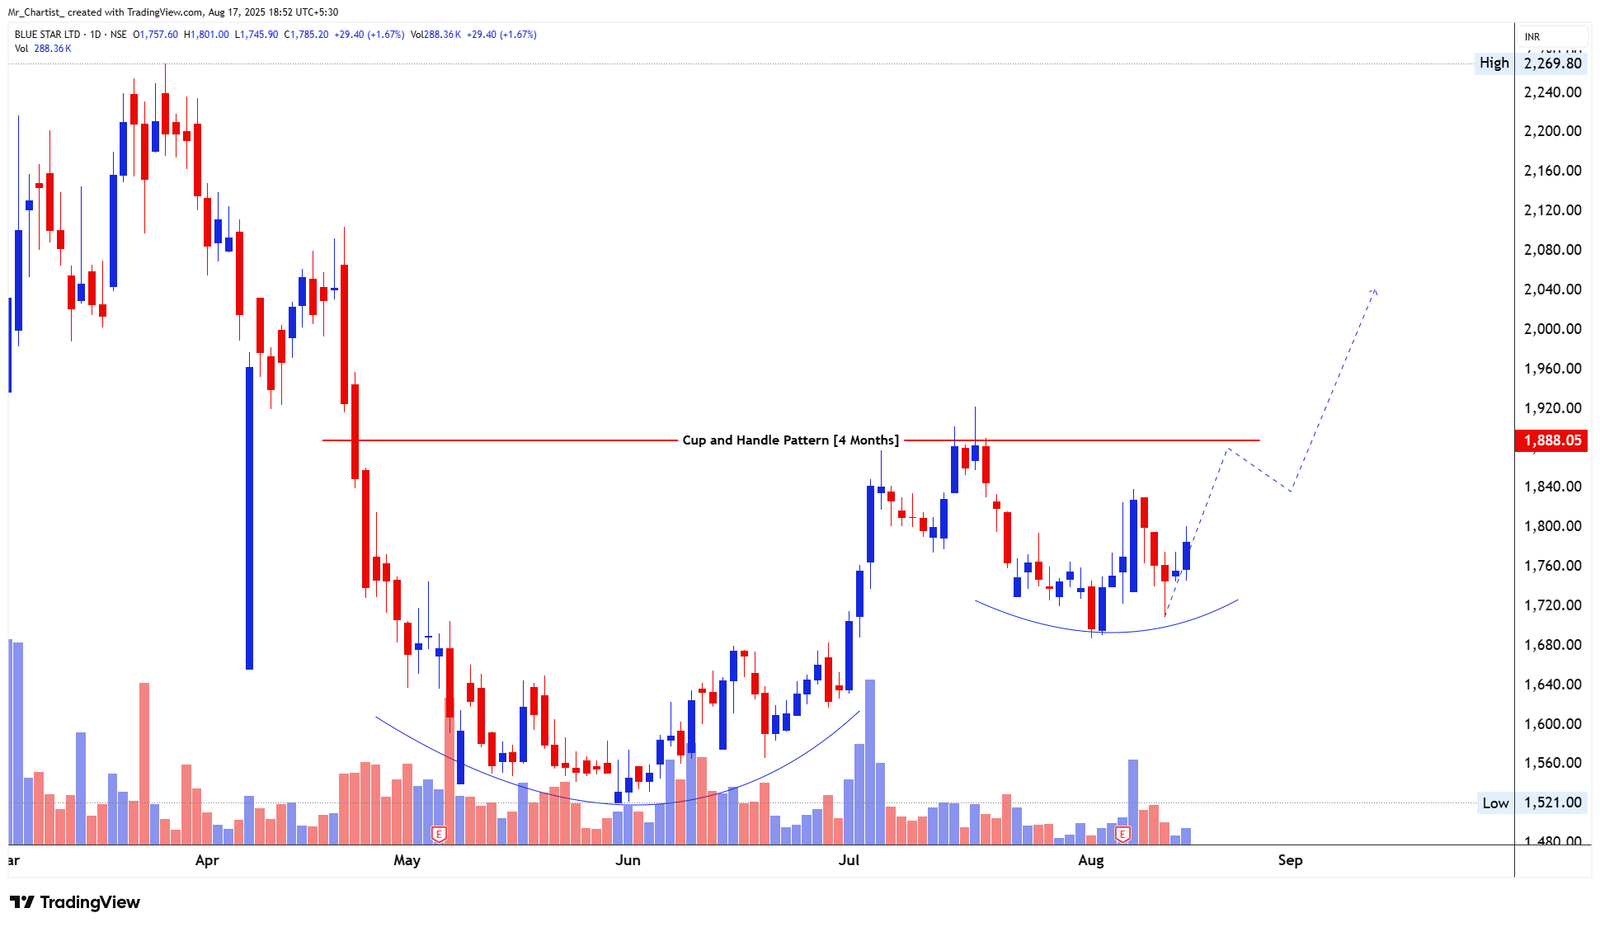
bullish fnoCup and Handle
4 Months (Daily Chart – Ongoing Formation)
Thesis & Analysis
Blue Star is forming a classic cup and handle pattern, a bullish continuation structure that suggests accumulation before a potential breakout. The cup base was built between May and July, followed by a handle formation with mild consolidation around the ₹1,700–₹1,800 zone. Currently, the stock is attempting to stabilize, supported by a hammer candlestick near ₹1,750, which signals demand re-emerging. A decisive close above ₹1,888 would complete the breakout, opening up further upside potential toward ₹2,000– ₹2,080. Candlestick Behavior: A hammer pattern around the handle support zone reflects buyer interest. Strong bullish candles would be needed above ₹1,888 to validate the breakout. Volume Analysis: Volume has been gradually improving during up-moves. A breakout with a volume spike would add conviction to the bullish pattern. 2. Crucial Support and Resistance Levels Support Zones: ₹1,800 – Key immediate support; handle base. ₹1,700–₹1,720 – Handle support zone; holding this is critical. ₹1,600 – Deeper fallback support if the pattern fails. Resistance Zones: ₹1,888 – Breakout level for the cup and handle pattern. ₹2,000–₹2,040 – Short-term target zone post-breakout. ₹2,080 – Extended breakout target. 3. Strategic Trade Scenarios 🔸 Primary Setup – Breakout from Cup and Handle If Blue Star sustains above ₹1,888, it would confirm the breakout from the pattern. Upside projections then extend toward ₹2,000–₹2,080, supported by momentum buying and volume confirmation. 🔹 Alternate Setup – Range-Bound Handle Consolidation If the stock fails to cross ₹1,888, price may continue consolidating between ₹1,700– ₹1,880, forming a broader handle. A breakdown below ₹1,700 would weaken the pattern and invite further downside toward ₹1,600.
Price Action
- ■Price action is structurally positive.
- ■Forming higher highs and higher lows.
Volume Profile
- ■Volume is supportive of the price action.
- ■Wait for volume expansion on breakout.
Key Levels
No zones specified
No zones specified
Invalidation Scenario
A weekly close below the support level invalidates this structure.
HDFC Life
bullish fnoDouble Bottom Breakout
Daily Chart
Thesis & Analysis
No detailed thesis provided for this setup.
Price Action
- ■Price action is structurally positive.
- ■Forming higher highs and higher lows.
Volume Profile
- ■Volume is supportive of the price action.
- ■Wait for volume expansion on breakout.
Key Levels
No zones specified
No zones specified
Invalidation Scenario
A weekly close below the support level invalidates this structure.
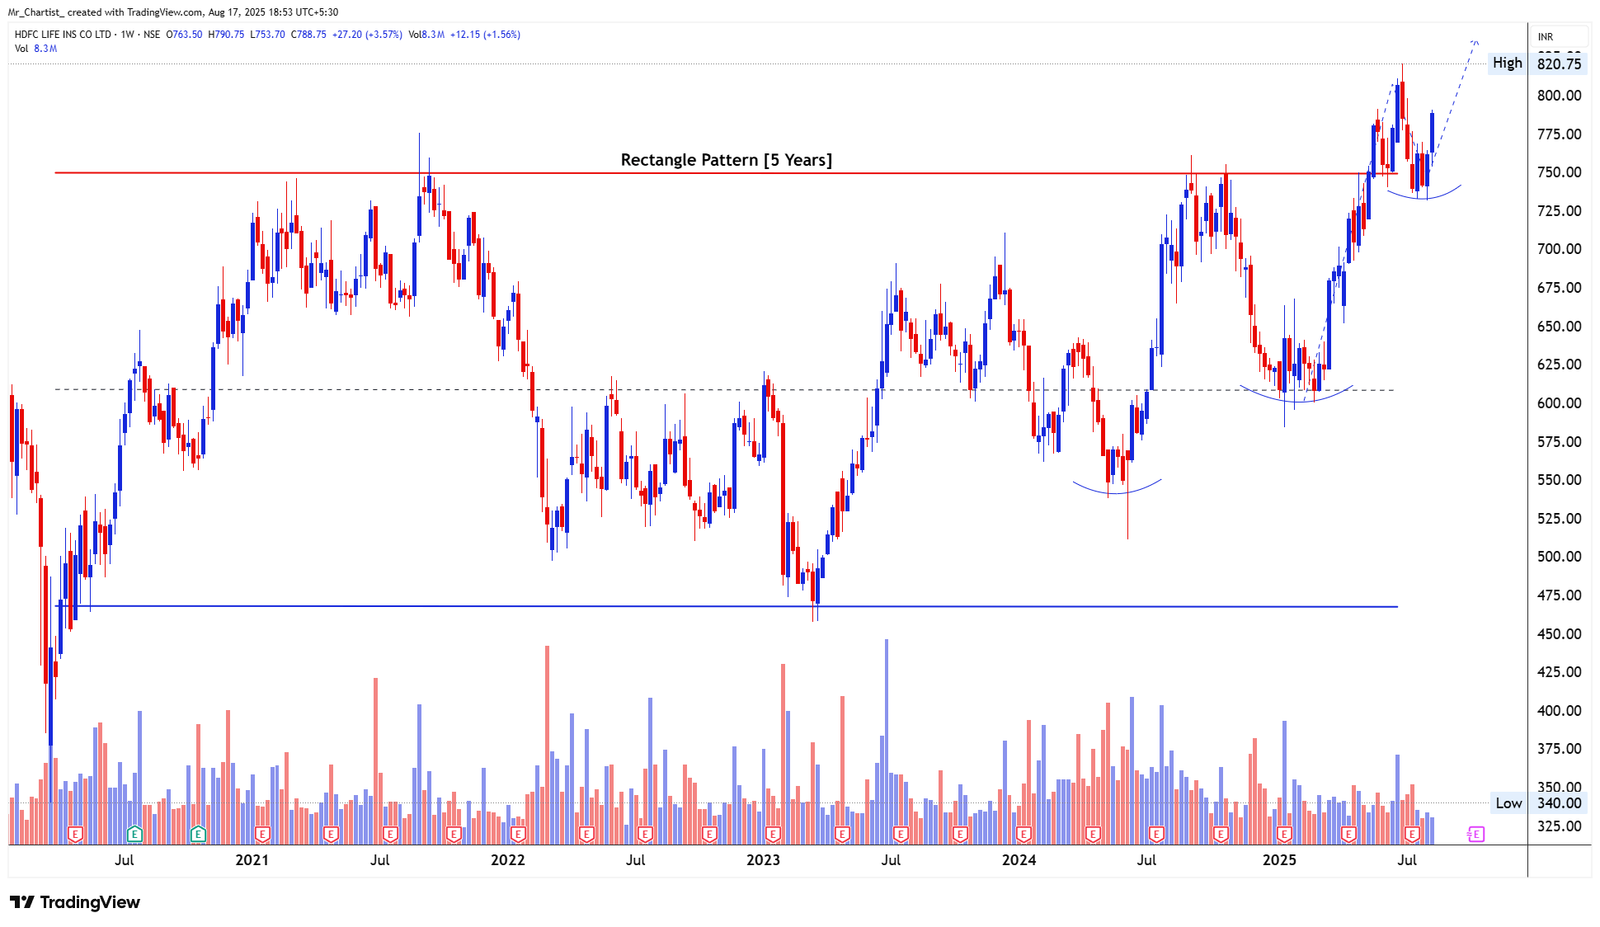
HDFC LIFE
bullish fnoRectangle Breakout with Rounded Bottoms
5 Years (Weekly Chart – Long-Term Structure)
Thesis & Analysis
HDFC Life has been trading inside a large rectangle pattern for over 5 years, repeatedly oscillating between support and resistance levels. Recently, the stock broke out above the upper boundary near ₹760–₹770, validating the bullish structure. The breakout has been supported by multiple rounded bottom formations, each showing accumulation and higher lows. Currently, the price is consolidating near ₹780–₹800, forming a smaller base after a strong rally. A decisive move above ₹820 would confirm continuation of the breakout, paving the way for higher targets. Candlestick Behavior: Recent weekly candles show controlled consolidation after a sharp upward leg. Bullish continuation patterns suggest steady accumulation. Volume Analysis: Sustained higher volumes on breakout rallies. Volume contraction during consolidation – a healthy technical sign before continuation. 2. Crucial Support and Resistance Levels Support Zones: ₹760–₹770 – Recent breakout zone; now a strong support base. ₹720 – Intermediate support from earlier structure. ₹600 – Long-term rectangle floor; deep fallback level. Resistance Zones: ₹820 – Immediate hurdle; breakout confirmation level. ₹850–₹880 – Next upside zone on sustained strength. ₹920 – Potential long-term breakout extension target. 3. Strategic Trade Scenarios 🔸 Primary Setup – Continuation of Breakout If HDFC Life sustains above ₹820, the rectangle breakout gains momentum, opening a rally toward ₹850–₹880, and possibly extending to ₹920 in the medium term. 🔹 Alternate Setup – Pullback into Support If the price fails to hold above ₹820 in the short term, a retest toward ₹770 is possible. Holding above this zone keeps the bullish outlook intact. A breakdown below ₹760 would weaken the breakout setup.
Price Action
- ■Price action is structurally positive.
- ■Forming higher highs and higher lows.
Volume Profile
- ■Volume is supportive of the price action.
- ■Wait for volume expansion on breakout.
Key Levels
No zones specified
No zones specified
Invalidation Scenario
A weekly close below the support level invalidates this structure.
Asian Paints
bullish fnoDouble Bottom Breakout
Daily Chart
Thesis & Analysis
No detailed thesis provided for this setup.
Price Action
- ■Price action is structurally positive.
- ■Forming higher highs and higher lows.
Volume Profile
- ■Volume is supportive of the price action.
- ■Wait for volume expansion on breakout.
Key Levels
No zones specified
No zones specified
Invalidation Scenario
A weekly close below the support level invalidates this structure.
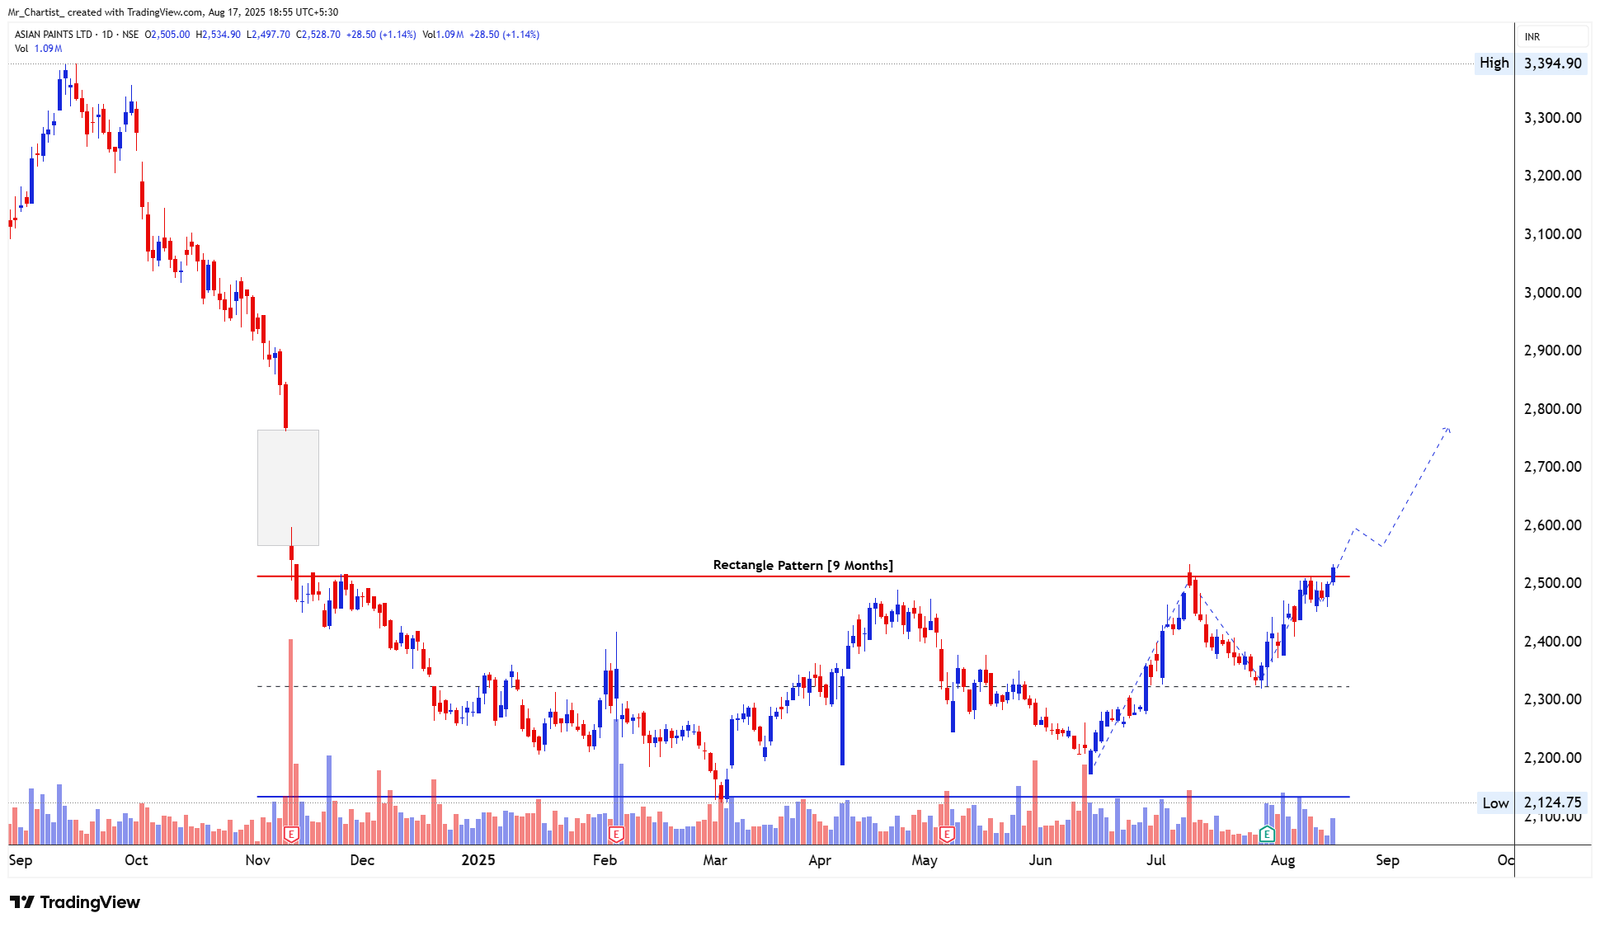
ASIAN PAINTS
bullish fnoRectangle Breakout
9 Months (Daily Chart – Medium-Term)
Thesis & Analysis
Asian Paints has been consolidating inside a rectangle pattern for the last nine months, repeatedly testing the ₹2,200–₹2,500 zone. Recently, the price broke out above the ₹2,500 resistance, signaling a potential shift in momentum. The breakout is accompanied by a gradual pickup in volume, which indicates accumulation, though sustained follow-through above ₹2,500 will be key to validating strength. If the stock holds firmly above ₹2,500, it could open the way for a medium-term rally toward ₹2,650–₹2,800. Candlestick Behavior: Multiple bullish candles forming higher highs and higher lows. Breakout candle shows conviction but needs confirmation through follow-up sessions. Volume Analysis: Increasing participation on rallies. Breakout supported by rising but not yet surging volumes – further buildup is crucial. 2. Crucial Support and Resistance Levels Support Zones: ₹2,450–₹2,500 – Immediate breakout retest zone; must hold. ₹2,400 – Secondary support; base of recent consolidation. ₹2,200 – Lower rectangle boundary; strong fallback support. Resistance Zones: ₹2,650 – First near-term target zone post breakout. ₹2,800 – Higher rectangle projection; strong upside level. ₹2,950 – Extended breakout target if momentum accelerates. 3. Strategic Trade Scenarios 🔸 Primary Setup – Breakout Sustains Above ₹2,500 If Asian Paints sustains above ₹2,500, the breakout gains credibility, driving the stock toward ₹2,650 and further to ₹2,800. Holding above ₹2,800 could open the way for an extended move. 🔹 Alternate Setup – Pullback into Consolidation If the price slips back below ₹2,450, the breakout weakens, and the stock may re- enter its prior consolidation zone between ₹2,200–₹2,500. Sustained weakness below ₹2,200 would negate the bullish structure.
Price Action
- ■Price action is structurally positive.
- ■Forming higher highs and higher lows.
Volume Profile
- ■Volume is supportive of the price action.
- ■Wait for volume expansion on breakout.
Key Levels
No zones specified
No zones specified
Invalidation Scenario
A weekly close below the support level invalidates this structure.
Eicher Motors
bullish fnoDouble Bottom Breakout
Daily Chart
Thesis & Analysis
No detailed thesis provided for this setup.
Price Action
- ■Price action is structurally positive.
- ■Forming higher highs and higher lows.
Volume Profile
- ■Volume is supportive of the price action.
- ■Wait for volume expansion on breakout.
Key Levels
No zones specified
No zones specified
Invalidation Scenario
A weekly close below the support level invalidates this structure.
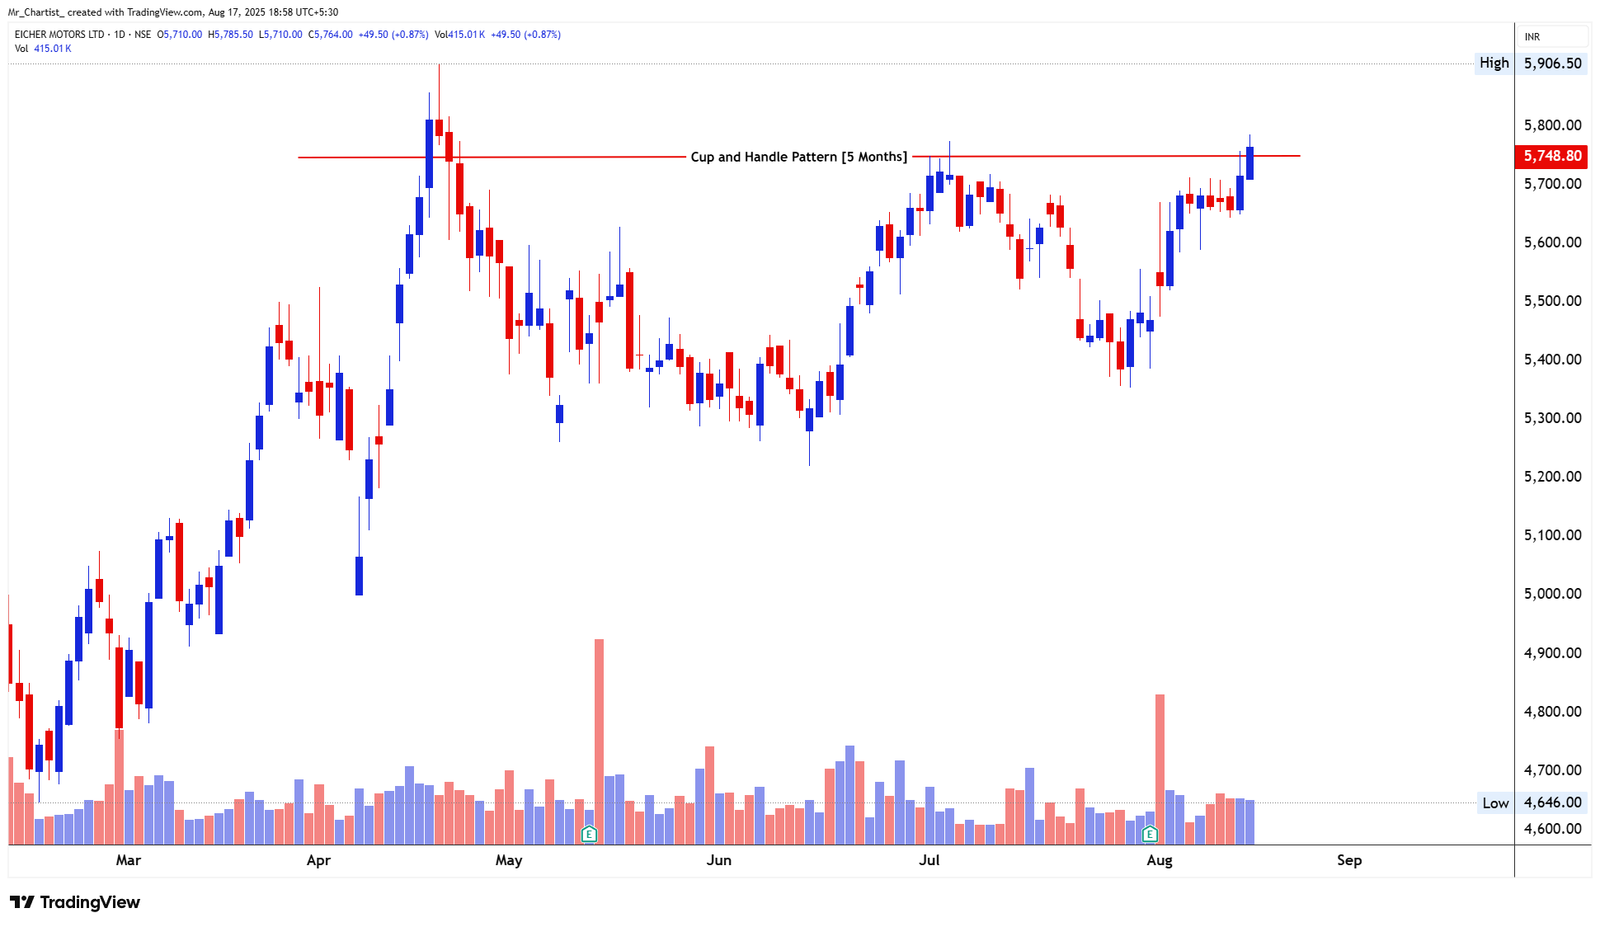
EICHER MOTORS
bullish fnoCup and Handle Pattern
5 Months (Daily Chart – Medium-Term)
Thesis & Analysis
Eicher Motors has been shaping a cup and handle formation over the past five months, signaling a base-building structure. Currently, the price is testing the ₹5,800–₹5,900 neckline resistance. A decisive breakout and sustained move above this zone could confirm bullish continuation, unlocking higher targets. The recent price action shows strong bullish candles with improving volume, reflecting buying interest. However, momentum is yet to fully accelerate, making the breakout zone critical to watch. Candlestick Behavior: Price consolidating near resistance with bullish undertones. No clear rejection yet, suggesting potential breakout buildup. Volume Analysis: Volume is gradually improving during rallies. Sustained volume surge above ₹5,900 would strengthen the breakout confirmation. 2. Crucial Support and Resistance Levels Support Zones: ₹5,650–₹5,700 – Immediate support zone; neckline retest area. ₹5,600 – Secondary support; lower handle base. ₹5,450 – Strong fallback support. Resistance Zones: ₹5,810–₹5,900 – Key neckline resistance; breakout confirmation level. ₹6,200 – First target post-breakout. ₹6,500 – Extended bullish target if momentum sustains. 3. Strategic Trade Scenarios 🔸 Primary Setup – Breakout Above ₹5,900 If Eicher Motors sustains above ₹5,900, the cup and handle breakout strengthens, paving the way for an upside move toward ₹6,200 initially, and further to ₹6,500. 🔹 Alternate Setup – Failure to Breakout If price fails to hold above ₹5,700, the stock may consolidate between ₹5,600– ₹5,900 before making its next directional move. A breakdown below ₹5,600 would expose downside risk toward ₹5,450.
Price Action
- ■Price action is structurally positive.
- ■Forming higher highs and higher lows.
Volume Profile
- ■Volume is supportive of the price action.
- ■Wait for volume expansion on breakout.
Key Levels
No zones specified
No zones specified
Invalidation Scenario
A weekly close below the support level invalidates this structure.
Maruti Suzuki India
bullish fnoDouble Bottom Breakout
Daily Chart
Thesis & Analysis
No detailed thesis provided for this setup.
Price Action
- ■Price action is structurally positive.
- ■Forming higher highs and higher lows.
Volume Profile
- ■Volume is supportive of the price action.
- ■Wait for volume expansion on breakout.
Key Levels
No zones specified
No zones specified
Invalidation Scenario
A weekly close below the support level invalidates this structure.
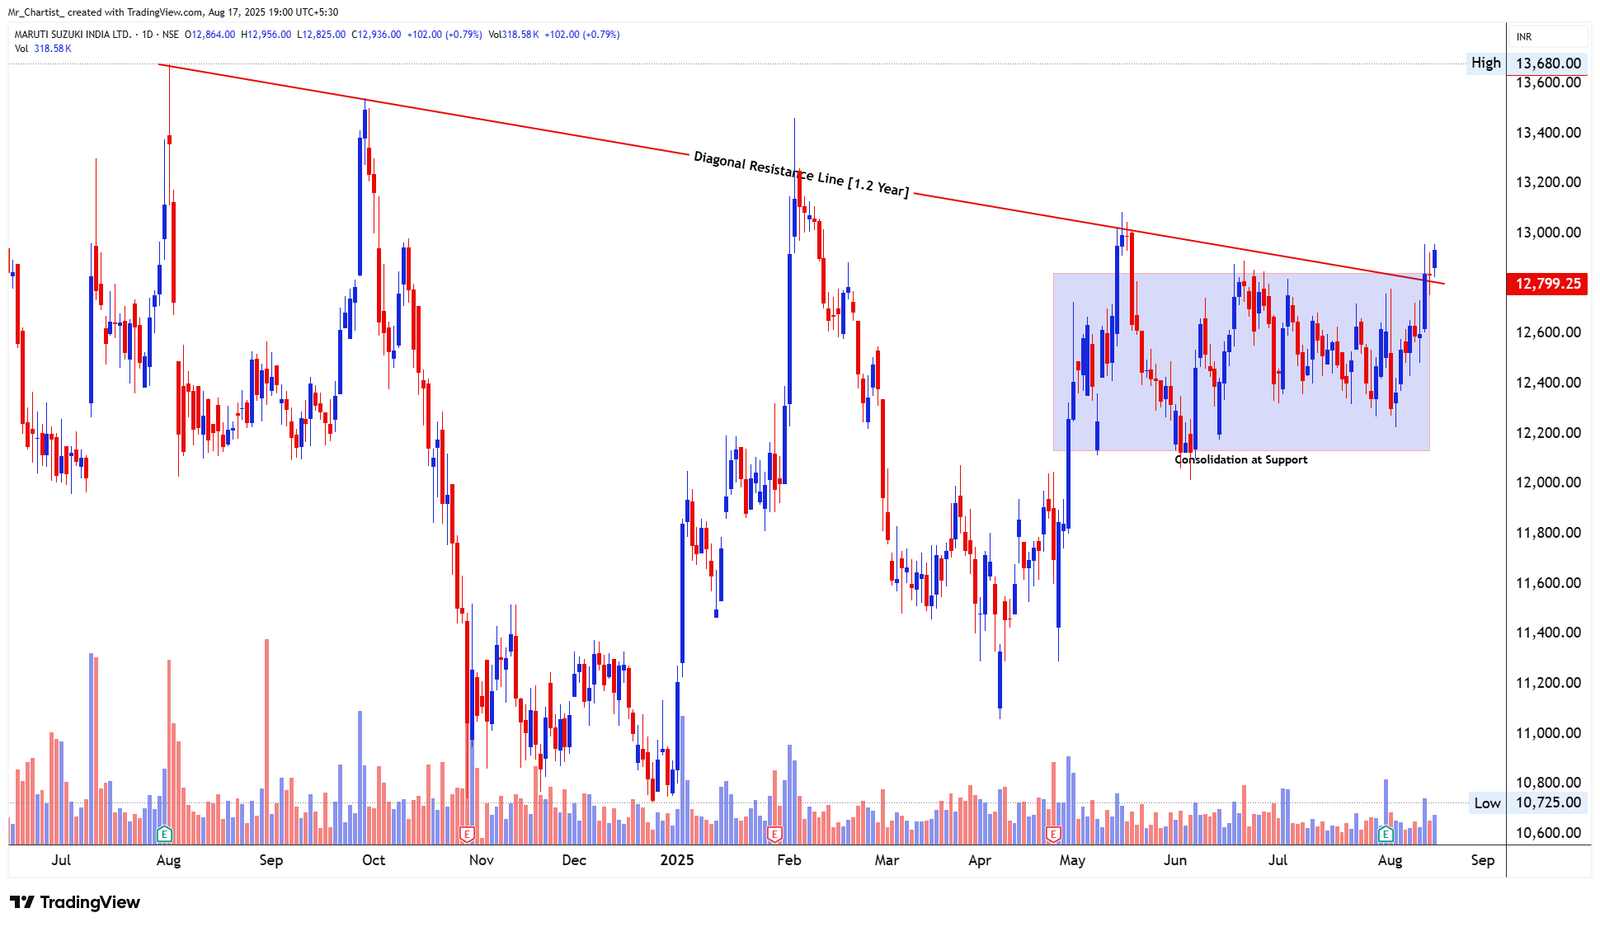
MARUTI SUZUKI INDIA
bullish fnoDiagonal Resistance Breakout + Consolidation Base
1.2 Years (Daily Chart – Medium-Term)
Thesis & Analysis
Maruti has delivered a fresh breakout above a long-term diagonal resistance line, which had capped prices for nearly 1.2 years. Before the breakout, the stock spent the last five months in a tight consolidation range between ₹12,100–₹12,700, forming a strong base. The breakout attempt above ₹13,000 was rejected once, but the stock continues to hold higher supports, suggesting bullish strength is building gradually. Sustaining above the breakout zone could lead to a fresh upward leg. Candlestick Behavior: Recent candles show strong recovery attempts with higher lows. Breakout attempts are facing resistance near ₹13,000 but no sharp rejection so far. Volume Analysis: Breakout attempt supported by steady accumulation volumes. A strong surge in volume above ₹13,000 would be the key trigger for momentum. 2. Crucial Support and Resistance Levels Support Zones: ₹12,600 – Immediate breakout retest support. ₹12,100–₹12,200 – Base of consolidation, secondary cushion. ₹11,800 – Strong long-term support zone. Resistance Zones: ₹13,000–₹13,200 – Key breakout zone; immediate hurdle. ₹13,500 – Intermediate upside target. ₹13,800 – Extended bullish target if momentum sustains. 3. Strategic Trade Scenarios 🔸 Primary Setup – Sustained Breakout Above ₹13,000 If Maruti sustains above ₹13,000, the breakout gains validity, paving the way for a move toward ₹13,200–₹13,500, with an extended move possible up to ₹13,800. 🔹 Alternate Setup – Breakdown Below ₹12,600 If price slips below ₹12,600, consolidation may resume within the ₹12,100– ₹12,700 zone. A deeper breakdown below ₹12,100 could expose downside risk toward ₹11,800.
Price Action
- ■Price action is structurally positive.
- ■Forming higher highs and higher lows.
Volume Profile
- ■Volume is supportive of the price action.
- ■Wait for volume expansion on breakout.
Key Levels
No zones specified
No zones specified
Invalidation Scenario
A weekly close below the support level invalidates this structure.
Indian Hotels
bullish fnoDouble Bottom Breakout
Daily Chart
Thesis & Analysis
No detailed thesis provided for this setup.
Price Action
- ■Price action is structurally positive.
- ■Forming higher highs and higher lows.
Volume Profile
- ■Volume is supportive of the price action.
- ■Wait for volume expansion on breakout.
Key Levels
No zones specified
No zones specified
Invalidation Scenario
A weekly close below the support level invalidates this structure.
Chart Image Not Extracted
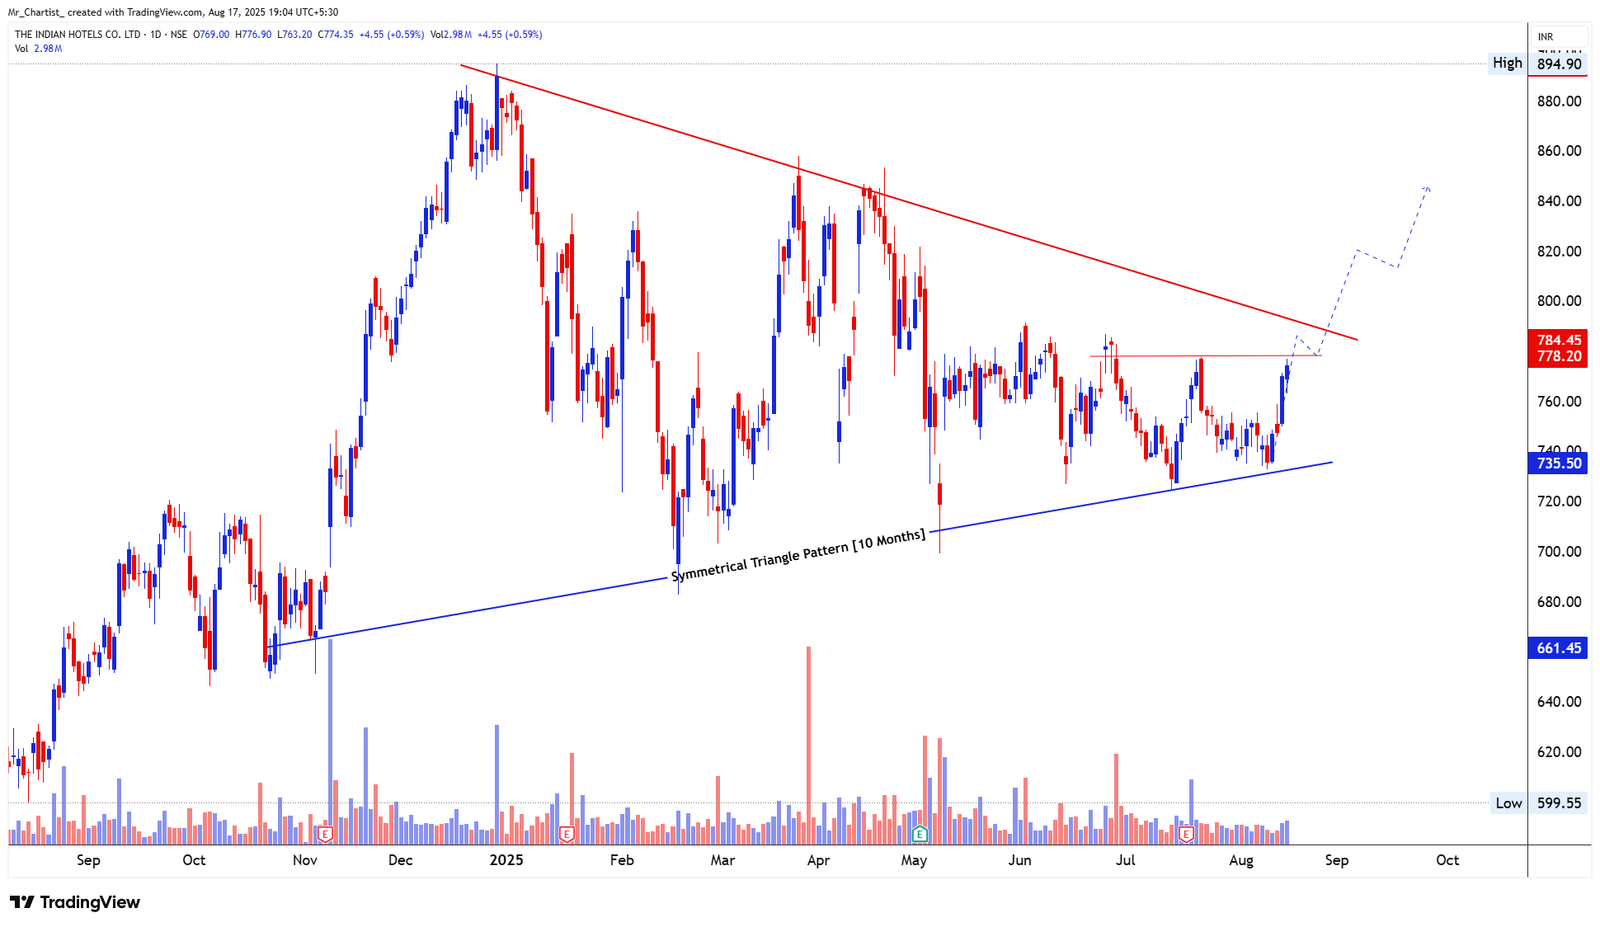
INDIAN HOTELS
bullish fnoSymmetrical Triangle
10 Months (Daily Chart – Medium-Term)
Thesis & Analysis
Price action has been consolidating within a well-defined symmetrical triangle pattern for nearly ten months. Recently, the stock spiked from its ascending support trendline and posted a strong bullish marubozu candle, reflecting renewed buying interest. This shows that the bulls are gradually gaining control after weeks of sideways trade. A sustained move above the ₹780–₹790 resistance zone would not only confirm a near-term breakout but could also trigger a full symmetrical triangle breakout, unlocking significant upside potential. Candlestick Behavior: Recent bullish marubozu near support indicates strong momentum shift. Successive higher lows suggest accumulation within the pattern. Volume Analysis: Volumes have remained steady during consolidation. A breakout above ₹790 with volume expansion would confirm strong participation from buyers. 2. Crucial Support and Resistance Levels Support Zones: ₹740–₹750 – Immediate support from recent rebound zone. ₹720–₹730 – Lower triangle support, secondary cushion. ₹700 – Deeper long-term demand zone. Resistance Zones: ₹780–₹790 – Key breakout trigger zone. ₹840 – First target post breakout. ₹890 – Extended target if momentum strengthens. 3. Strategic Trade Scenarios 🔸 Primary Setup – Breakout Above ₹790 If price crosses and sustains above ₹790, it would complete the symmetrical triangle breakout, opening the way for an upside rally toward ₹840 and ₹890 in the coming weeks. 🔹 Alternate Setup – Failure to Breakout If price fails to clear ₹790 and drifts lower, consolidation could continue within the ₹730–₹790 range. A breakdown below ₹730 would weaken the structure and could drag the stock back toward ₹700.
Price Action
- ■Price action is structurally positive.
- ■Forming higher highs and higher lows.
Volume Profile
- ■Volume is supportive of the price action.
- ■Wait for volume expansion on breakout.
Key Levels
No zones specified
No zones specified
Invalidation Scenario
A weekly close below the support level invalidates this structure.
Bearish Charts [F&O]
Short setups indicating weakness
Petronet LNG
bearish fnoDouble Bottom Breakout
Daily Chart
Thesis & Analysis
No detailed thesis provided for this setup.
Price Action
- ■Price action is structurally positive.
- ■Forming higher highs and higher lows.
Volume Profile
- ■Volume is supportive of the price action.
- ■Wait for volume expansion on breakout.
Key Levels
No zones specified
No zones specified
Invalidation Scenario
A weekly close below the support level invalidates this structure.
Chart Image Not Extracted
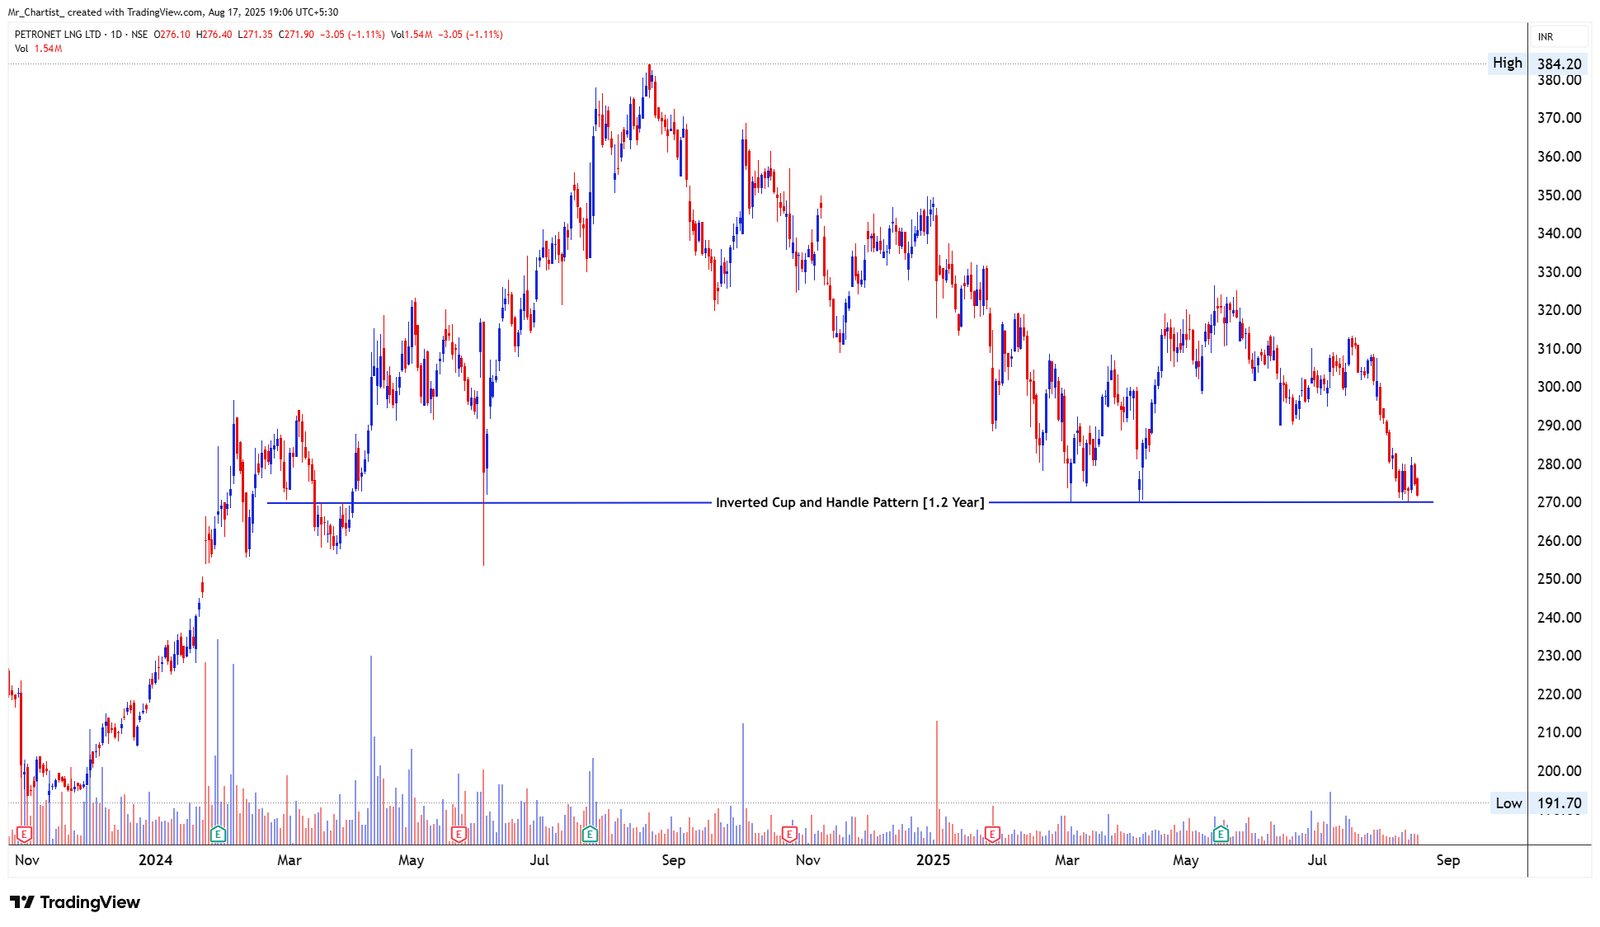
PETRONET LNG
bearish fnoInverted Cup and Handle
1.2 Years (Daily Chart – Medium-Term)
Thesis & Analysis
The stock is currently trading at the neckline of an extended Inverted Cup and Handle pattern, which has been developing for over a year. The neckline support around ₹270 has repeatedly acted as a make-or-break zone. Price is now testing this key level with persistent weakness and bearish candles, suggesting sellers are pressing harder. If the neckline breaks decisively, it could confirm a major bearish continuation pattern and open deeper downside levels. Candlestick Behavior: Consecutive bearish candles show pressure at the neckline. Failure to post strong bullish reversals indicates lack of buyer conviction. Volume Analysis: Selling pressure is accompanied by steady volume. A breakdown with a clear volume spike would validate strong downside participation. 2. Crucial Support and Resistance Levels Support Zones: ₹270 – Critical neckline support. ₹250 – First breakdown target. ₹230 – Extended downside target if momentum persists. Resistance Zones: ₹285–₹290 – Immediate rebound hurdle. ₹300 – Strong overhead barrier; reclaiming this level would neutralize the bearish bias. 3. Strategic Trade Scenarios 🔻 Primary Setup – Breakdown Below ₹270 If the stock closes below ₹270 on volume expansion, it would confirm breakdown of the inverted cup and handle pattern, paving the way toward ₹250 and ₹230 in the near term. 🔹 Alternate Setup – Support Holds at ₹270 If price defends ₹270 and rebounds, a relief rally toward ₹285–₹300 could unfold. Sustaining above ₹300 would negate the bearish structure and shift momentum back to neutral/bullish.
Price Action
- ■Price action is structurally positive.
- ■Forming higher highs and higher lows.
Volume Profile
- ■Volume is supportive of the price action.
- ■Wait for volume expansion on breakout.
Key Levels
No zones specified
No zones specified
Invalidation Scenario
A weekly close below the support level invalidates this structure.
Ducol Orgs & Colours Ltd
bearish fnoDouble Bottom Breakout
Daily Chart
Thesis & Analysis
No detailed thesis provided for this setup.
Price Action
- ■Price action is structurally positive.
- ■Forming higher highs and higher lows.
Volume Profile
- ■Volume is supportive of the price action.
- ■Wait for volume expansion on breakout.
Key Levels
No zones specified
No zones specified
Invalidation Scenario
A weekly close below the support level invalidates this structure.
Chart Image Not Extracted
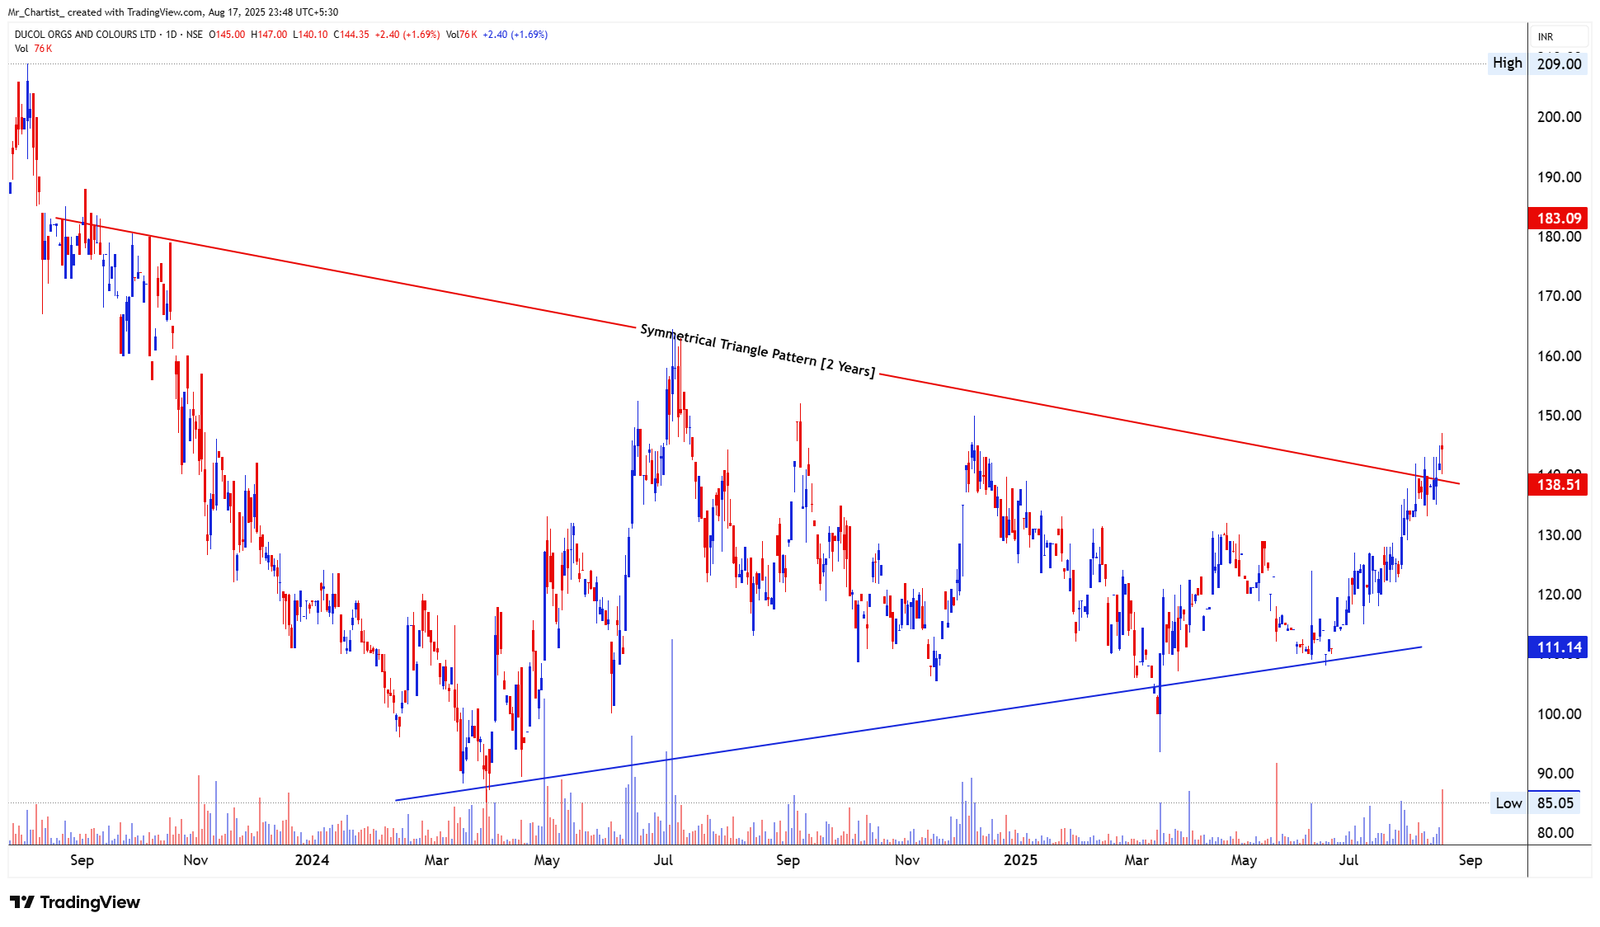
DUCOL ORGS & COLOURS LTD
bearish fnoSymmetrical Triangle
2 Years (Daily Chart – Long-Term)
Thesis & Analysis
The stock has been consolidating inside a broad symmetrical triangle formation for nearly two years and has now delivered a fresh breakout above the descending resistance line. This marks a significant structural shift in trend after prolonged sideways action. Recent price action shows strong bullish candles accompanied by an increase in trading volumes, reflecting institutional participation. A sustained move above the ₹147–₹150 breakout zone would confirm bullish momentum and open the door to higher levels. Candlestick Behavior: Consecutive bullish candles with strong closes above resistance. Breakout candles supported by increasing range and volume, signaling conviction. Volume Analysis: Noticeable volume surge in the recent breakout phase. Sustained higher volumes above resistance would validate continuation of momentum. 2. Crucial Support and Resistance Levels Support Zones: ₹135 – Immediate breakout retest level. ₹120 – Intermediate support from consolidation base. ₹111 – Long-term ascending support trendline. Resistance Zones: ₹147–₹150 – Key breakout confirmation zone. ₹170 – First major upside target. ₹190 – Extended target if momentum accelerates. 3. Strategic Trade Scenarios 🔸 Primary Setup – Breakout Continuation Above ₹150 If price sustains above ₹150 with rising volumes, it confirms a long-term breakout from the symmetrical triangle, opening upside potential toward ₹170–₹190. 🔹 Alternate Setup – Retest of Support If price fails to hold above ₹135, a retest of deeper support around ₹120–₹111 is possible before any renewed bullish move. Breakdown below ₹111 would negate the current bullish outlook.
Price Action
- ■Price action is structurally positive.
- ■Forming higher highs and higher lows.
Volume Profile
- ■Volume is supportive of the price action.
- ■Wait for volume expansion on breakout.
Key Levels
No zones specified
No zones specified
Invalidation Scenario
A weekly close below the support level invalidates this structure.
Hindware
bearish fnoDouble Bottom Breakout
Daily Chart
Thesis & Analysis
No detailed thesis provided for this setup.
Price Action
- ■Price action is structurally positive.
- ■Forming higher highs and higher lows.
Volume Profile
- ■Volume is supportive of the price action.
- ■Wait for volume expansion on breakout.
Key Levels
No zones specified
No zones specified
Invalidation Scenario
A weekly close below the support level invalidates this structure.
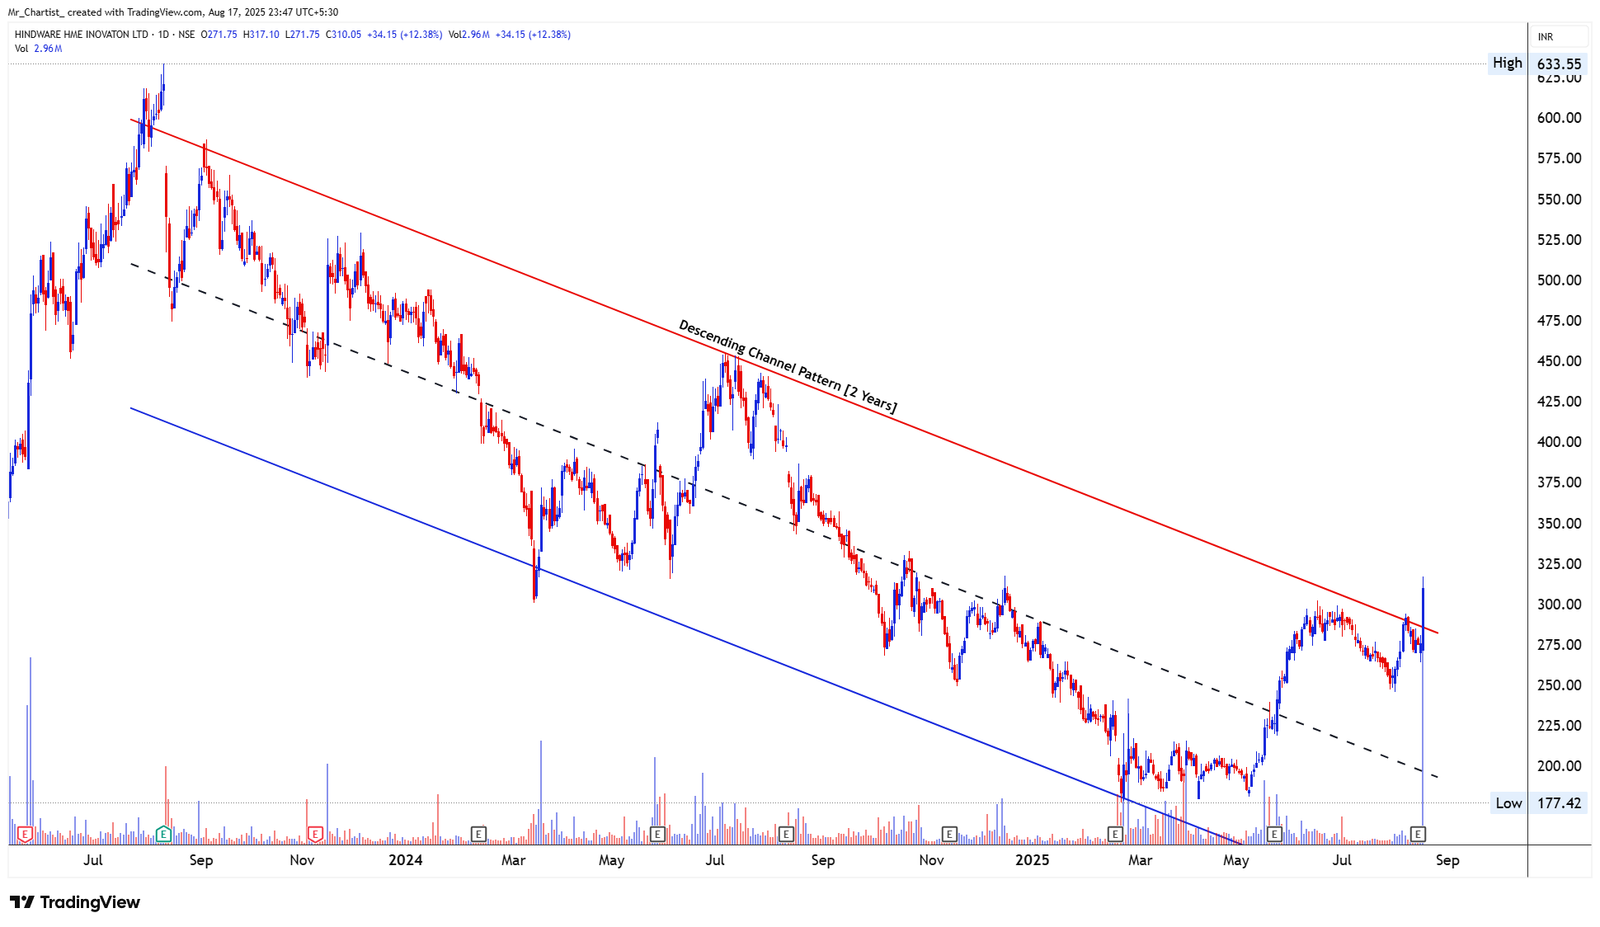
HINDWARE
bearish fnoDescending Channel + Pole & Flag Breakout
2 Years (Daily Chart – Medium-Term)
Thesis & Analysis
Hindware has delivered a decisive breakout from a 2-year descending channel, signaling a structural reversal from its prolonged downtrend. The breakout also aligns with a pole and flag continuation structure, indicating strong upside momentum. The breakout candle was a bullish marubozu on significantly higher-than-average volume, highlighting institutional participation and aggressive buying momentum. This suggests that the stock has entered a fresh bullish phase, with further upside potential if it sustains above support levels. Candlestick Behavior: Bullish marubozu at breakout confirms strong buyer dominance. Large-bodied candles with volume expansion reinforce breakout validity. Volume Analysis: Noticeable volume surge at breakout point confirms strong market participation. Prior accumulation phase indicates steady buildup before breakout. 2. Crucial Support and Resistance Levels Support Zones: ₹270 – Immediate breakout retest support. ₹250 – Secondary cushion from prior consolidation base. ₹225 – Broader structural support. Resistance Zones: ₹375 – First near-term upside objective. ₹420 – Intermediate resistance zone. ₹500 – Extended breakout target if momentum sustains. 3. Strategic Trade Scenarios 🔸 Primary Setup – Sustained Breakout Rally If price sustains above ₹270–₹280, the breakout remains valid, opening the path toward ₹375 and ₹420, with potential extension to ₹500. 🔹 Alternate Setup – Breakdown Below ₹270 If the stock fails to hold above ₹270, weakness may drag the price back into the prior consolidation, exposing levels of ₹250 and ₹225.
Price Action
- ■Price action is structurally positive.
- ■Forming higher highs and higher lows.
Volume Profile
- ■Volume is supportive of the price action.
- ■Wait for volume expansion on breakout.
Key Levels
No zones specified
No zones specified
Invalidation Scenario
A weekly close below the support level invalidates this structure.
Kingfa Sci & Tech
bearish fnoDouble Bottom Breakout
Daily Chart
Thesis & Analysis
No detailed thesis provided for this setup.
Price Action
- ■Price action is structurally positive.
- ■Forming higher highs and higher lows.
Volume Profile
- ■Volume is supportive of the price action.
- ■Wait for volume expansion on breakout.
Key Levels
No zones specified
No zones specified
Invalidation Scenario
A weekly close below the support level invalidates this structure.
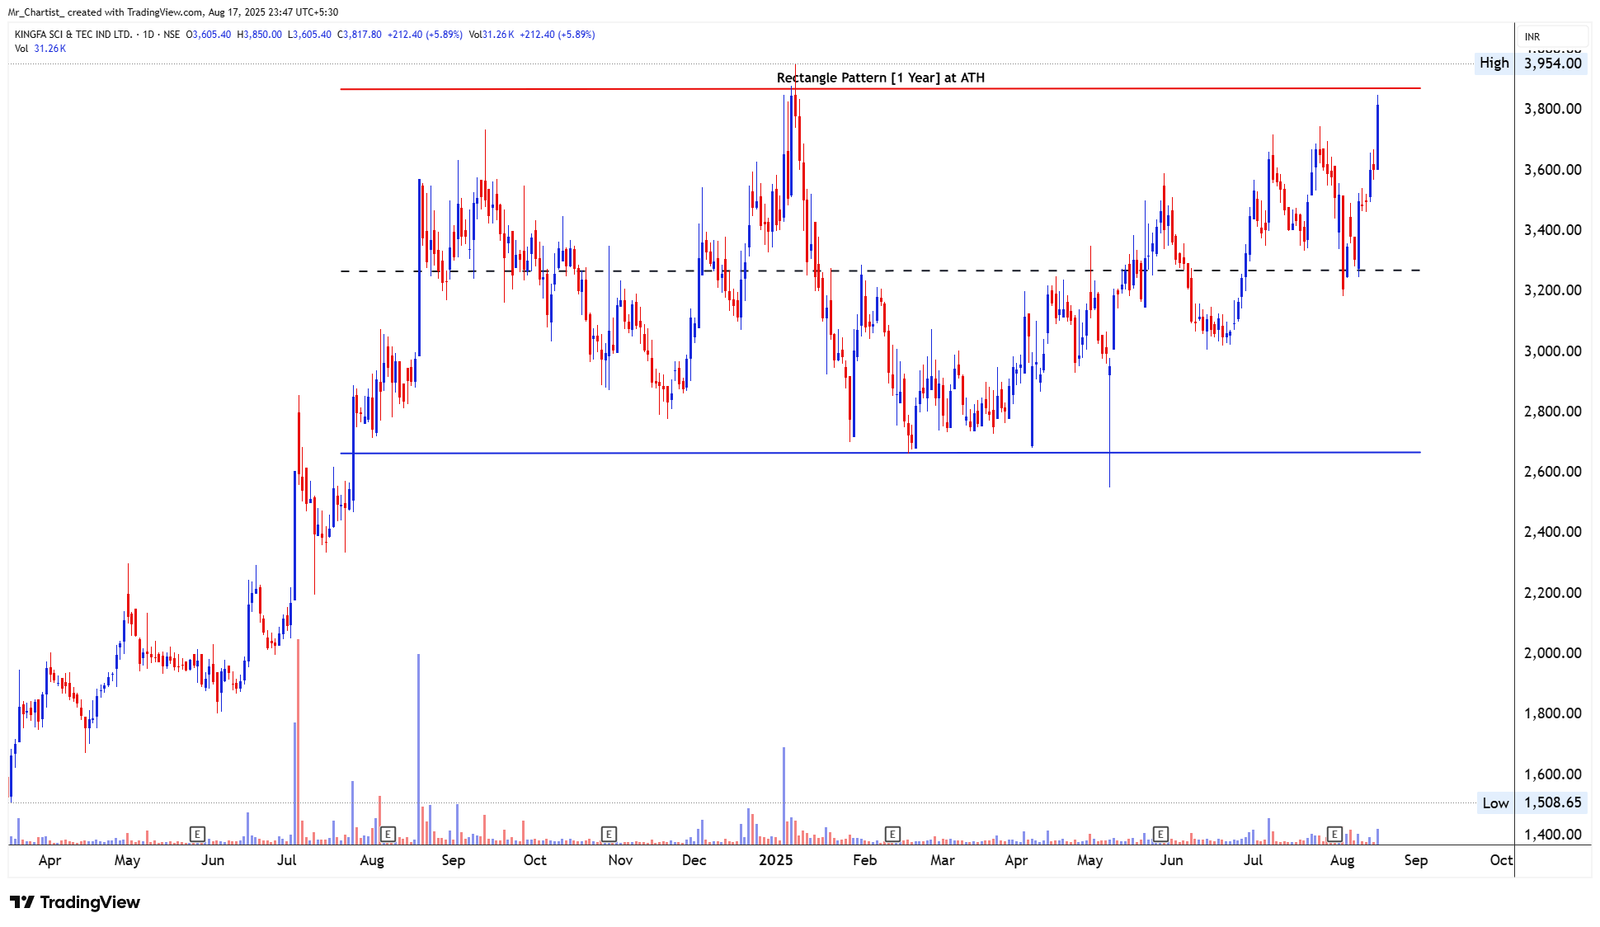
KINGFA SCI & TECH
bearish fnoRectangle Pattern at All-Time High (ATH)
1 Year (Daily Chart – Medium-Term)
Thesis & Analysis
Kingfa has been consolidating within a well-defined rectangle pattern near its all- time highs for the past year. This type of prolonged consolidation near record levels often indicates strong underlying accumulation and sets the stage for a powerful breakout. The price action recently printed a bullish marubozu candle, signaling strong buyer momentum despite temporary profit-booking pressures. The stock is now approaching the crucial resistance at ₹3,900–₹3,950, where a sustained breakout could unlock further upside potential. Candlestick Behavior: Bullish marubozu candles highlight aggressive buying interest. Pullbacks within the rectangle have been met with quick rebounds, suggesting strong demand. Volume Analysis: Volumes have stayed moderate during consolidation. A decisive breakout above ₹3,900 with strong volume expansion will be the key confirmation trigger. 2. Crucial Support and Resistance Levels Support Zones: ₹3,600 – Immediate breakout support. ₹3,300 – Mid-range consolidation support. ₹3,000 – Broader structural base support. Resistance Zones: ₹3,900–₹3,950 – All-time high breakout zone. ₹4,300 – Initial breakout target. ₹4,600 – Extended target if momentum sustains. 3. Strategic Trade Scenarios 🔸 Primary Setup – Breakout at ₹3,900+ If the price crosses and sustains above ₹3,900, it will confirm a fresh all-time high breakout. This could trigger a sharp upside move toward ₹4,300 and ₹4,600 in the coming weeks, supported by the rectangle base formation. 🔹 Alternate Setup – Consolidation Continuation If the stock fails to clear the ₹3,900 resistance, it is likely to continue consolidating between ₹3,300–₹3,900, keeping the structure intact but delaying the breakout.
Price Action
- ■Price action is structurally positive.
- ■Forming higher highs and higher lows.
Volume Profile
- ■Volume is supportive of the price action.
- ■Wait for volume expansion on breakout.
Key Levels
No zones specified
No zones specified
Invalidation Scenario
A weekly close below the support level invalidates this structure.
Sterlite Technologies
bearish fnoDouble Bottom Breakout
Daily Chart
Thesis & Analysis
No detailed thesis provided for this setup.
Price Action
- ■Price action is structurally positive.
- ■Forming higher highs and higher lows.
Volume Profile
- ■Volume is supportive of the price action.
- ■Wait for volume expansion on breakout.
Key Levels
No zones specified
No zones specified
Invalidation Scenario
A weekly close below the support level invalidates this structure.
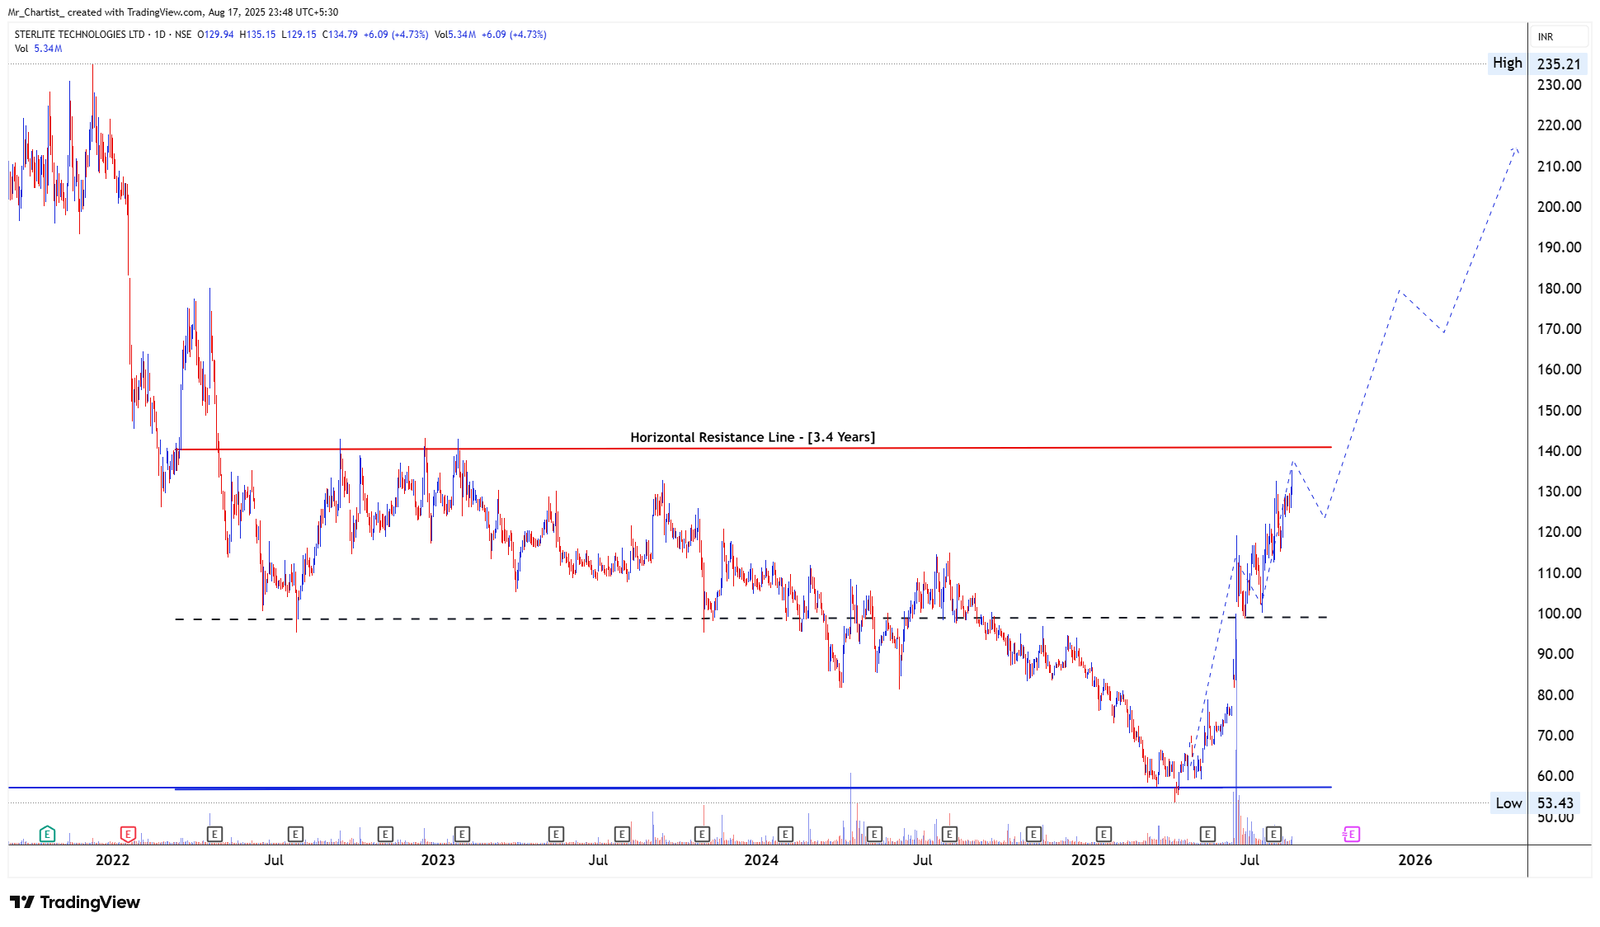
STERLITE TECHNOLOGIES
bearish fnoRectangle Formation with Long-Term Horizontal Resistance
3.4 Years (Daily Chart – Long-Term Structure)
Thesis & Analysis
STLTECH has shown a remarkable rebound, nearly doubling from its recent bottom, after taking strong support near the multi-year base zone. The stock is now trading very close to the crucial horizontal resistance around ₹140, which has capped price action consistently for over 3.4 years. A breakout above this level would mark a major structural shift, signaling long-term trend reversal and unlocking fresh upside potential. The sharp rally has also been supported by expanding volumes, strengthening the bullish case. Candlestick Behavior: Recent price action highlights strong bullish momentum candles after the bottom reversal. Sellers have consistently struggled to push the stock below ₹110–₹100, affirming a strong demand base. Volume Analysis: Notable volume expansion during the rebound rally. Sustained participation above ₹140 would be key to validating a clean breakout. 2. Crucial Support and Resistance Levels Support Zones: ₹110 – First key cushion, recent breakout retest zone. ₹100 – Major demand area, long-term base support. ₹85 – Deeper fallback support if momentum weakens. Resistance Zones: ₹140 – Multi-year resistance and breakout trigger zone. ₹170 – First major upside target post-breakout. ₹210 – Extended rally potential if breakout sustains. 3. Strategic Trade Scenarios 🔸 Primary Setup – Breakout Above ₹140 If price crosses and sustains above ₹140, it would confirm a multi-year breakout, opening the gates for a strong move toward ₹170 and ₹210 in the medium term. The rectangle breakout near ATH resistance would indicate a long-awaited structural turnaround. 🔹 Alternate Setup – Range-Bound Consolidation If the stock fails to cross ₹140, it is likely to remain range-bound between ₹100–₹140, where ₹100–₹110 will act as strong support, while ₹140 continues as the ceiling. This consolidation phase would delay but not negate the breakout prospects.
Price Action
- ■Price action is structurally positive.
- ■Forming higher highs and higher lows.
Volume Profile
- ■Volume is supportive of the price action.
- ■Wait for volume expansion on breakout.
Key Levels
No zones specified
No zones specified
Invalidation Scenario
A weekly close below the support level invalidates this structure.
IMFA
bearish fnoDouble Bottom Breakout
Daily Chart
Thesis & Analysis
No detailed thesis provided for this setup.
Price Action
- ■Price action is structurally positive.
- ■Forming higher highs and higher lows.
Volume Profile
- ■Volume is supportive of the price action.
- ■Wait for volume expansion on breakout.
Key Levels
No zones specified
No zones specified
Invalidation Scenario
A weekly close below the support level invalidates this structure.
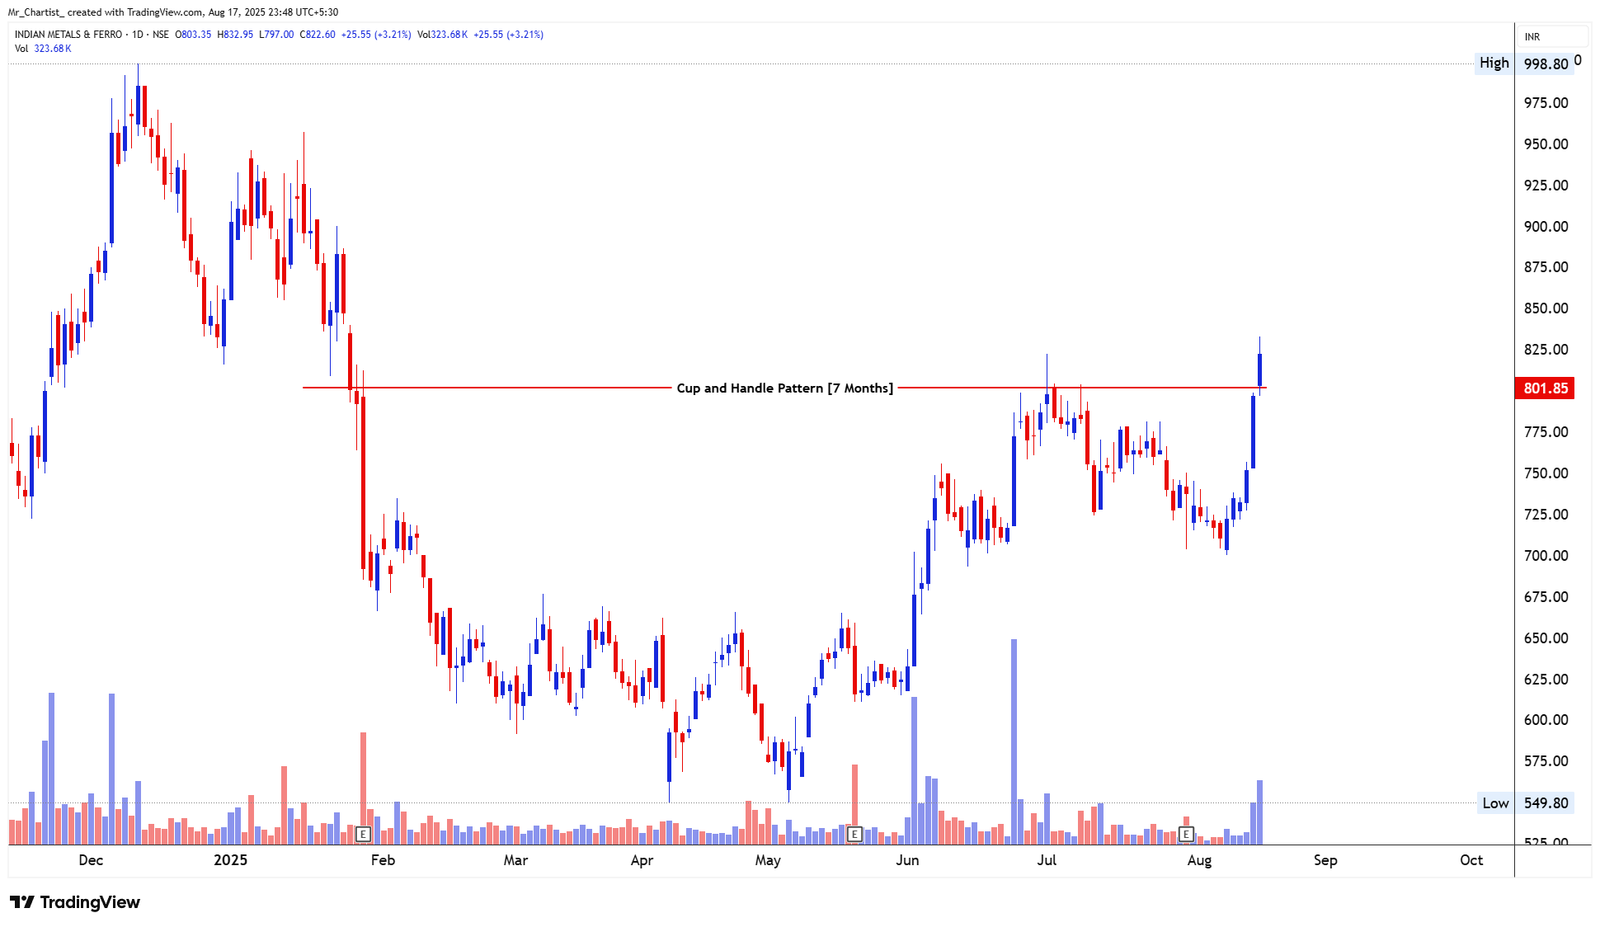
IMFA
bearish fnoCup and Handle
7 Months (Daily Chart – Medium-Term)
Thesis & Analysis
IMFA has completed a cup and handle breakout, supported by strong volume expansion and a bullish marubozu candle formation, signaling a decisive momentum shift. The stock recently faced selling pressure from upper levels, indicating mild profit-booking after the breakout. The key zone to watch is ₹835–₹840, which serves as the immediate breakout confirmation level. A sustained move above this zone will reaffirm the bullish breakout and unlock further upside potential. Candlestick Behavior: Breakout candle with bullish marubozu shows aggressive buying interest. Profit-taking evident near the breakout zone, which is normal after a sharp surge. Volume Analysis: Significant rise in volumes during the breakout phase, indicating strong institutional participation. Sustained volume above ₹835 would further strengthen bullish conviction. 2. Crucial Support and Resistance Levels Support Zones: ₹800 – Immediate support from breakout retest. ₹750 – Strong demand base, secondary cushion. ₹700 – Deeper fallback support if momentum weakens. Resistance Zones: ₹835 – Key breakout confirmation level. ₹925 – First target post breakout. ₹995 – Extended rally target if momentum sustains. 3. Strategic Trade Scenarios 🔸 Primary Setup – Breakout Continuation Above ₹835 If the price crosses and sustains above ₹835, it will validate the breakout and open the path toward ₹925 and ₹995 in the coming weeks. Volume confirmation will be key to sustaining the rally. 🔹 Alternate Setup – Failed Breakout If the stock fails to clear ₹835 and drifts lower, it may retest the ₹750–₹800 zone. A breakdown below ₹750 would weaken the pattern structure and extend consolidation.
Price Action
- ■Price action is structurally positive.
- ■Forming higher highs and higher lows.
Volume Profile
- ■Volume is supportive of the price action.
- ■Wait for volume expansion on breakout.
Key Levels
No zones specified
No zones specified
Invalidation Scenario
A weekly close below the support level invalidates this structure.
IndiGrid Infrastructure Trust
bearish fnoDouble Bottom Breakout
Daily Chart
Thesis & Analysis
No detailed thesis provided for this setup.
Price Action
- ■Price action is structurally positive.
- ■Forming higher highs and higher lows.
Volume Profile
- ■Volume is supportive of the price action.
- ■Wait for volume expansion on breakout.
Key Levels
No zones specified
No zones specified
Invalidation Scenario
A weekly close below the support level invalidates this structure.
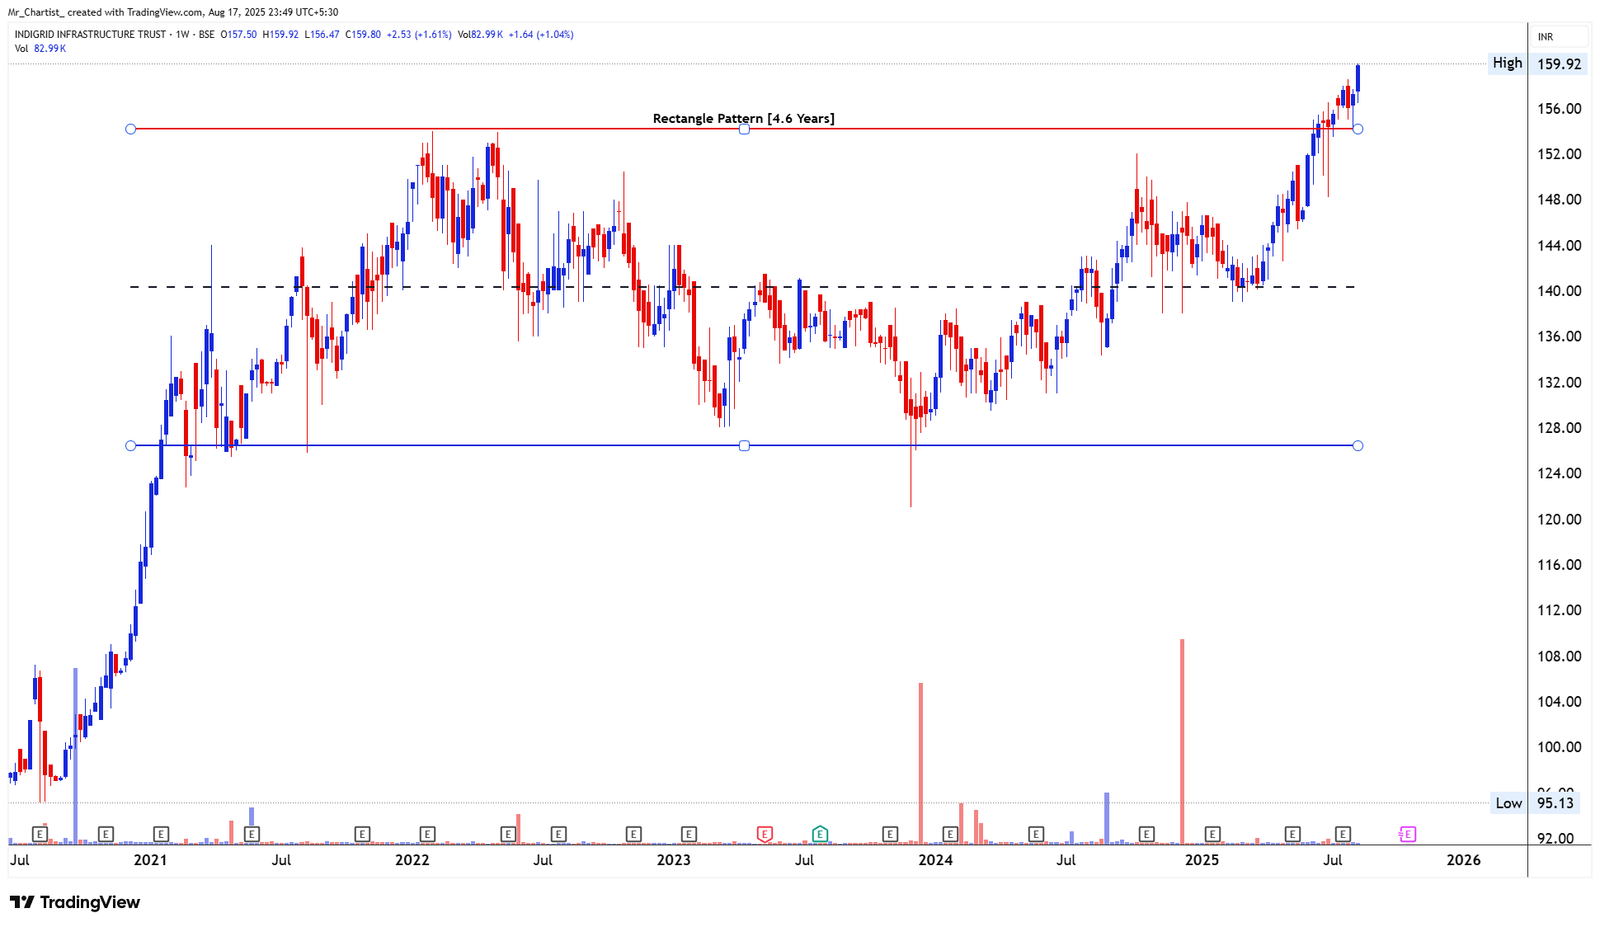
INDIGRID INFRASTRUCTURE TRUST
bearish fnoRectangle Pattern
4.6 Years (Weekly Chart – Long-Term)
Thesis & Analysis
IndiGrid has been consolidating within a rectangle formation for over four and a half years and is now trading near its all-time high zone. Recently, price pushed above the rectangle ceiling around ₹157–₹160, marking a potential breakout attempt. However, volumes remain muted, indicating that conviction is still lacking. A volume-supported breakout above the current levels would significantly strengthen the bullish case. Candlestick Behavior: Recent candles show strong upside momentum with higher highs. Sustained closes above resistance may confirm long-term breakout continuation. Volume Analysis: Breakout lacks major volume support so far. Strong volume expansion above ₹160 would validate a genuine long-term breakout. 2. Crucial Support and Resistance Levels Support Zones: ₹150 – Immediate support from breakout retest. ₹140 – Secondary support and prior consolidation floor. ₹128 – Long-term rectangle base. Resistance Zones: ₹160 – Current breakout level. ₹180 – First target zone if breakout sustains. ₹200–₹230 – Extended long-term upside levels. 3. Strategic Trade Scenarios 🔸 Primary Setup – Breakout Continuation Above ₹160 If price sustains above ₹160 with strong volume participation, it will confirm a rectangle breakout. In that case, the stock can advance toward ₹180, ₹200, and even ₹230+ in the medium to long term. 🔹 Alternate Setup – Weak Breakout / Pullback If volumes remain muted and price slips back below ₹157, a pullback toward ₹150– ₹140 is likely. Sustained weakness below ₹140 could extend consolidation within the rectangle.
Price Action
- ■Price action is structurally positive.
- ■Forming higher highs and higher lows.
Volume Profile
- ■Volume is supportive of the price action.
- ■Wait for volume expansion on breakout.
Key Levels
No zones specified
No zones specified
Invalidation Scenario
A weekly close below the support level invalidates this structure.
Shree Ajit Pulp & Paper Ltd
bearish fnoDouble Bottom Breakout
Daily Chart
Thesis & Analysis
No detailed thesis provided for this setup.
Price Action
- ■Price action is structurally positive.
- ■Forming higher highs and higher lows.
Volume Profile
- ■Volume is supportive of the price action.
- ■Wait for volume expansion on breakout.
Key Levels
No zones specified
No zones specified
Invalidation Scenario
A weekly close below the support level invalidates this structure.
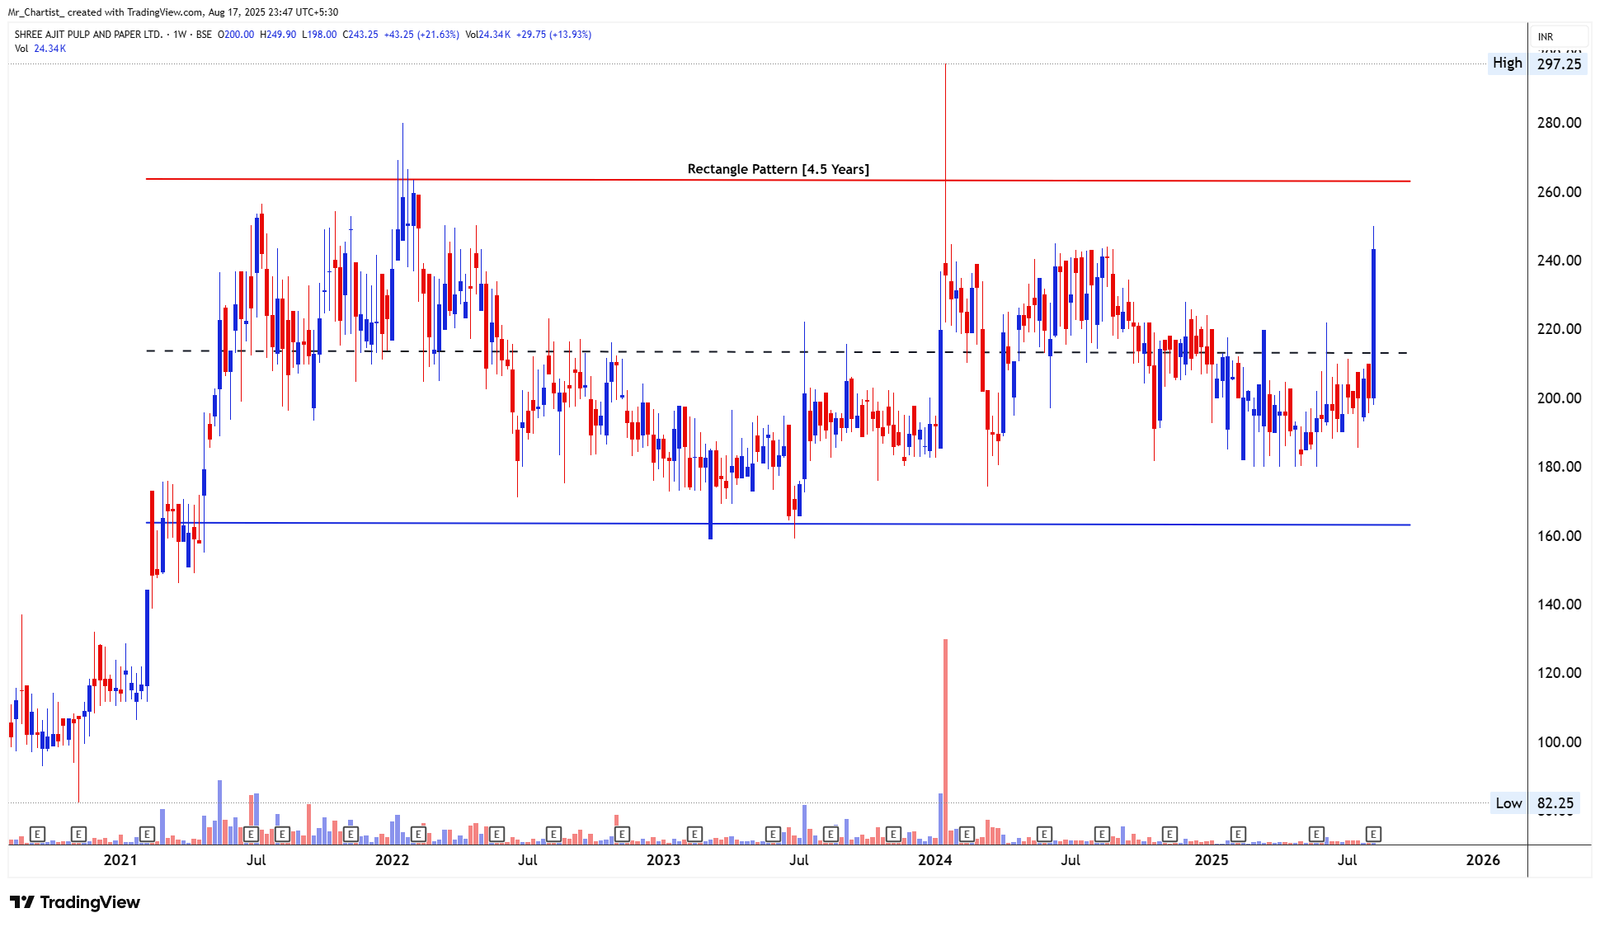
SHREE AJIT PULP & PAPER LTD
bearish fnoRectangle
4.5 Years (Weekly Chart – Long-Term)
Thesis & Analysis
SAPPL has been consolidating in a large rectangle pattern for nearly 4.5 years, oscillating between well-defined support and resistance zones. The current price action is trading near the upper boundary of the rectangle, close to its all-time high. A breakout above the ₹260 resistance zone would mark a significant long-term breakout, potentially unleashing strong bullish momentum. However, volumes remain relatively subdued, and a strong volume build-up at the breakout point will be crucial for confirmation. Candlestick Behavior: Strong bullish candles have emerged from the mid-range support zone. The recent surge indicates renewed accumulation near key resistance. Volume Analysis: Volume expansion is missing at the moment. A sustained breakout above ₹260 with a spike in volumes will validate bullish continuation. 2. Crucial Support and Resistance Levels Support Zones: ₹220 – Immediate support from recent breakout attempt. ₹200 – Historical support within rectangle consolidation. ₹170 – Long-term rectangle base support. Resistance Zones: ₹260 – Key rectangle breakout trigger. ₹300 – First major upside target post breakout. ₹350–₹400 – Extended long-term targets if momentum strengthens. 3. Strategic Trade Scenarios 🔸 Primary Setup – Breakout Above ₹260 If price sustains above ₹260 with a surge in volume, it would confirm a long-term rectangle breakout, opening upside potential toward ₹300 initially, and further toward ₹350–₹400 in the long run. 🔹 Alternate Setup – Failure Near ₹260 If price fails to sustain above ₹260, SAPPL may continue consolidating within the ₹170–₹260 range until a decisive breakout occurs. Breakdown below ₹200 would weaken the structure, shifting momentum back to the lower rectangle band.
Price Action
- ■Price action is structurally positive.
- ■Forming higher highs and higher lows.
Volume Profile
- ■Volume is supportive of the price action.
- ■Wait for volume expansion on breakout.
Key Levels
No zones specified
No zones specified
Invalidation Scenario
A weekly close below the support level invalidates this structure.
Avance Technologies Ltd
bearish fnoDouble Bottom Breakout
Daily Chart
Thesis & Analysis
No detailed thesis provided for this setup.
Price Action
- ■Price action is structurally positive.
- ■Forming higher highs and higher lows.
Volume Profile
- ■Volume is supportive of the price action.
- ■Wait for volume expansion on breakout.
Key Levels
No zones specified
No zones specified
Invalidation Scenario
A weekly close below the support level invalidates this structure.
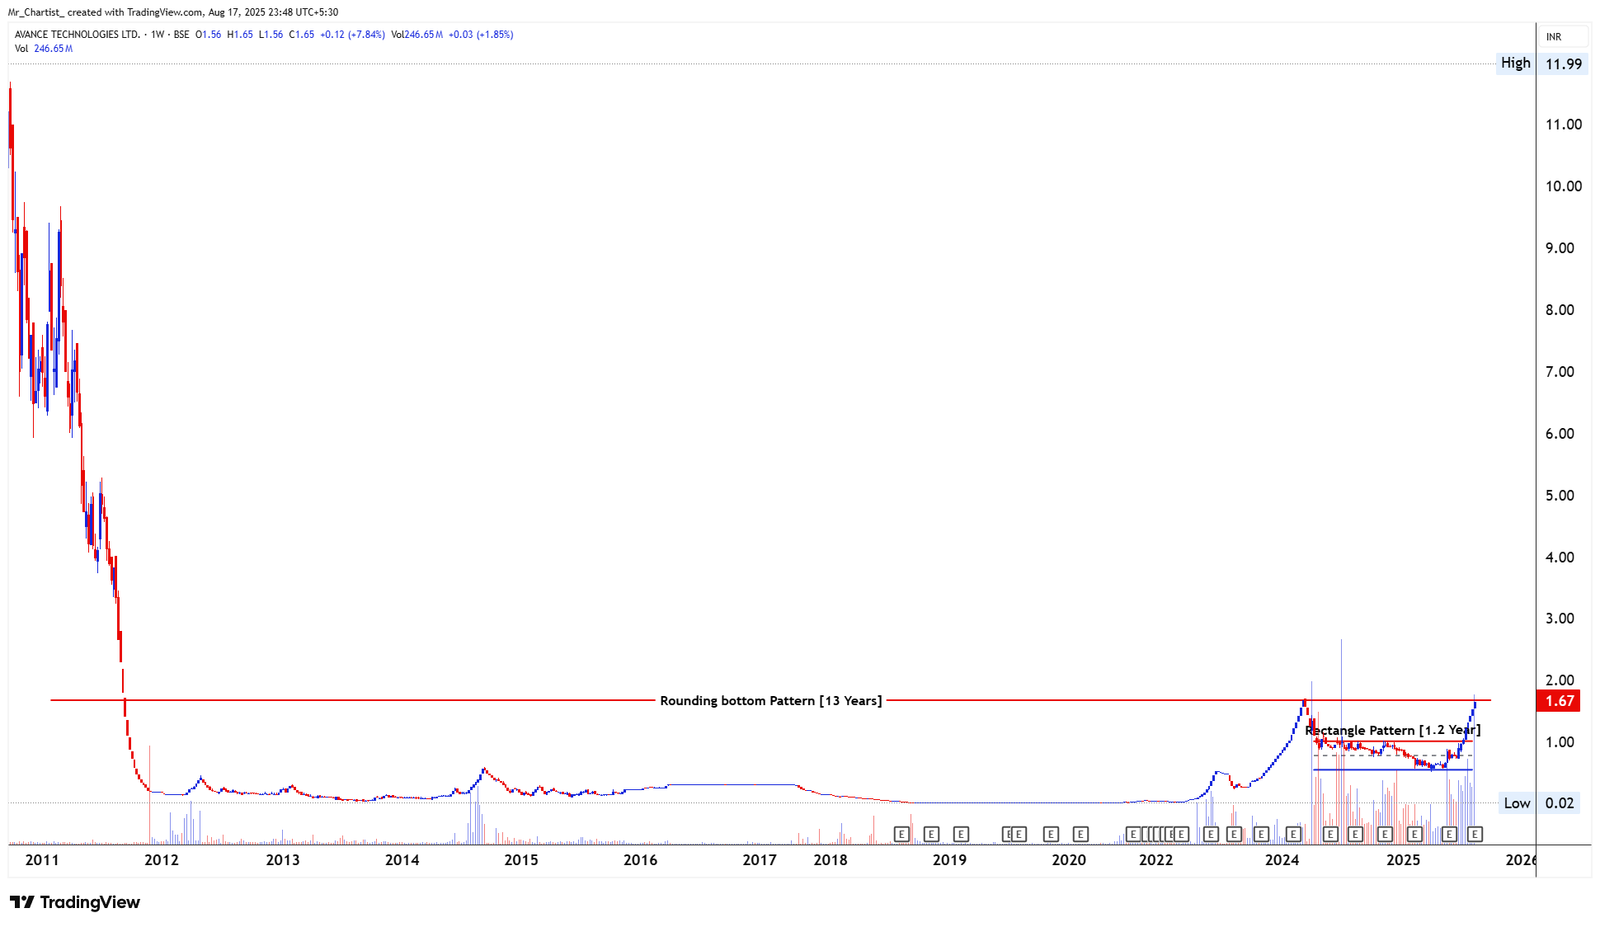
AVANCE TECHNOLOGIES LTD
bearish fnoRounding Bottom + Rectangle Consolidation
13 Years (Weekly Chart – Ultra Long-Term) + 1.2 Years (Rectangle)
Thesis & Analysis
Avance Technologies is displaying one of the rare multi-decade rounding bottom formations, stretching over 13 years, with a well-defined resistance near the ₹1.70 zone. Within this broader structure, the stock has also formed a 1.2-year rectangle consolidation, tightening price action just below the breakout point. The structure suggests that a breakout above ₹1.70, sustained on weekly closes, could trigger a long-term trend reversal and unlock massive upside potential toward the ₹4–₹9 zone over the coming months and years. Candlestick Behavior: Recent bullish candles with expanding bodies show accumulation interest. Price rejection wicks around ₹1.70 highlight this as a key breakout pivot. Volume Analysis: Significant volume spikes have appeared recently, aligning with accumulation phases. A volume surge on breakout will be the ultimate confirmation of strength. 2. Crucial Support and Resistance Levels Support Zones: ₹1.20 – Strong rectangle base support. ₹1.00 – Psychological round number and long-term consolidation floor. ₹0.50 – Historical demand zone from accumulation years. Resistance Zones: ₹1.70 – Key long-term breakout trigger. ₹4.00 – First major upside target if breakout sustains. ₹9.00 – Extended long-term target aligned with pattern implication. 3. Strategic Trade Scenarios 🔸 Primary Setup – Breakout Above ₹1.70 A confirmed breakout above ₹1.70 with heavy volumes would mark the completion of the 13-year rounding bottom, opening the door for a multi-fold rally toward ₹4 initially, with potential toward ₹9 over the longer horizon. 🔹 Alternate Setup – Failure to Break ₹1.70 If price fails to sustain above ₹1.70, the stock may continue to consolidate within the ₹1.00–₹1.70 rectangle range. Breakdown below ₹1.00 could drag the price back into a deeper consolidation zone near ₹0.50.
Price Action
- ■Price action is structurally positive.
- ■Forming higher highs and higher lows.
Volume Profile
- ■Volume is supportive of the price action.
- ■Wait for volume expansion on breakout.
Key Levels
No zones specified
No zones specified
Invalidation Scenario
A weekly close below the support level invalidates this structure.
Digispice Technologies
bearish fnoDouble Bottom Breakout
Daily Chart
Thesis & Analysis
No detailed thesis provided for this setup.
Price Action
- ■Price action is structurally positive.
- ■Forming higher highs and higher lows.
Volume Profile
- ■Volume is supportive of the price action.
- ■Wait for volume expansion on breakout.
Key Levels
No zones specified
No zones specified
Invalidation Scenario
A weekly close below the support level invalidates this structure.

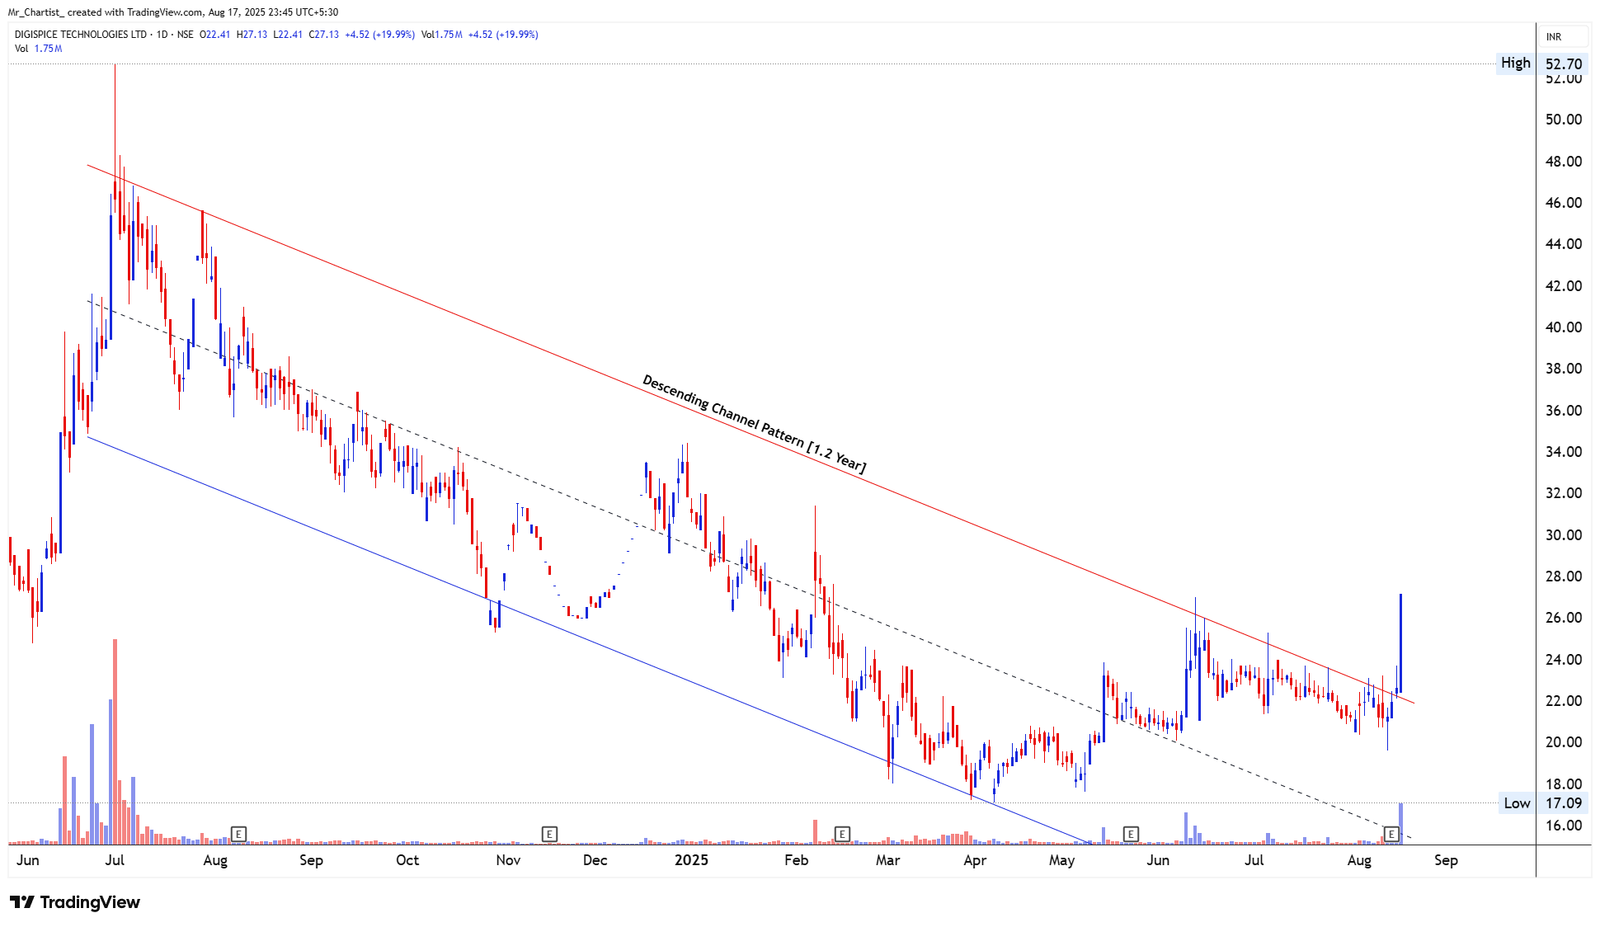
DIGISPICE TECHNOLOGIES
bearish fnoDescending Channel
1.2 Years (Daily Chart – Medium-Term)
Thesis & Analysis
Digispice has been consolidating in a descending channel for the past 14 months, with a clear sequence of lower highs and lower lows. Recently, the stock has broken above the upper boundary of the channel with a massive volume spike, signaling a potential trend reversal. This breakout candle also comes after weeks of base-building near ₹20, confirming strong accumulation at lower levels. The breakout structure suggests bullish follow-through toward higher zones. Candlestick Behavior: A long bullish breakout candle confirms strong momentum. Previous weeks show small-bodied candles, indicating absorption of supply. Volume Analysis: Today’s volume is significantly above average, validating breakout strength. Volume expansion on an upside breakout indicates institutional activity. 2. Crucial Support and Resistance Levels Support Zones: ₹25 – Immediate post-breakout support. ₹20 – Strong demand zone, recent base support. ₹17 – Long-term structural low. Resistance Zones: ₹36 – First resistance zone post breakout. ₹46 – Extended target zone if momentum continues. ₹52 – Historical swing high. 3. Strategic Trade Scenarios 🔸 Primary Setup – Sustained Breakout Above ₹25 If price sustains above ₹25 with volume, it would confirm a valid breakout from the descending channel, opening upside potential toward ₹36 and ₹46. 🔹 Alternate Setup – Pullback to Support If the stock fails to sustain momentum and slips back below ₹25, a retest of the ₹20–₹22 support zone is likely. Breakdown below ₹20 could extend consolidation within the ₹17–₹25 range.
Price Action
- ■Price action is structurally positive.
- ■Forming higher highs and higher lows.
Volume Profile
- ■Volume is supportive of the price action.
- ■Wait for volume expansion on breakout.
Key Levels
No zones specified
No zones specified
Invalidation Scenario
A weekly close below the support level invalidates this structure.
✅ Everest Kanto Cylinder
bearish fnoCup and Handle
6 Months (Daily Chart – Medium-Term)
Thesis & Analysis
EKC has recently broken out of a cup and handle formation, a bullish continuation pattern that took shape over the last six months. The breakout was accompanied by a large bullish candlestick with a breakaway gap, supported by strong volumes – a sign of aggressive institutional participation. However, the latest session shows signs of profit booking, as the stock retraced after testing higher levels. Sustaining above the ₹157 zone will be crucial to confirm the breakout’s strength and avoid a false move. Candlestick Behavior: Breakaway gap breakout candle shows strong upward conviction. Latest candle suggests profit booking, a natural reaction post-gap rally. Volume Analysis: Massive volume spike during breakout validates strength. Sustained high activity will be needed for follow-through. 2. Crucial Support and Resistance Levels Support Zones: ₹145 – Immediate post-breakout support. ₹135–₹130 – Strong base and handle support. ₹120 – Deeper structural demand zone. Resistance Zones: ₹157 – Key breakout confirmation level. ₹180 – First upside target. ₹220 – Extended resistance if momentum sustains. 3. Strategic Trade Scenarios 🔸 Primary Setup – Breakout Continuation Above ₹157 If price sustains above ₹157, it would confirm the cup and handle breakout, unlocking potential upside toward ₹180 and ₹220 in the coming sessions. 🔹 Alternate Setup – Failure Below ₹145 If price falls back below ₹145, it risks turning into a bull trap, with possible downside extension toward the ₹135–₹130 support zone. A deeper failure could drag the stock back into its prior consolidation range.
Price Action
- ■Price action is structurally positive.
- ■Forming higher highs and higher lows.
Volume Profile
- ■Volume is supportive of the price action.
- ■Wait for volume expansion on breakout.
Key Levels
No zones specified
No zones specified
Invalidation Scenario
A weekly close below the support level invalidates this structure.
Rishabh Instruments
bearish fnoDouble Bottom Breakout
Daily Chart
Thesis & Analysis
No detailed thesis provided for this setup.
Price Action
- ■Price action is structurally positive.
- ■Forming higher highs and higher lows.
Volume Profile
- ■Volume is supportive of the price action.
- ■Wait for volume expansion on breakout.
Key Levels
No zones specified
No zones specified
Invalidation Scenario
A weekly close below the support level invalidates this structure.
Chart Image Not Extracted
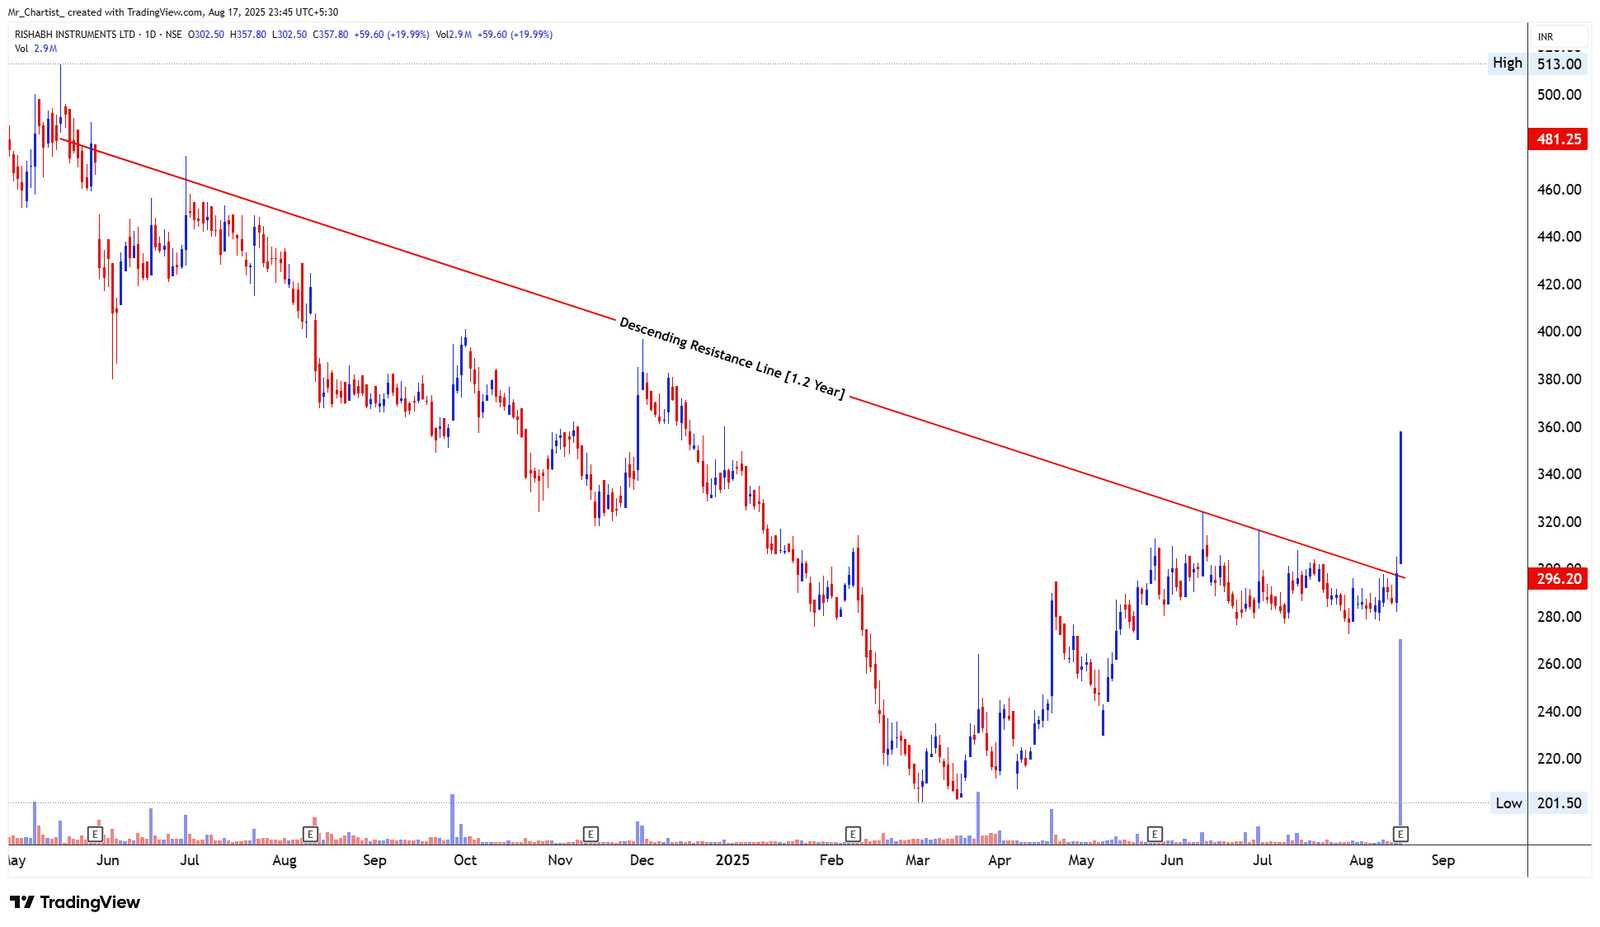
RISHABH INSTRUMENTS
bearish fnoDescending Resistance Line + Cup & Handle
1.2 Years (Daily Chart – Medium-Term)
Thesis & Analysis
Rishabh Instruments has broken above a descending resistance line, which has held for over a year, marking a decisive shift in trend structure. The breakout coincided with the formation of a cup and handle pattern around ₹320, confirmed with a large bullish marubozu candle and upper circuit move on heavy volumes. The strong volume spike accompanying the breakout suggests institutional participation and validates the strength of this move. If the stock sustains above ₹320, it sets the stage for a medium-term rally. Candlestick Behavior: Bullish marubozu candle at breakout zone shows aggressive momentum. Upper circuit on breakout day confirms strong demand absorption. Volume Analysis: Volume expansion at breakout was significantly above average, reinforcing strength. Sustained accumulation is visible in prior sessions before breakout. 2. Crucial Support and Resistance Levels Support Zones: ₹320 – Breakout and handle support, crucial for continuation. ₹285–₹290 – Secondary cushion from prior consolidation. ₹260 – Broader structural support. Resistance Zones: ₹400 – Near-term resistance and psychological round number. ₹481 – Extended target from prior swing high. ₹513 – Major long-term resistance. 3. Strategic Trade Scenarios 🔸 Primary Setup – Sustained Breakout Above ₹320 If the stock sustains above ₹320, the breakout remains valid, paving the way for a rally toward ₹400 and ₹481 in the coming weeks. 🔹 Alternate Setup – Failure Below ₹320 If price fails to hold above ₹320, a pullback could retest ₹285–₹290, with extended downside risk toward ₹260 if selling pressure intensifies.
Price Action
- ■Price action is structurally positive.
- ■Forming higher highs and higher lows.
Volume Profile
- ■Volume is supportive of the price action.
- ■Wait for volume expansion on breakout.
Key Levels
No zones specified
No zones specified
Invalidation Scenario
A weekly close below the support level invalidates this structure.
Charts to Watch
Setups forming favorable structures
Nifty 50 Index
charts to-watchDouble Bottom Breakout
Daily Chart
Thesis & Analysis
No detailed thesis provided for this setup.
Price Action
- ■Price action is structurally positive.
- ■Forming higher highs and higher lows.
Volume Profile
- ■Volume is supportive of the price action.
- ■Wait for volume expansion on breakout.
Key Levels
No zones specified
No zones specified
Invalidation Scenario
A weekly close below the support level invalidates this structure.
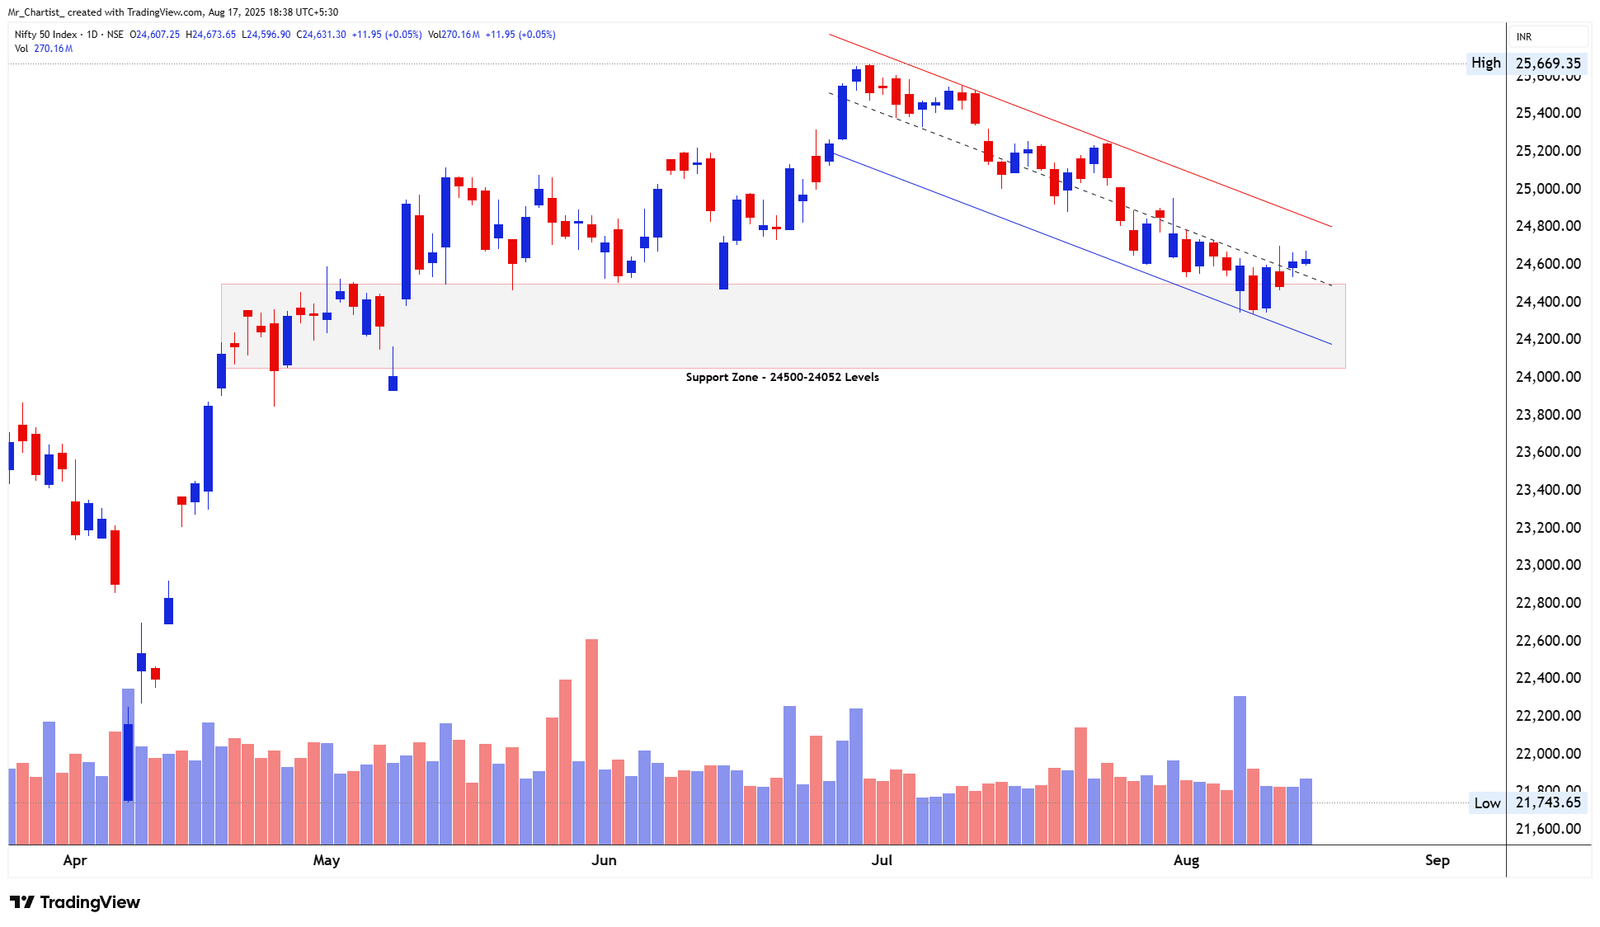
NIFTY 50 INDEX
charts to-watchDescending Channel within Horizontal Support Zone
3 Months (Daily Chart – Sideways to Mildly Bearish Phase)
Thesis & Analysis
Nifty is currently trading around a strong horizontal support zone between 24,200 and 24,500, which has held price action multiple times over the past few months. This zone is keeping the index in a consolidation phase, preventing a deeper fall for now. In the short term, price has also formed a descending channel pattern, with lower highs and lower lows showing controlled selling pressure. Currently, Nifty is attempting to stabilize near the bottom of this structure. A breakout above 24,800–25,000 would signal the end of this short-term downtrend and potentially lead to a fresh upward move. Failure to break out would mean continued sideways consolidation within 24,200–24,800. A major downside risk opens only if price decisively breaks below 24,000, which would shift sentiment strongly bearish. Candlestick Behavior: Recent candles near support show small bodies with mild lower shadows, suggesting attempts at buying but with weak follow-through. No strong bullish reversal formation has yet emerged, keeping the bias cautious. Volume Analysis: Selling days have been accompanied by relatively stronger volume, pointing to distribution pressure. A genuine breakout would need a volume spike on green candles to confirm buyer strength. 2. Crucial Support and Resistance Levels Support Zones: 1.24,200–24,500 – Immediate support and consolidation floor. 2.24,000 – Major breakdown trigger; losing this opens further downside. 3.23,500 – Extended support if breakdown occurs. Resistance Zones: 1.24,800 – First breakout level above the descending channel. 2.25,000 – Psychological resistance; stronger breakout confirmation if sustained. 3.25,300–25,660 – Higher resistance zone; previous range top.
Price Action
- ■Price action is structurally positive.
- ■Forming higher highs and higher lows.
Volume Profile
- ■Volume is supportive of the price action.
- ■Wait for volume expansion on breakout.
Key Levels
No zones specified
No zones specified
Invalidation Scenario
A weekly close below the support level invalidates this structure.
NIFTY 50 INDEX
charts to-watchDouble Bottom Breakout
Daily Chart
Thesis & Analysis
No detailed thesis provided for this setup.
Price Action
- ■Price action is structurally positive.
- ■Forming higher highs and higher lows.
Volume Profile
- ■Volume is supportive of the price action.
- ■Wait for volume expansion on breakout.
Key Levels
No zones specified
No zones specified
Invalidation Scenario
A weekly close below the support level invalidates this structure.
Nifty PSU Bank
charts to-watchDouble Bottom Breakout
Daily Chart
Thesis & Analysis
No detailed thesis provided for this setup.
Price Action
- ■Price action is structurally positive.
- ■Forming higher highs and higher lows.
Volume Profile
- ■Volume is supportive of the price action.
- ■Wait for volume expansion on breakout.
Key Levels
No zones specified
No zones specified
Invalidation Scenario
A weekly close below the support level invalidates this structure.
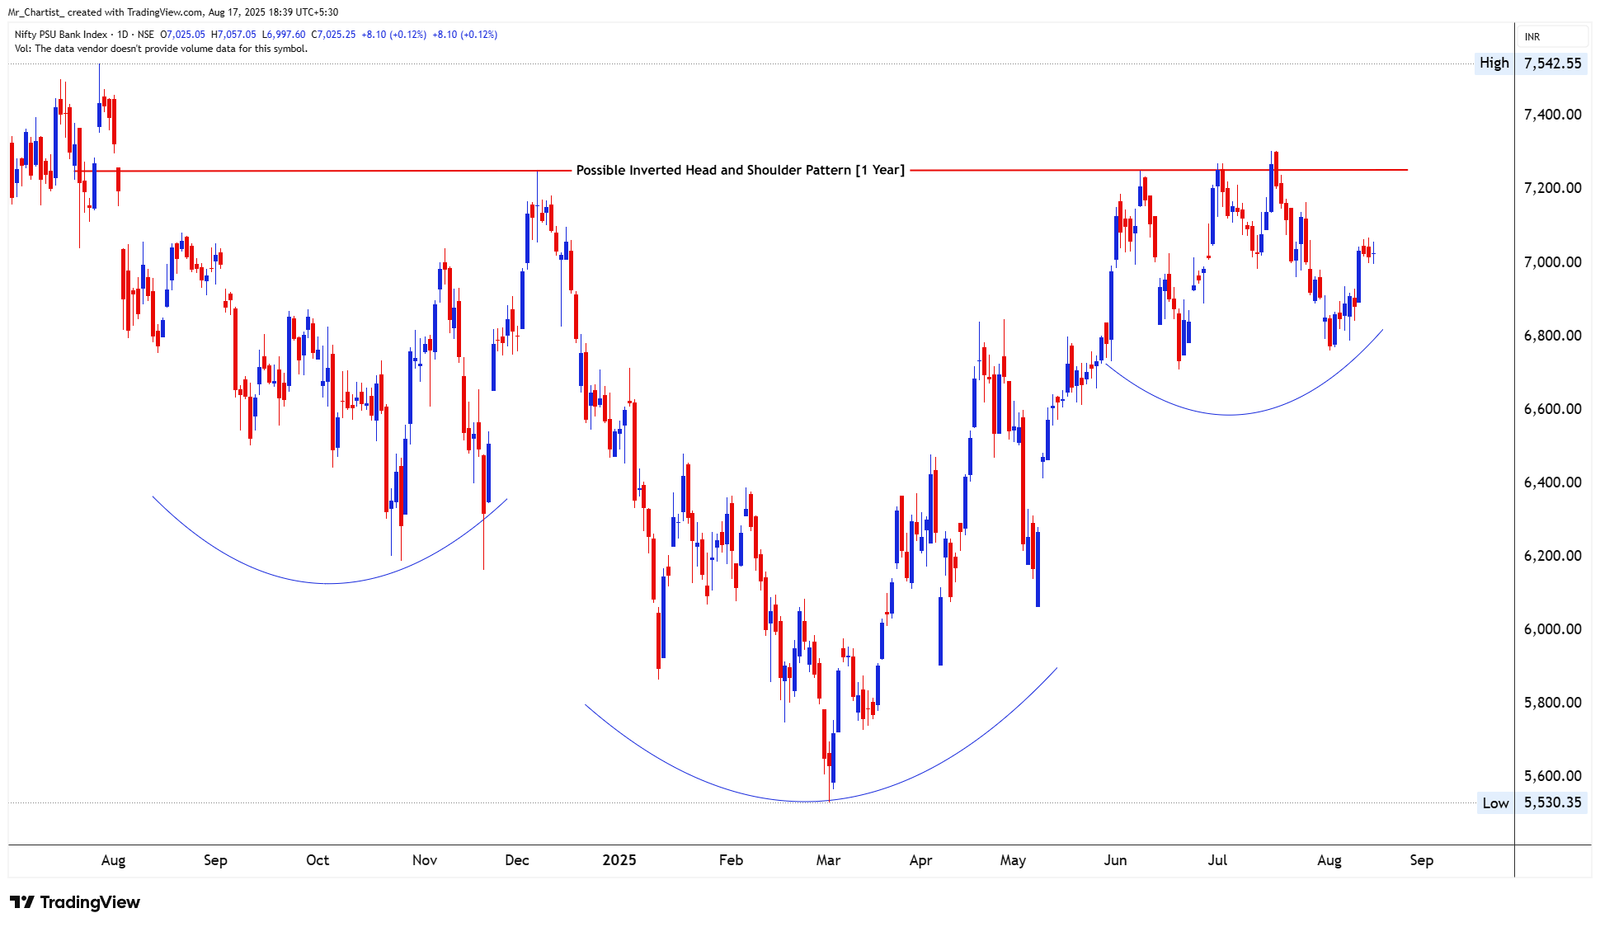
NIFTY PSU BANK
charts to-watchInverted Head & Shoulders (Possible Bullish Reversal)
1 Year (Daily Chart – Developing Setup)
Thesis & Analysis
Nifty PSU Bank has been forming a large inverted head and shoulders pattern over the past year. The left shoulder formed in September 2024, the head bottomed in March 2025, and the right shoulder is shaping up through July– August 2025. Currently, the index has bounced from the 6,800 support zone (the right shoulder base) and is now moving upward. However, price action near resistance has been indecisive, with smaller-bodied candles showing hesitation from both buyers and sellers. The neckline of the pattern sits at 7,200 – this is the critical breakout level. A successful breakout above this point would validate the bullish reversal setup and could trigger a strong rally in the coming sessions. 2. Crucial Support and Resistance Levels Support Zones: 1.6,800 – Right shoulder support; breakdown here weakens the pattern. 2.6,500 – Next support zone if 6,800 fails. 3.6,200 – Broader structural support from previous swing lows. Resistance Zones: 1.7,200 – Neckline and breakout confirmation level. 2.7,550 – First post-breakout target. 3.7,750–7,950 – Extended breakout targets if momentum builds. 3. Strategic Trade Scenarios 🔸 Primary Setup – Breakout Above 7,200 If the index closes above 7,200 and sustains, the inverted head & shoulders pattern would confirm. This could open an upside move first toward 7,550, then 7,750–7,950 in the medium term. 🔹 Alternate Setup – Breakdown Below 6,800 If the index fails to hold 6,800 and sustains below it, the right shoulder would break down. This would negate the bullish reversal structure and expose downside levels of 6,500 and possibly 6,200.
Price Action
- ■Price action is structurally positive.
- ■Forming higher highs and higher lows.
Volume Profile
- ■Volume is supportive of the price action.
- ■Wait for volume expansion on breakout.
Key Levels
No zones specified
No zones specified
Invalidation Scenario
A weekly close below the support level invalidates this structure.
Nifty Pharma
charts to-watchDouble Bottom Breakout
Daily Chart
Thesis & Analysis
No detailed thesis provided for this setup.
Price Action
- ■Price action is structurally positive.
- ■Forming higher highs and higher lows.
Volume Profile
- ■Volume is supportive of the price action.
- ■Wait for volume expansion on breakout.
Key Levels
No zones specified
No zones specified
Invalidation Scenario
A weekly close below the support level invalidates this structure.
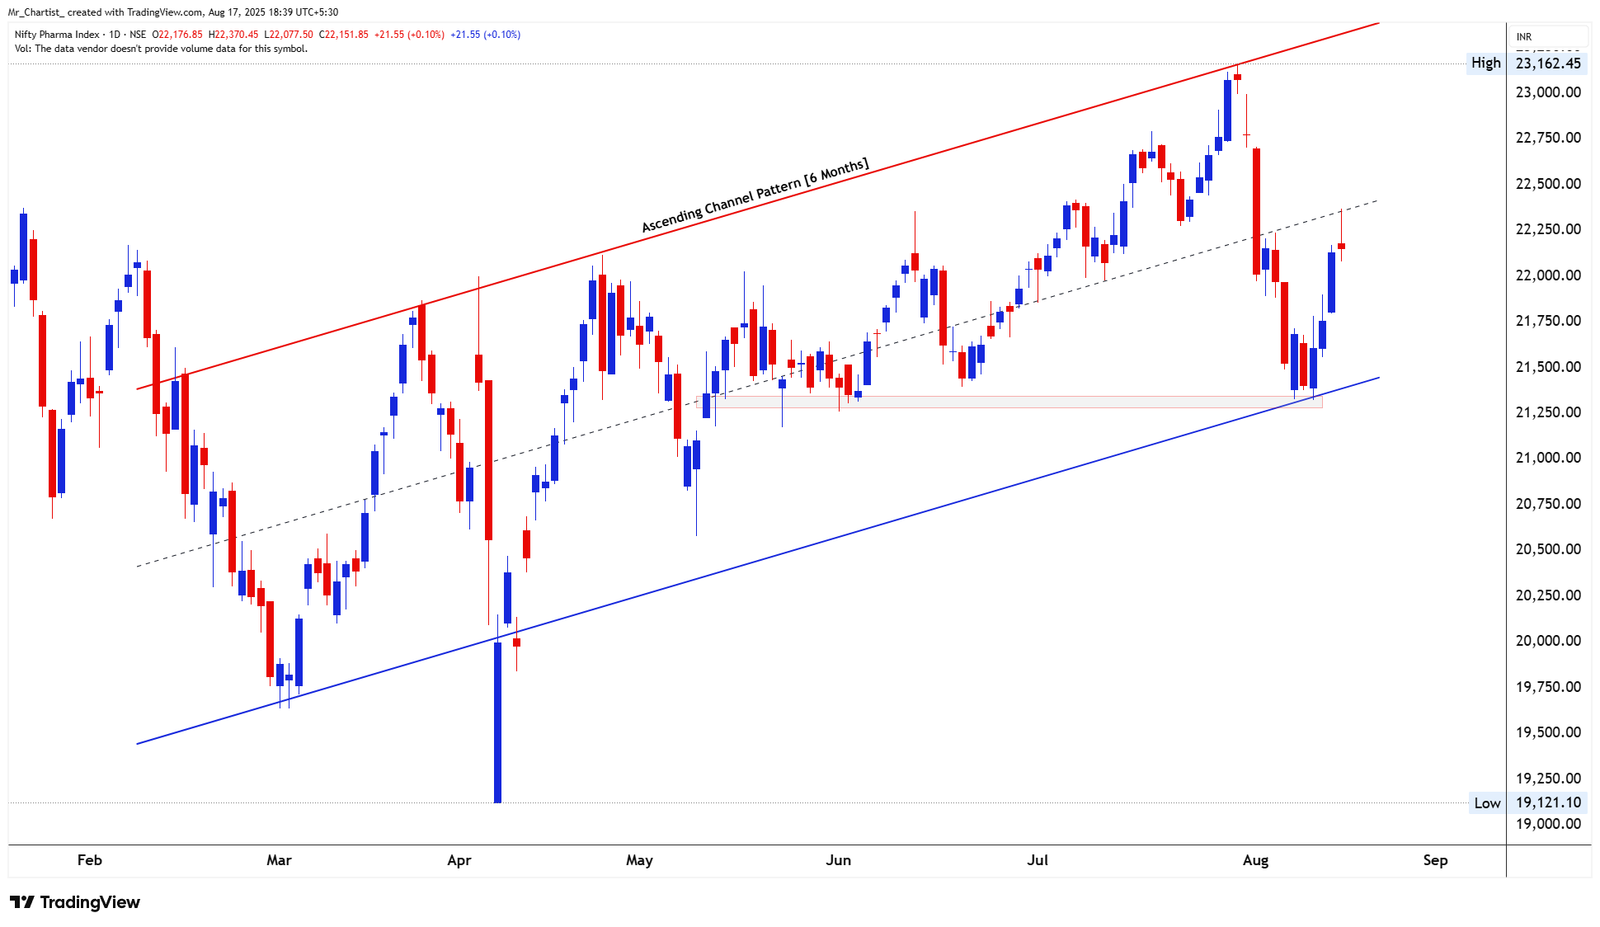
NIFTY PHARMA
charts to-watchAscending Channel
6 Months (Daily Chart – Ongoing Trend)
Thesis & Analysis
Nifty Pharma has been trading inside a well-defined ascending channel for the last six months. Recently, the index touched the upper resistance trendline around 23,000 and reversed sharply, suggesting sellers are active at higher levels. This pullback brought the price down to the lower support trendline near 21,250, which also aligns with a horizontal demand zone. This confluence support zone makes 21,250 a decisive level. Holding above it could attract fresh buying and trigger a rebound. However, a decisive close below this level would indicate that the uptrend is weakening and open the door for a deeper correction. Candlestick Behavior: Recent candles near 21,250 show narrow bodies and smaller wicks, reflecting indecision and possible stabilization. No strong reversal pattern yet; confirmation is required with a wide-bodied bullish candle before calling a bounce. 2. Crucial Support and Resistance Levels Support Zones: 21,250 – Major trendline + horizontal confluence support; critical short-term level. 21,000 – Next cushion if 21,250 breaks. 20,500 – Deeper support zone; medium-term demand area. Resistance Zones: 21,800 – Minor resistance from recent pullback highs. 22,300 – Mid-channel resistance; short-term breakout level. 23,000–23,150 – Upper channel boundary; recent rejection zone. 3. Strategic Trade Scenarios 🔸 Primary Setup – Bounce from Support Zone If Nifty Pharma holds above 21,250 and forms a bullish candle, we may see a rebound toward 21,800 and later 22,300. Sustaining above 22,300 could reopen upside potential toward the 23,000 channel top. 🔹 Alternate Setup – Breakdown from Channel Support If the index closes below 21,250 with follow-through selling, the ascending channel will weaken. This would expose downside levels at 21,000 and possibly 20,500, signaling a deeper pullback phase.
Price Action
- ■Price action is structurally positive.
- ■Forming higher highs and higher lows.
Volume Profile
- ■Volume is supportive of the price action.
- ■Wait for volume expansion on breakout.
Key Levels
No zones specified
No zones specified
Invalidation Scenario
A weekly close below the support level invalidates this structure.
Nifty IT
charts to-watchDouble Bottom Breakout
Daily Chart
Thesis & Analysis
No detailed thesis provided for this setup.
Price Action
- ■Price action is structurally positive.
- ■Forming higher highs and higher lows.
Volume Profile
- ■Volume is supportive of the price action.
- ■Wait for volume expansion on breakout.
Key Levels
No zones specified
No zones specified
Invalidation Scenario
A weekly close below the support level invalidates this structure.
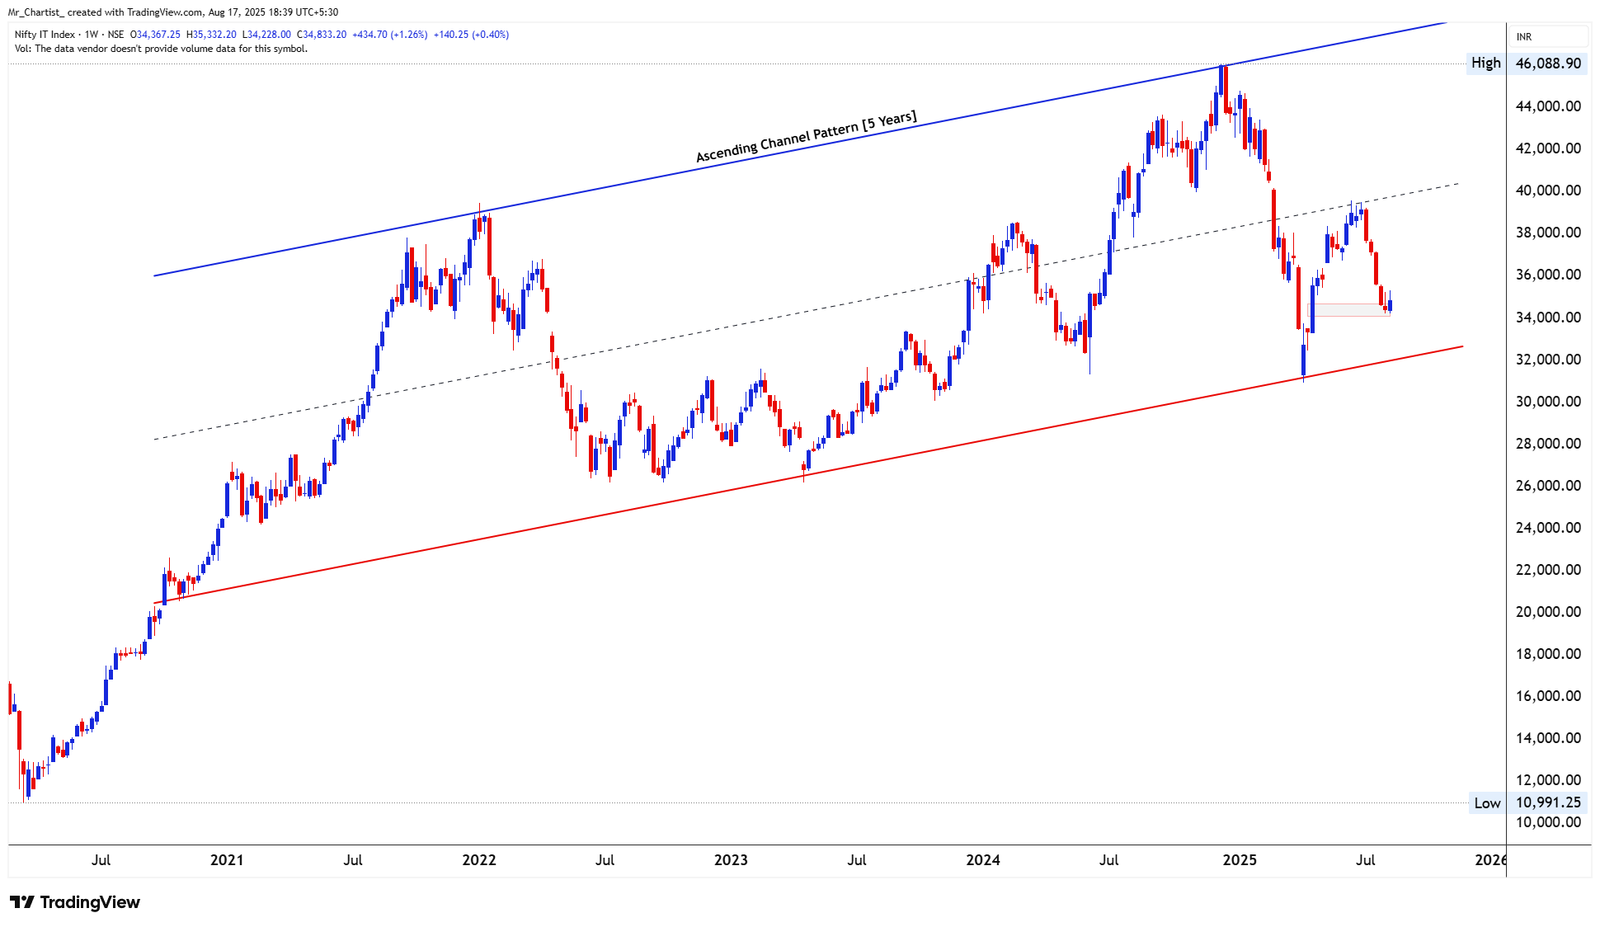
NIFTY IT
charts to-watchAscending Channel
5 Years (Weekly Chart – Long-Term Trend)
Thesis & Analysis
Nifty IT continues to trade inside a long-term ascending channel that has defined its structure for the last five years. Recently, the index retraced from the upper boundary near 40,000 and moved lower toward the mid-channel zone. The latest decline found support at a diagonal trendline, with the 32,000 level emerging as a crucial long-term support base. This zone represents a strong confluence support area. Holding above it could stabilize the index and set the stage for a rebound toward 38,000–40,000. However, a sustained break below 32,000 would indicate structural weakness and raise the risk of a deeper correction within the channel. Candlestick Behavior: Recent weekly candles show stabilization near support after strong selling. Lack of a decisive bullish reversal yet, but the downside momentum appears to be slowing. Volume Analysis: Volume data unavailable; price structure and levels remain the key guideposts. 2. Crucial Support and Resistance Levels Support Zones: 32,000 – Major long-term diagonal + horizontal support; must hold. 30,500 – Secondary cushion if 32,000 breaks. 28,000 – Deeper channel support, long-term demand zone. Resistance Zones: 36,500–37,000 – Near-term resistance from recent pullback highs. 38,000 – Mid-channel supply zone. 40,000–40,500 – Upper channel boundary; key breakout threshold. 3. Strategic Trade Scenarios 🔸 Primary Setup – Long-Term Rebound from Support If Nifty IT sustains above 32,000, it could attract long-term buying interest, paving the way for a move toward 36,500, and further to 38,000–40,000. Sustaining above 40,000 would mark a strong continuation of the larger bullish trend. 🔹 Alternate Setup – Breakdown Below 32,000 A decisive weekly close below 32,000 would indicate channel weakness, exposing downside levels toward 30,500 and potentially 28,000, signaling deeper correction risks.
Price Action
- ■Price action is structurally positive.
- ■Forming higher highs and higher lows.
Volume Profile
- ■Volume is supportive of the price action.
- ■Wait for volume expansion on breakout.
Key Levels
No zones specified
No zones specified
Invalidation Scenario
A weekly close below the support level invalidates this structure.
Nifty FMCG
charts to-watchDouble Bottom Breakout
Daily Chart
Thesis & Analysis
No detailed thesis provided for this setup.
Price Action
- ■Price action is structurally positive.
- ■Forming higher highs and higher lows.
Volume Profile
- ■Volume is supportive of the price action.
- ■Wait for volume expansion on breakout.
Key Levels
No zones specified
No zones specified
Invalidation Scenario
A weekly close below the support level invalidates this structure.
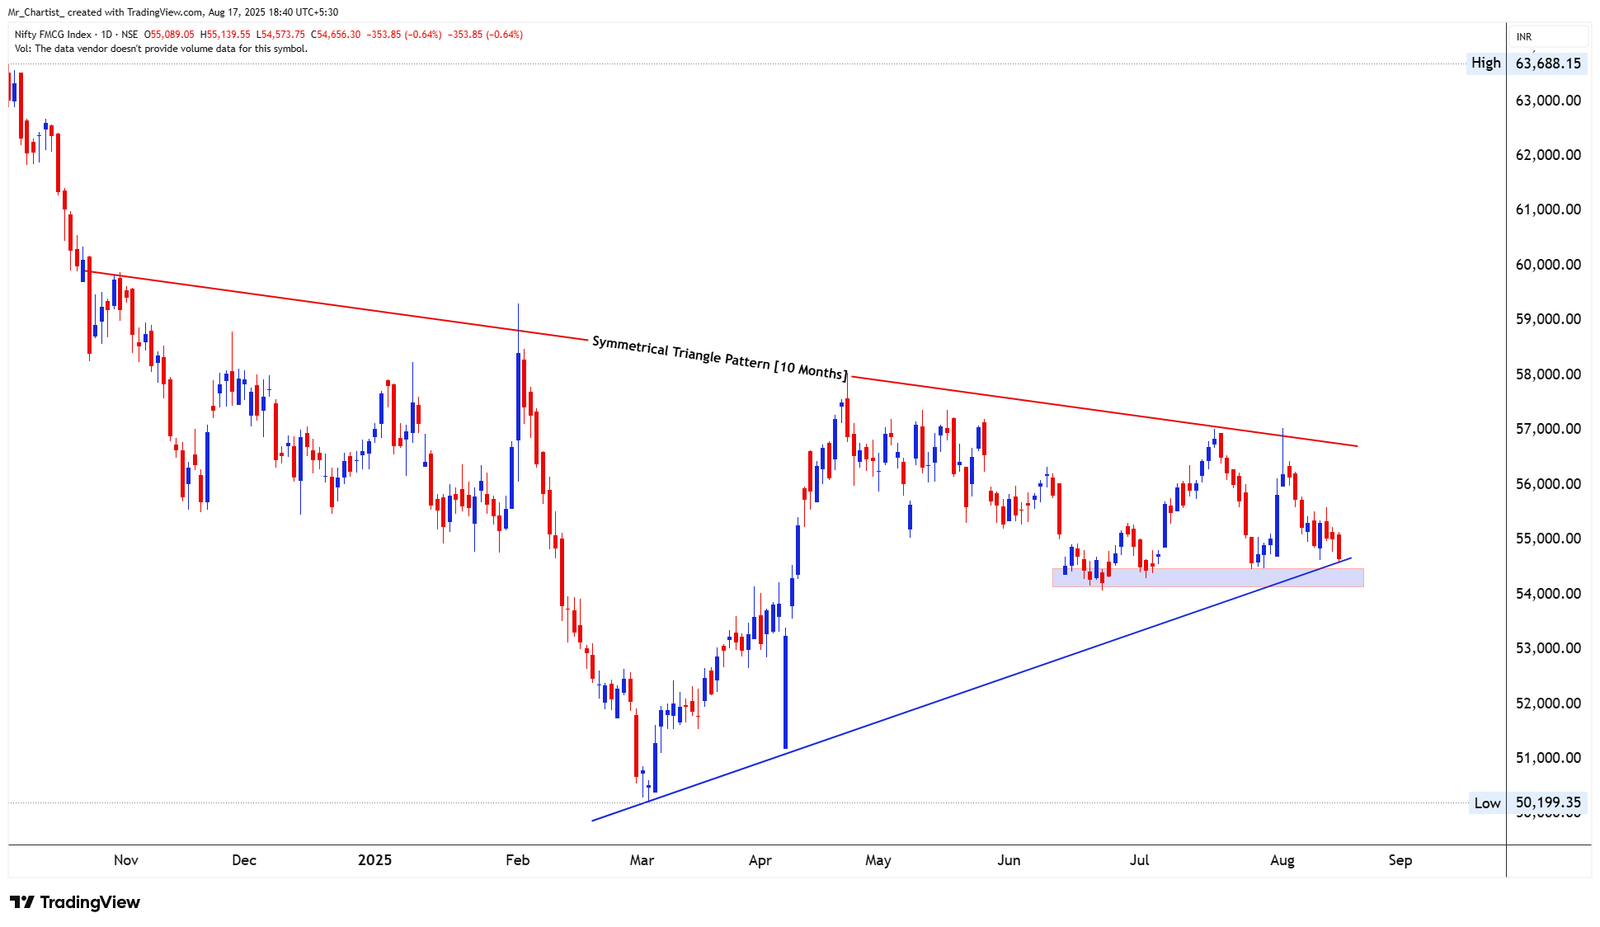
NIFTY FMCG
charts to-watchSymmetrical Triangle
10 Months (Daily Chart – Ongoing Consolidation)
Thesis & Analysis
Nifty FMCG has been consolidating inside a symmetrical triangle for the past 10 months, showing prolonged indecision. The index is now positioned near the 54,000 level, which combines both horizontal support and the rising trendline base of the pattern. This makes the zone a critical inflection point. Holding above 54,000 keeps the range-bound structure intact, with potential sideways action between 54,000 and 57,000. However, a decisive breakdown below this support would put pressure on the long-term structure and open room for deeper losses. Candlestick Behavior: Recent candles are small-bodied with wicks, reflecting hesitation near support. No confirmed reversal signal yet; a strong bullish close is required for confirmation. Volume Analysis: Volume data is not available; reliance is on price action and breakout signals. A wide-bodied candle with follow-through will provide clarity. 2. Crucial Support and Resistance Levels Support Zones: 54,000 – Strong confluence of horizontal + diagonal support. 52,000 – Next support if 54K fails. 50,000 – Major long-term base. Resistance Zones: 56,500–57,000 – Upper triangle resistance and breakout zone. 59,000–60,000 – Next upside cluster if breakout sustains. 62,000+ – Extended bullish target if strong momentum builds. 3. Strategic Trade Scenarios 🔸 Primary Setup – Sideways Consolidation If Nifty FMCG holds above 54,000, the index could continue its consolidation phase inside the triangle. Price action may oscillate toward 56,500–57,000, where the next breakout test lies. 🔹 Alternate Setup – Breakout or Breakdown Above 57,000: A sustained breakout may open upside toward 59,000–62,000. Below 54,000: Breakdown could expose the index to 52,000 first, then 50,000, signaling weakness.
Price Action
- ■Price action is structurally positive.
- ■Forming higher highs and higher lows.
Volume Profile
- ■Volume is supportive of the price action.
- ■Wait for volume expansion on breakout.
Key Levels
No zones specified
No zones specified
Invalidation Scenario
A weekly close below the support level invalidates this structure.
Nifty Energy
charts to-watchDouble Bottom Breakout
Daily Chart
Thesis & Analysis
No detailed thesis provided for this setup.
Price Action
- ■Price action is structurally positive.
- ■Forming higher highs and higher lows.
Volume Profile
- ■Volume is supportive of the price action.
- ■Wait for volume expansion on breakout.
Key Levels
No zones specified
No zones specified
Invalidation Scenario
A weekly close below the support level invalidates this structure.
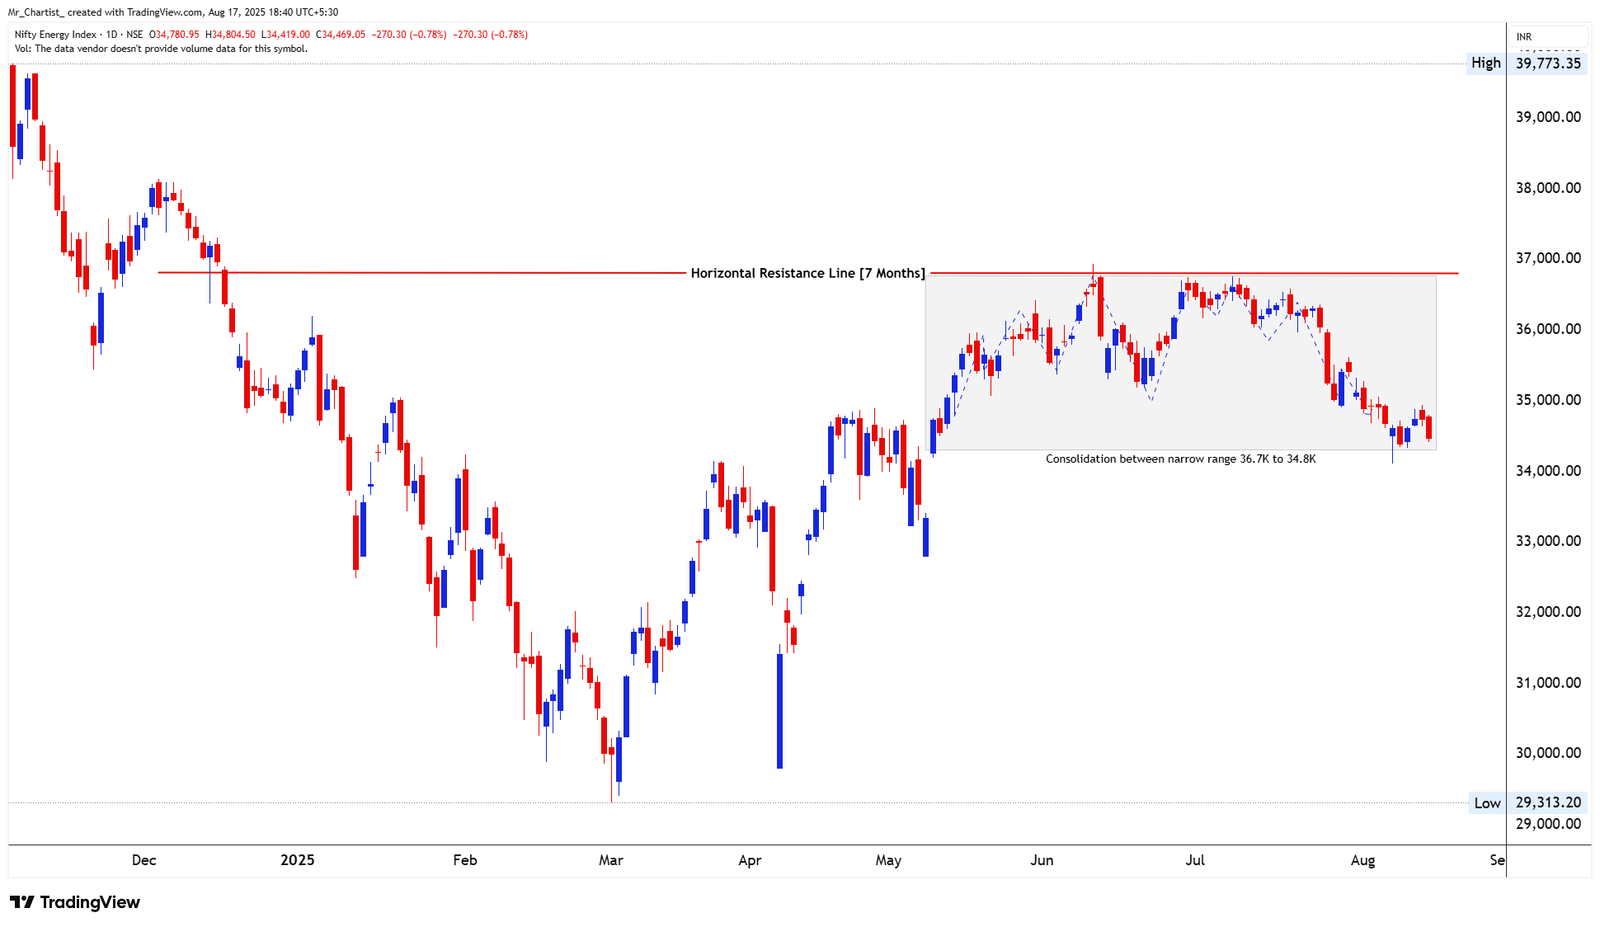
NIFTY ENERGY
charts to-watchRectangle Consolidation
7 Months (Daily Chart – Range-Bound Structure)
Thesis & Analysis
Nifty Energy has been consolidating in a rectangle range for the last seven months, oscillating between 34,000 on the downside and 37,000 on the upside. This prolonged sideways action highlights strong indecision, as both buyers and sellers continue to defend their respective zones. Currently, the index is testing the lower boundary near 34,000–34,500, where price recently formed a hammer-like candlestick, suggesting early signs of demand at this critical support. As long as the 34,000 level holds, the structure favors continuation of consolidation with potential rebounds. However, a decisive breakdown below 34,000 could trigger fresh downside momentum. Candlestick Behavior: Recent candles near 34K show wicks at the bottom, hinting at buying support. The hammer-like pattern strengthens the case for a possible reversal attempt, but confirmation is still required. Volume Analysis: No volume data available; focus remains on candlestick confirmation. Sustained wide-bodied bullish candles would be a key trigger for upside reversal. 2. Crucial Support and Resistance Levels Support Zones: 34,000 – Major horizontal support; must hold to avoid breakdown. 33,000 – Secondary support if 34K fails. 31,500 – Extended downside target on a deep correction. Resistance Zones: 35,500 – First short-term resistance if bounce occurs. 37,000 – Upper range ceiling; strong breakout level. 38,500 – Extended upside if 37K breakout sustains. 3. Strategic Trade Scenarios 🔸 Primary Setup – Range-Bound Rebound If Nifty Energy holds above 34,000 and confirms reversal with bullish candles, the index may attempt a recovery toward 35,500–37,000. Sustaining above 37K would unlock further upside toward 38,500. 🔹 Alternate Setup – Breakdown Below 34,000 A decisive close below 34,000 would mark a breakdown of the 7-month rectangle, exposing downside toward 33,000 first, and then 31,500 in the medium term.
Price Action
- ■Price action is structurally positive.
- ■Forming higher highs and higher lows.
Volume Profile
- ■Volume is supportive of the price action.
- ■Wait for volume expansion on breakout.
Key Levels
No zones specified
No zones specified
Invalidation Scenario
A weekly close below the support level invalidates this structure.
Nifty Auto
charts to-watchDouble Bottom Breakout
Daily Chart
Thesis & Analysis
No detailed thesis provided for this setup.
Price Action
- ■Price action is structurally positive.
- ■Forming higher highs and higher lows.
Volume Profile
- ■Volume is supportive of the price action.
- ■Wait for volume expansion on breakout.
Key Levels
No zones specified
No zones specified
Invalidation Scenario
A weekly close below the support level invalidates this structure.
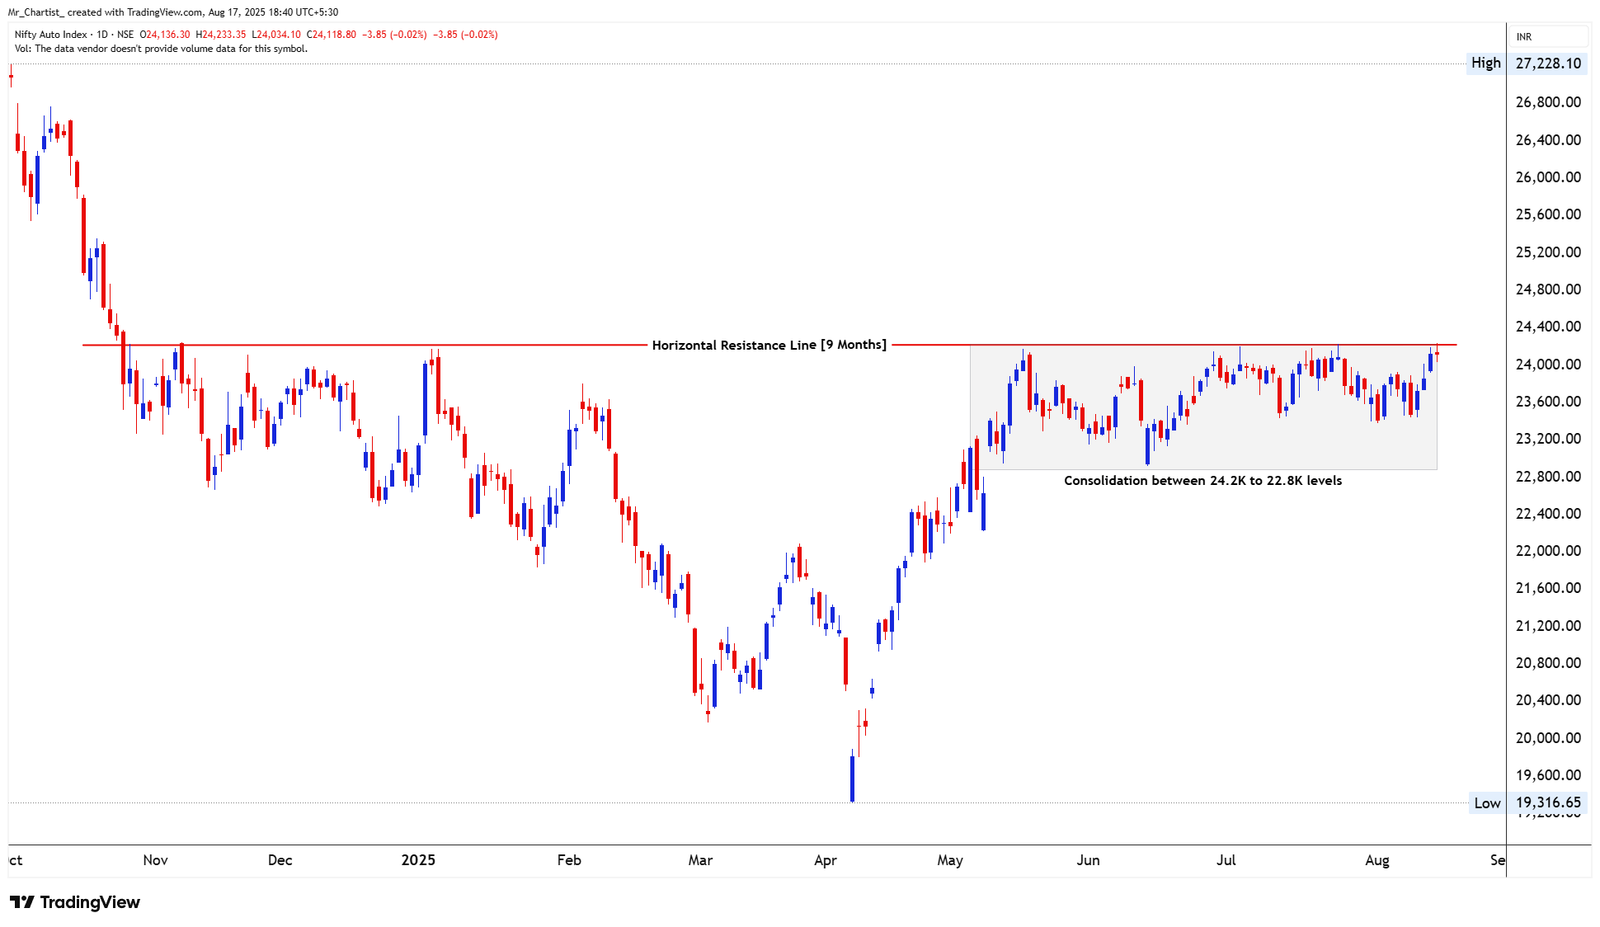
NIFTY AUTO
charts to-watchRectangle Consolidation
9 Months (Daily Chart – Sideways Phase)
Thesis & Analysis
Nifty Auto is one of the stronger indices in the current market setup, holding firmly within a well-defined consolidation zone between 22,800 and 24,200 for the last nine months. This base-building phase highlights stability in the sector while other indices show more volatility. At present, price action is testing the upper boundary near 24,200–24,400, a zone that has acted as strong resistance on multiple occasions. A decisive breakout and sustained move above 24,400 would mark the start of a fresh upward leg, opening room for new highs. However, as long as the index stays capped below this barrier, consolidation may continue in the established range. Candlestick Behavior: Recent candles near 24,200 show hesitation and rejection wicks, highlighting resistance pressure. Momentum is building, but no clear breakout confirmation yet. Volume Analysis: No volume data available; hence focus remains on daily close levels. A wide-bodied bullish candle above 24,400 would confirm breakout strength. 2. Crucial Support and Resistance Levels Support Zones: 23,000–22,800 – Lower consolidation floor; strong demand zone. 22,200 – Backup support if the range fails. 21,500 – Extended cushion on deeper pullback. Resistance Zones: 24,200–24,400 – Major supply zone; breakout trigger. 25,000 – Psychological resistance post-breakout. 25,800–26,000 – Next strong upside target zone. 3. Strategic Trade Scenarios 🔸 Primary Setup – Breakout Above 24,400 If Nifty Auto closes and sustains above 24,400, the index is likely to witness a range breakout, opening the path toward 25,000–25,800 in the short to medium term. This would reinforce its leadership stance among sectoral indices. 🔹 Alternate Setup – Continued Consolidation If resistance holds and price fails to close above 24,400, the index may continue sideways between 22,800 and 24,200, extending the consolidation phase. Only a breakdown below 22,800 would weaken the structure and invite deeper corrections.
Price Action
- ■Price action is structurally positive.
- ■Forming higher highs and higher lows.
Volume Profile
- ■Volume is supportive of the price action.
- ■Wait for volume expansion on breakout.
Key Levels
No zones specified
No zones specified
Invalidation Scenario
A weekly close below the support level invalidates this structure.
Nifty Bank
charts to-watchDouble Bottom Breakout
Daily Chart
Thesis & Analysis
No detailed thesis provided for this setup.
Price Action
- ■Price action is structurally positive.
- ■Forming higher highs and higher lows.
Volume Profile
- ■Volume is supportive of the price action.
- ■Wait for volume expansion on breakout.
Key Levels
No zones specified
No zones specified
Invalidation Scenario
A weekly close below the support level invalidates this structure.
Chart Image Not Extracted
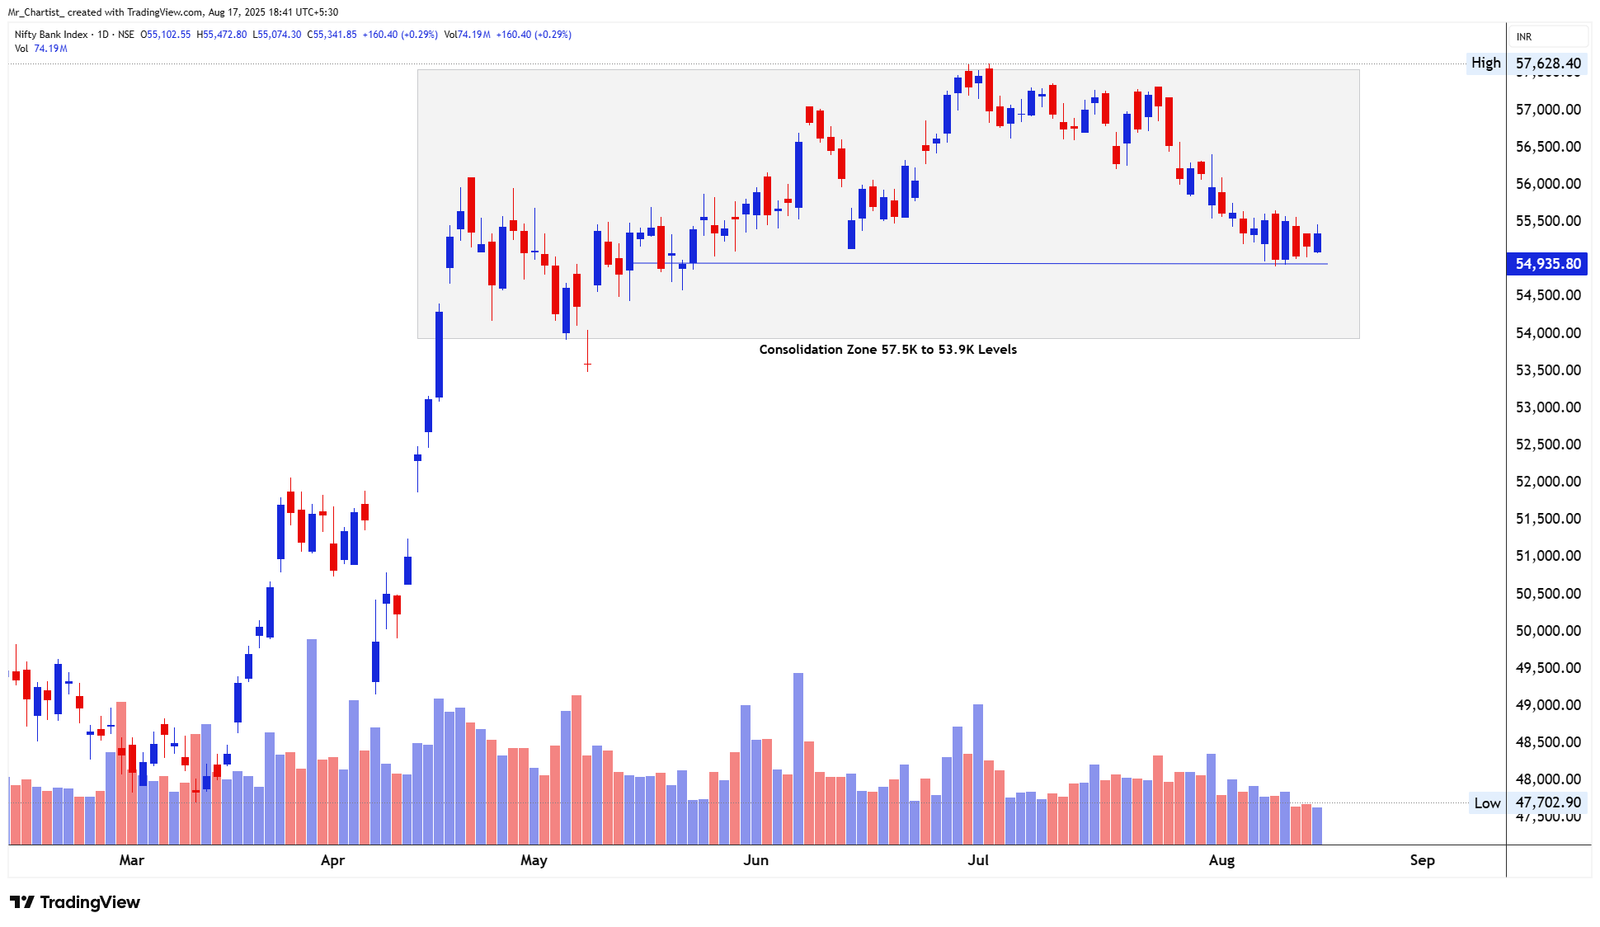
NIFTY BANK
charts to-watchRectangle Consolidation
4 Months (Daily Chart – Sideways Phase)
Thesis & Analysis
Nifty Bank has been trading inside a rectangle consolidation zone between 57,500 and 53,900 over the last few months. Recently, the index tested the support band near 54,500–55,000, showing signs of stability, but momentum remains muted. A sustained close above 55,600 would strengthen the case for a rebound toward 57,000–57,700, with a breakout above 57,700 signaling a fresh bullish leg. Conversely, a decisive break below 54,500 would shift sentiment bearish, exposing the 53,800 support zone and potentially inviting a sharper decline. Candlestick Behavior: Recent candles near 54,500 show rejection wicks and short bodies, reflecting indecision. Absence of strong bullish patterns suggests buyers are cautious at support. Volume Analysis: Volumes have been moderate during the consolidation phase. Watch for a volume surge with breakout/breakdown confirmation. 2. Crucial Support and Resistance Levels Support Zones: 54,500–54,000 – Key support band; must hold for stability. 53,800 – Critical breakdown level; below this, downside accelerates. 52,500 – Next support on extended weakness. Resistance Zones: 55,600 – Immediate hurdle; close above may trigger reversal. 57,000–57,700 – Upper boundary of consolidation; breakout trigger. 59,000 – Higher resistance post-breakout. 3. Strategic Trade Scenarios 🔸 Primary Setup – Reversal from Support If Nifty Bank sustains above 55,600, momentum could revive, leading to a rally toward 57,000–57,700. A strong close above 57,700 would mark a bullish breakout, potentially extending gains toward 59,000. 🔹 Alternate Setup – Breakdown Below 54,500 If price slips below 54,500 and sustains, weakness may extend to 53,800. A close below 53,800 would confirm breakdown, opening downside toward 52,500 and increasing the risk of a deeper correction.
Price Action
- ■Price action is structurally positive.
- ■Forming higher highs and higher lows.
Volume Profile
- ■Volume is supportive of the price action.
- ■Wait for volume expansion on breakout.
Key Levels
No zones specified
No zones specified
Invalidation Scenario
A weekly close below the support level invalidates this structure.
SEBI Registered Research Analyst — INH000015297 (INVESTOLOGY). Investment in securities market are subject to market risks. Read all related documents carefully before investing. The content provided is for educational purposes only and should not be considered as financial advice. Past performance is not indicative of future results.