Coming Soon
The Weekend Visual ChartBook is currently undergoing a massive upgrade. Stay tuned for a world-class reading experience.
Return HomeWeekend Visual ChartBook
Edition #276
Extracted Edition
Market Pulse
LiveReal-time index prices above. Detailed index chart analysis below in the Indices section.
Bullish Charts [F&O]
Breakout and momentum setups from the F&O universe
UPL Ltd
bullish fnoDouble Bottom Breakout
Daily Chart
Thesis & Analysis
No detailed thesis provided for this setup.
Price Action
- ■Price action is structurally positive.
- ■Forming higher highs and higher lows.
Volume Profile
- ■Volume is supportive of the price action.
- ■Wait for volume expansion on breakout.
Key Levels
No zones specified
No zones specified
Invalidation Scenario
A weekly close below the support level invalidates this structure.
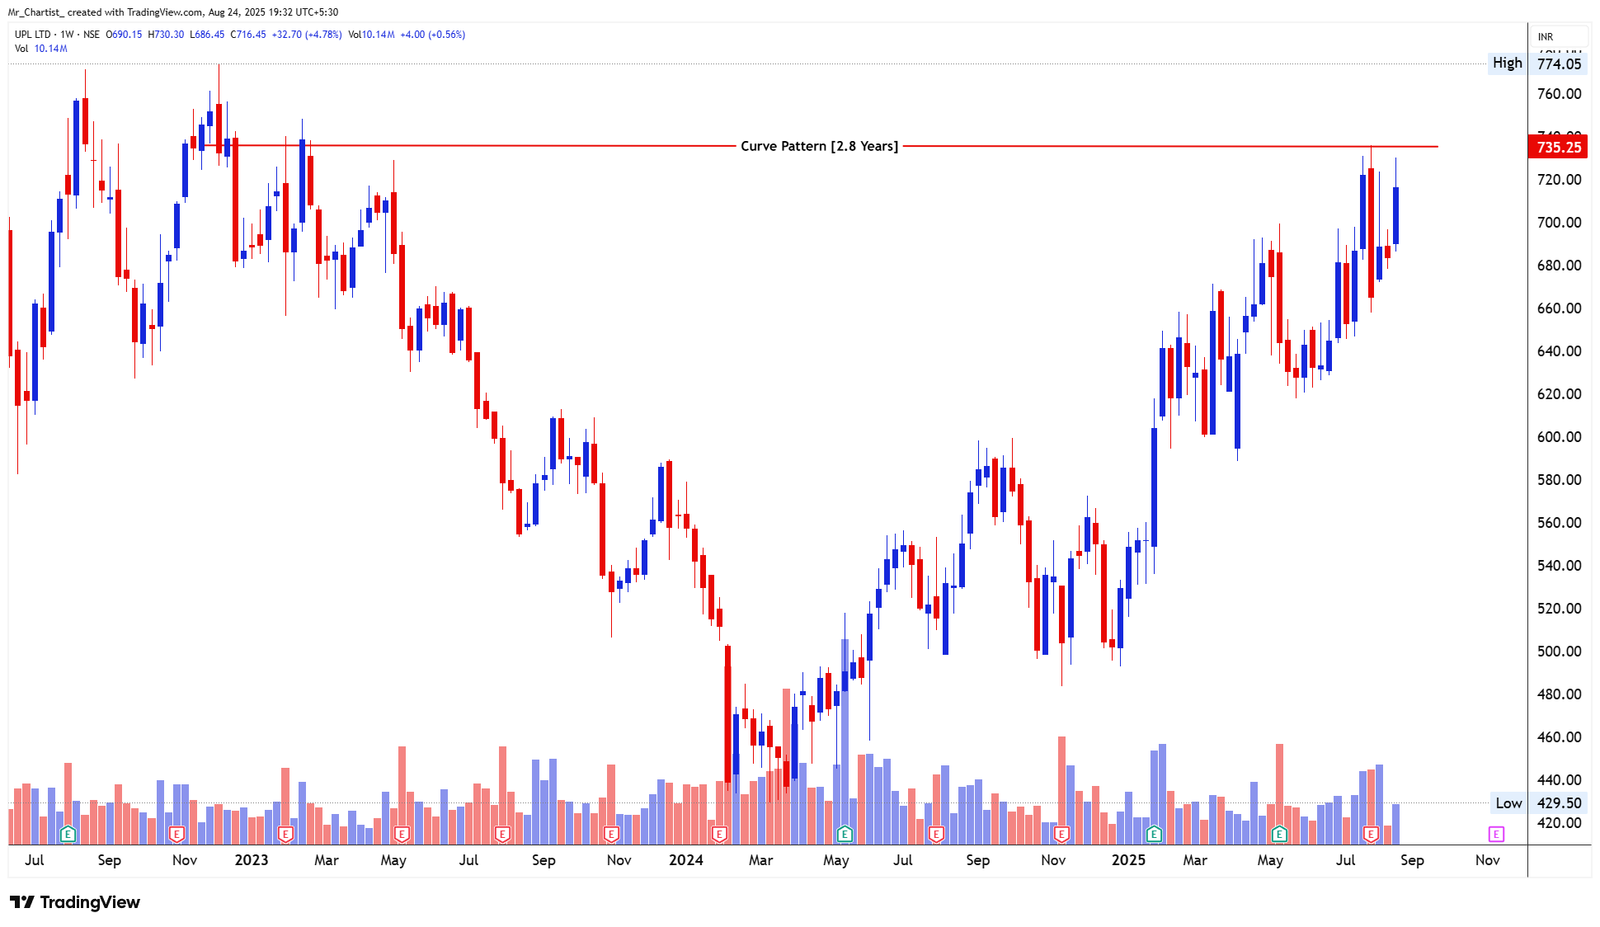
UPL LTD
bullish fnoCurve Formation (Rounded Base)
2.8 Years (Weekly Chart – Long-Term Reversal Structure)
Thesis & Analysis
UPL Ltd is nearing the completion of a long-term rounded bottom formation spanning approximately 2.8 years. Price has been rising in a controlled arc structure, gradually climbing back to the key horizontal resistance zone near ₹735, which has historically acted as a supply zone. This curved pattern reflects a slow accumulation and sentiment shift, typically seen before major bullish transitions. Price is currently just under the neckline, building upward pressure. Weekly candles show strong momentum, with buyers consistently defending higher lows. A sustained breakout above ₹735 would confirm the reversal and open the path for multi- month upside. Candlestick Behavior: Strong bullish candles dominate recent weeks, with healthy body size. No major upper wicks, suggesting minimal selling pressure near highs. ₹700–₹735 zone showing tight clustering—sign of buildup before breakout. Volume Analysis: Gradual increase in volume over past 3 months. Volume spikes coincide with bullish weeks, supporting the accumulation thesis. Breakout above ₹735 should ideally occur with a volume surge above 12–15M. 2. Crucial Support and Resistance Levels Support Zones: ₹680–₹700 – Short-term support; base of last weekly range. ₹645 – Mid-pivot within the curve; demand zone during prior dips. ₹600 – Structural support of the rounded base. Resistance Zones: ₹735 – Neckline of rounded base; breakout trigger. ₹774 – Weekly swing high post-neckline. ₹810–₹850 – Target zone based on breakout projection. 3. Strategic Trade Scenarios 🔸 Primary Setup – Breakout Above ₹735 A close above ₹735 with rising volume confirms the curve breakout, potentially setting up for a rally toward ₹774, and extended targets around ₹810–₹850. 🔹 Alternate Setup – Resistance Holds, Consolidation Continues If price faces resistance at ₹735 and dips, it may retest support at ₹700–₹680, continuing to consolidate below breakout level before the next move. ⚠️ Major Breakdown Risk: Only a weekly close below ₹645 would damage the bullish structure and risk deeper pullback toward the ₹600 zone.
Price Action
- ■Price action is structurally positive.
- ■Forming higher highs and higher lows.
Volume Profile
- ■Volume is supportive of the price action.
- ■Wait for volume expansion on breakout.
Key Levels
No zones specified
No zones specified
Invalidation Scenario
A weekly close below the support level invalidates this structure.
Dixon Tech
bullish fnoDouble Bottom Breakout
Daily Chart
Thesis & Analysis
No detailed thesis provided for this setup.
Price Action
- ■Price action is structurally positive.
- ■Forming higher highs and higher lows.
Volume Profile
- ■Volume is supportive of the price action.
- ■Wait for volume expansion on breakout.
Key Levels
No zones specified
No zones specified
Invalidation Scenario
A weekly close below the support level invalidates this structure.
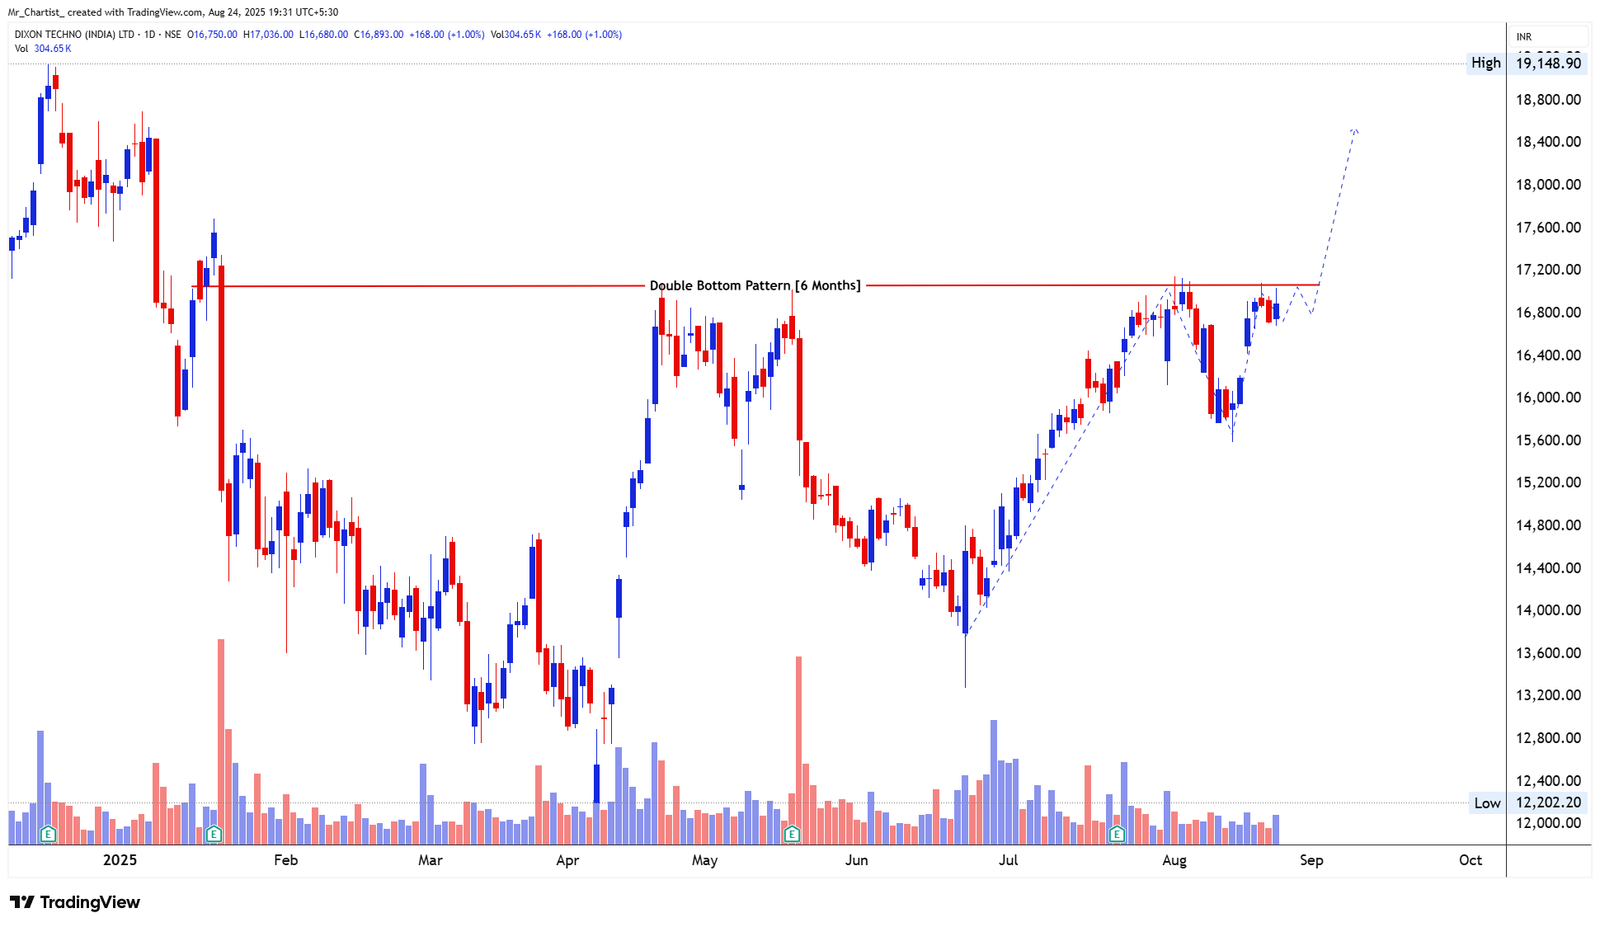
DIXON TECH
bullish fnoDouble Bottom Formation
6 Months (Daily Chart – Reversal Base in Progress)
Thesis & Analysis
Dixon Technologies is currently testing the neckline of a 6-month double bottom pattern, with resistance established near ₹17,200. The two lows formed in May and July created a clear base around ₹14,400–14,600, from which price has rallied steadily. The stock has since formed higher lows, showing renewed strength and accumulation as it approaches breakout territory. The current price action indicates tight range candles near neckline resistance, signaling that buyers are absorbing supply. A breakout above ₹17,200 would confirm the pattern and open a fresh upside swing. Candlestick Behavior: Bullish momentum candles have been leading up to the neckline. Current candles show slight hesitation but no bearish reversal signs. Consolidation just below resistance is constructive for breakout setups. Volume Analysis: Volume has risen during rally legs, supporting the bullish structure. Volume dropped during pullbacks, a healthy sign of weak selling pressure. A breakout should ideally occur with a spike above 400–450K volume. 2. Crucial Support and Resistance Levels Support Zones: ₹16,400–16,600 – Minor support from recent pullbacks. ₹15,800 – Higher low region; medium-term support. ₹14,400 – Double bottom base. Resistance Zones: ₹17,200 – Neckline resistance and breakout trigger. ₹18,000 – Short-term post-breakout target. ₹18,600–19,000 – Measured move projection. 3. Strategic Trade Scenarios 🔸 Primary Setup – Breakout Above ₹17,200 A decisive close above ₹17,200 with strong volume would confirm the double bottom breakout, setting the stage for upside toward ₹18,600–₹19,000. 🔹 Alternate Setup – Pullback Within Structure If price fails to break ₹17,200 on first attempt, a mild dip to ₹16,400–₹16,600 zone could provide another base before retrying breakout. ⚠️ Major Breakdown Risk: Only a close below ₹15,800 would weaken the structure and threaten the bullish reversal, opening downside risk back to ₹14,400.
Price Action
- ■Price action is structurally positive.
- ■Forming higher highs and higher lows.
Volume Profile
- ■Volume is supportive of the price action.
- ■Wait for volume expansion on breakout.
Key Levels
No zones specified
No zones specified
Invalidation Scenario
A weekly close below the support level invalidates this structure.
CESC Ltd
bullish fnoDouble Bottom Breakout
Daily Chart
Thesis & Analysis
No detailed thesis provided for this setup.
Price Action
- ■Price action is structurally positive.
- ■Forming higher highs and higher lows.
Volume Profile
- ■Volume is supportive of the price action.
- ■Wait for volume expansion on breakout.
Key Levels
No zones specified
No zones specified
Invalidation Scenario
A weekly close below the support level invalidates this structure.
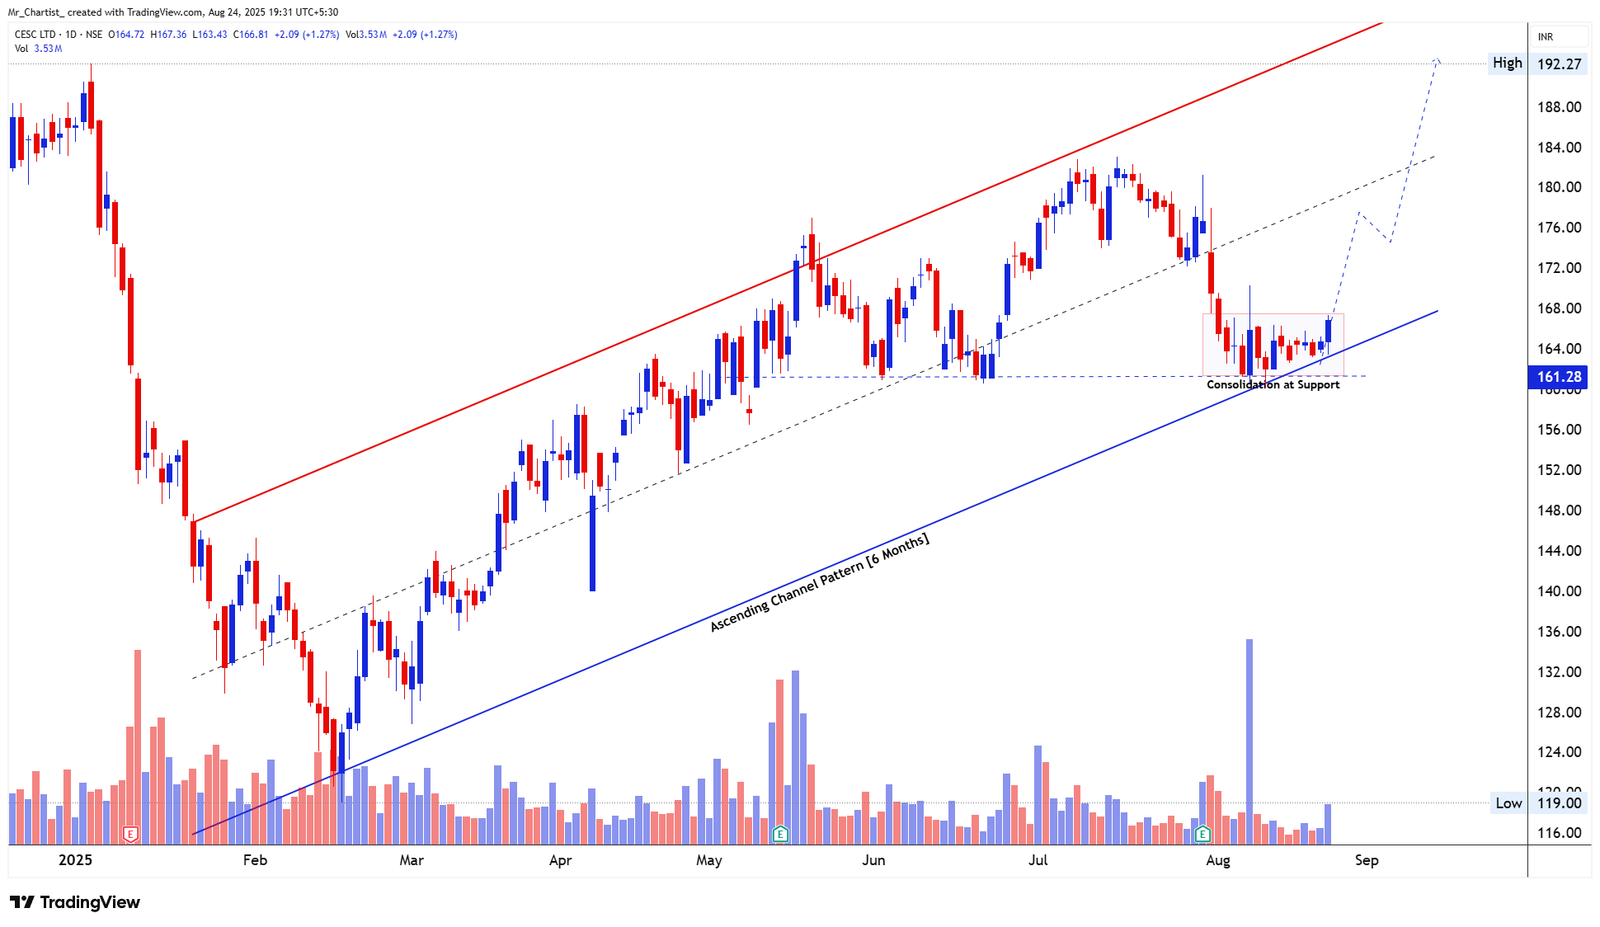
CESC LTD
bullish fnoAscending Channel with Base Consolidation
6 Months (Daily Chart – Trend Continuation Setup)
Thesis & Analysis
CESC Ltd is currently respecting a 6-month ascending channel, with the price pulling back toward the lower boundary of the channel and now consolidating around the ₹161–₹165 support zone. This zone has previously acted as a pivot and now aligns with the channel’s lower trendline, creating a confluence of support. A tight sideways box has formed just above support, hinting at absorption of selling pressure and potential for a bounce if follow-through buying emerges. The overall trend remains intact, and a breakout from this base could resume the broader bullish trajectory. Candlestick Behavior: Recent candles show small bodies and low wicks, consistent with sideways digestion. Price has respected the channel lows despite the recent pullback. No strong bullish reversal yet, but the structure favors continuation. Volume Analysis: Volume has been moderate during consolidation, typical of base-building phases. Prior upswings within the channel were supported by higher volume spikes. Volume surge on breakout from the current box would strengthen bullish case. 2. Crucial Support and Resistance Levels Support Zones: ₹161–₹163 – Immediate support; also lower channel line. ₹156 – Previous swing low; next key support if breakdown occurs. ₹148 – Structural support from April pivot low. Resistance Zones: ₹172–₹174 – Mid-channel zone; first breakout checkpoint. ₹180–₹184 – Short-term resistance zone. ₹192 – Channel top; projected target on trend continuation. 3. Strategic Trade Scenarios 🔸 Primary Setup – Bounce from Channel Support If price holds above ₹161 and breaks out of the short-term consolidation, upside toward ₹174–₹180 becomes likely, with potential extension to ₹192 in continuation of the channel. 🔹 Alternate Setup – Sideways Extension Before Breakout If price continues consolidating in the ₹161–₹167 box, the pattern remains intact. Breakout confirmation would require bullish candle and above-average volume. ⚠️ Major Breakdown Risk: A close below ₹156 would breach the channel and increase probability of a deeper correction toward ₹148 or lower.
Price Action
- ■Price action is structurally positive.
- ■Forming higher highs and higher lows.
Volume Profile
- ■Volume is supportive of the price action.
- ■Wait for volume expansion on breakout.
Key Levels
No zones specified
No zones specified
Invalidation Scenario
A weekly close below the support level invalidates this structure.
Supreme Industries Ltd
bullish fnoDouble Bottom Breakout
Daily Chart
Thesis & Analysis
No detailed thesis provided for this setup.
Price Action
- ■Price action is structurally positive.
- ■Forming higher highs and higher lows.
Volume Profile
- ■Volume is supportive of the price action.
- ■Wait for volume expansion on breakout.
Key Levels
No zones specified
No zones specified
Invalidation Scenario
A weekly close below the support level invalidates this structure.
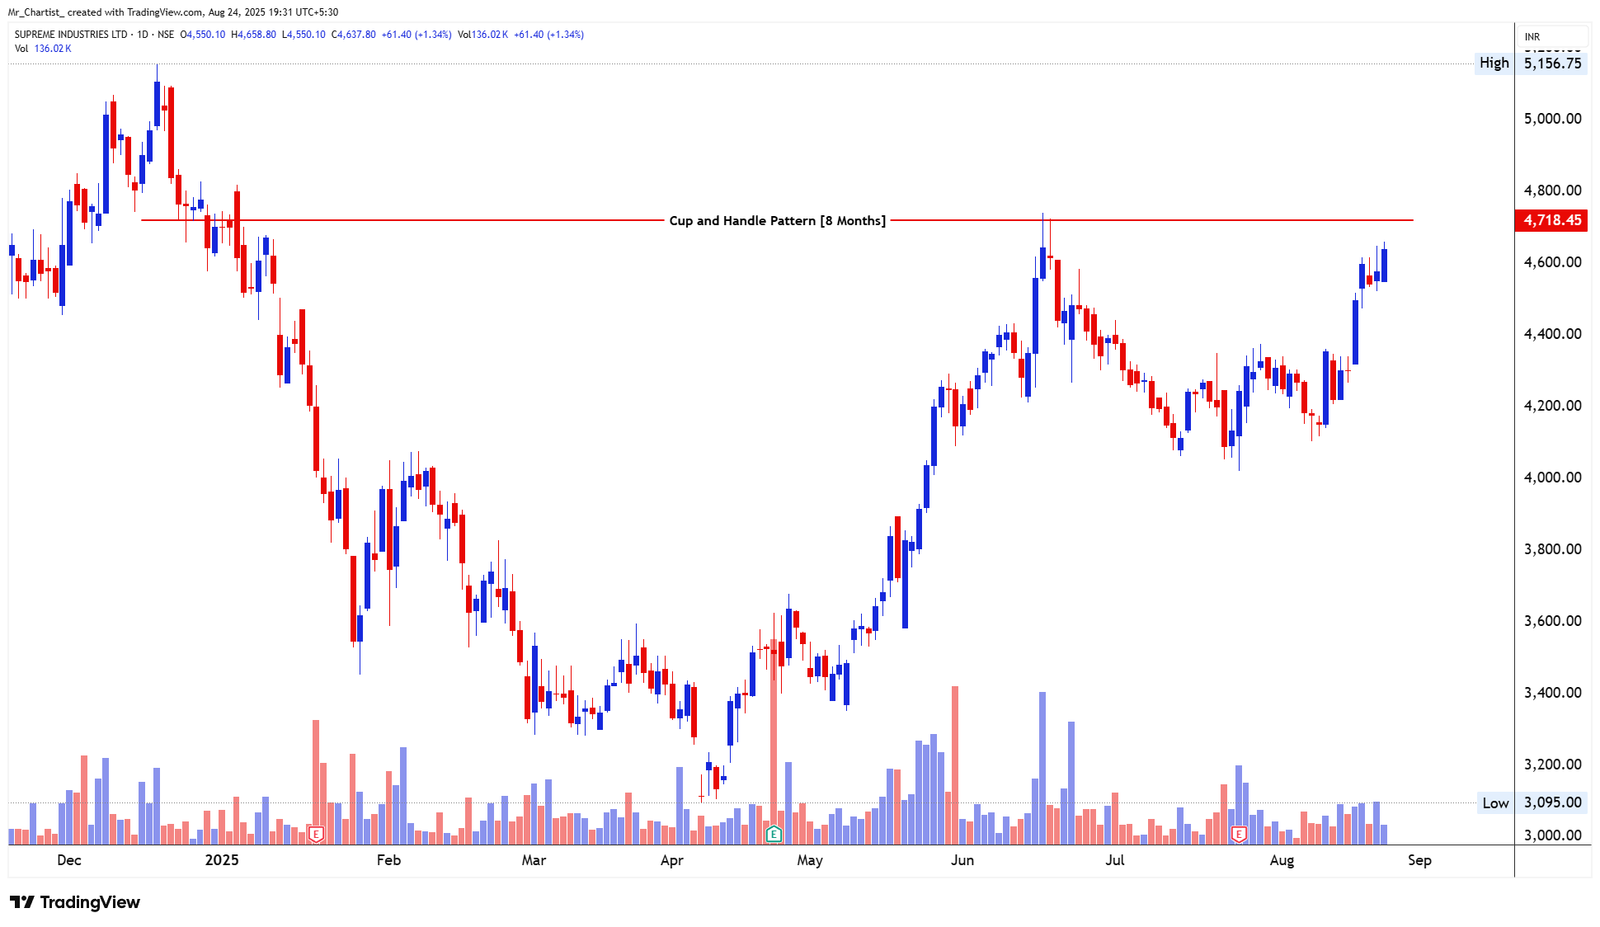
SUPREME INDUSTRIES LTD
bullish fnoCup and Handle Formation
8 Months (Daily Chart – Bullish Continuation Setup)
Thesis & Analysis
Supreme Industries is currently nearing a major breakout point after forming a well- defined Cup and Handle pattern over the past 8 months. The rounded base from March to June formed the cup, and the recent mild pullback in July created a shallow handle structure. The neckline at ₹4,718 represents the breakout level, which was tested recently and is now being approached again with stronger momentum. The structure reflects a bullish continuation bias, and a breakout above ₹4,718 could signal renewed strength with scope for trend extension. Candlestick Behavior: Strong bullish candles in recent sessions, approaching resistance cleanly. Lack of upper wicks indicates solid demand and minimal supply near highs. No exhaustion signs yet; breakout build-up evident. Volume Analysis: Volume expanding as price approaches the neckline — a healthy signal. Handle formed on lower volume, consistent with classic cup and handle formation. Breakout volume above 150–160K would validate the pattern. 2. Crucial Support and Resistance Levels Support Zones: ₹4,500–₹4,550 – Recent consolidation zone; near-term support. ₹4,300 – Handle base; structure-validating level. ₹4,100 – Breakdown trigger; invalidates bullish pattern. Resistance Zones: ₹4,718 – Neckline and breakout point. ₹4,900–₹5,000 – Immediate post-breakout hurdles. ₹5,150+ – Prior swing high and measured target zone. 3. Strategic Trade Scenarios 🔸 Primary Setup – Breakout Above ₹4,718 A strong close above ₹4,718 with volume expansion would confirm the cup and handle breakout, potentially targeting ₹4,900–₹5,150 in the near term. 🔹 Alternate Setup – Retest Before Breakout If price pulls back toward ₹4,500–₹4,550 before attempting breakout, the structure remains valid. Such a retest would offer a base for a more sustainable breakout. ⚠️ Major Breakdown Risk: Only a sustained break below ₹4,300 would weaken the bullish pattern and signal possible reversal toward ₹4,100 or lower.
Price Action
- ■Price action is structurally positive.
- ■Forming higher highs and higher lows.
Volume Profile
- ■Volume is supportive of the price action.
- ■Wait for volume expansion on breakout.
Key Levels
No zones specified
No zones specified
Invalidation Scenario
A weekly close below the support level invalidates this structure.
Poonawalla Fincorp Ltd
bullish fnoDouble Bottom Breakout
Daily Chart
Thesis & Analysis
No detailed thesis provided for this setup.
Price Action
- ■Price action is structurally positive.
- ■Forming higher highs and higher lows.
Volume Profile
- ■Volume is supportive of the price action.
- ■Wait for volume expansion on breakout.
Key Levels
No zones specified
No zones specified
Invalidation Scenario
A weekly close below the support level invalidates this structure.
Chart Image Not Extracted
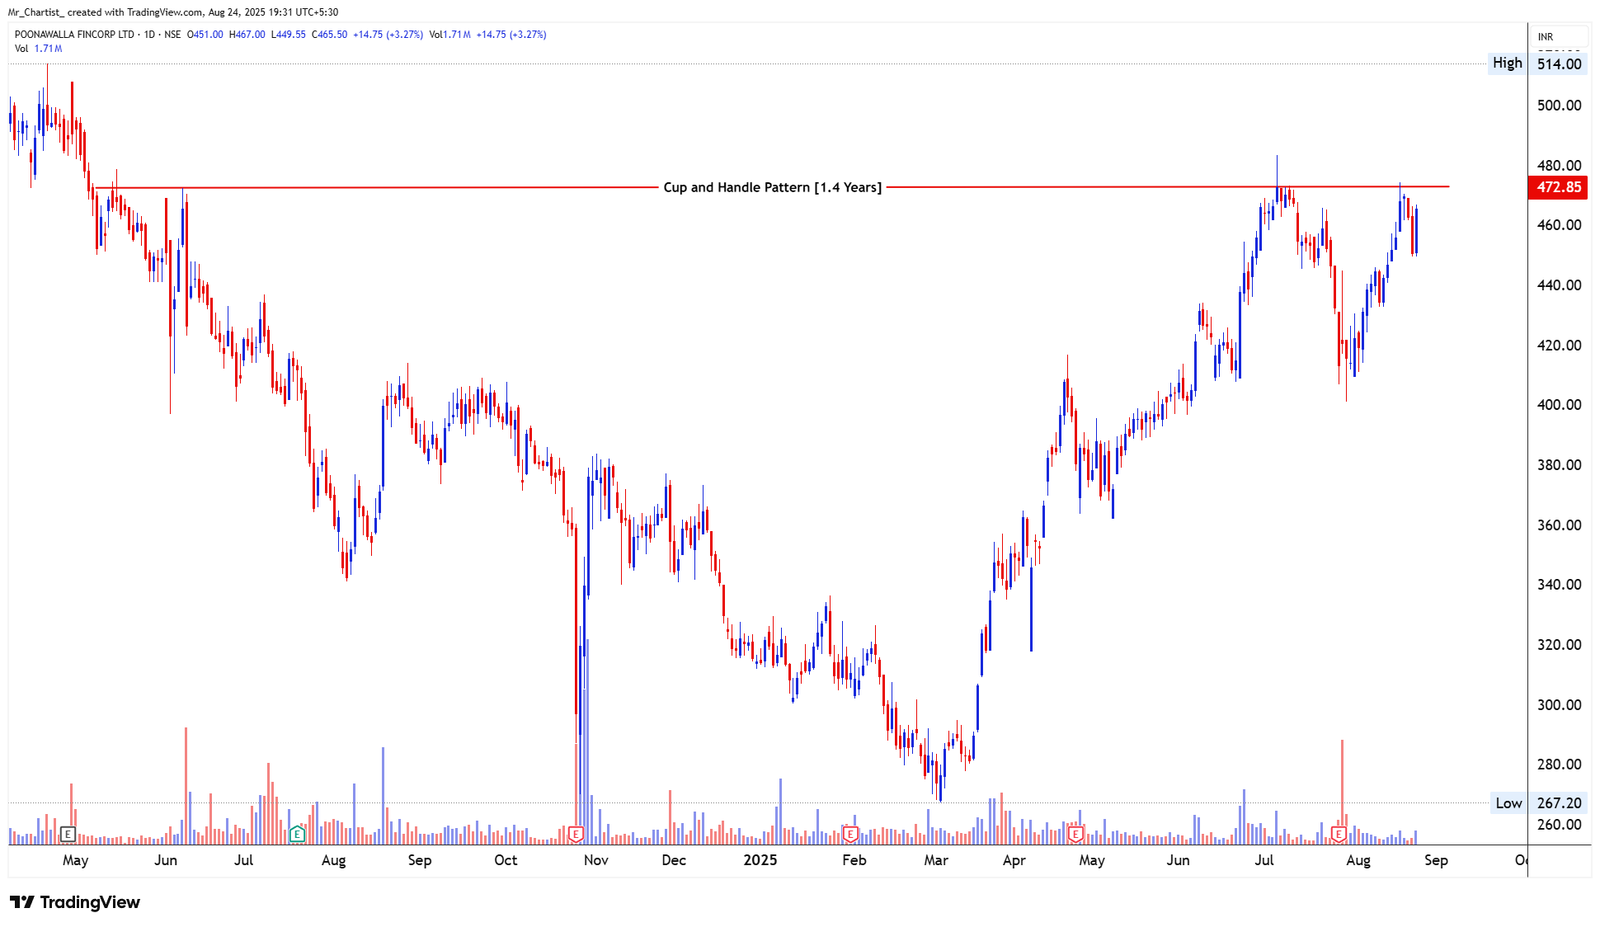
POONAWALLA FINCORP LTD
bullish fnoCup and Handle Formation
1.4 Years (Daily Chart – Long-Term Bullish Base)
Thesis & Analysis
Poonawalla Fincorp is currently testing the neckline of a large Cup and Handle formation that has been developing over the last 1.4 years. The cup was formed through a gradual bottoming process, and the handle emerged via a moderate pullback over the past couple of months. The neckline near ₹472.85 has been tested multiple times recently, but a clean breakout is still pending, with the price pulling back slightly after a retest. This structure signals underlying accumulation, and a sustained breakout above ₹472.85 could activate a long-term trend continuation. Price action remains well- positioned just below the breakout point, showing signs of potential bullish resolution. Candlestick Behavior: Recent candles show upper wicks, indicating resistance at the neckline. However, price is still making higher lows, maintaining a constructive tone. No breakdown candle yet; structure remains intact. Volume Analysis: Volume increased on recent rallies, signaling interest on the way up. Handle formation saw contracting volume, which is typical of this pattern. A breakout with volume above 2.5M would confirm strength. 2. Crucial Support and Resistance Levels Support Zones: ₹450–₹455 – Short-term support in handle region. ₹425 – Previous swing low in handle structure. ₹395–₹400 – Major support zone from prior base. Resistance Zones: ₹472.85 – Neckline of the pattern and breakout level. ₹490–₹500 – Post-breakout resistance cluster. ₹514+ – Previous swing high; medium-term upside target. 3. Strategic Trade Scenarios 🔸 Primary Setup – Breakout Above ₹472.85 A strong close above ₹472.85 with volume expansion would confirm the Cup and Handle breakout, potentially triggering a rally toward ₹500–₹514. 🔹 Alternate Setup – Pullback Within Handle If price pulls back toward ₹450, the structure remains valid as long as it holds above ₹425. A second breakout attempt may follow after further consolidation. ⚠️ Major Breakdown Risk: Only a decisive close below ₹425 would invalidate the handle structure and turn sentiment short-term negative.
Price Action
- ■Price action is structurally positive.
- ■Forming higher highs and higher lows.
Volume Profile
- ■Volume is supportive of the price action.
- ■Wait for volume expansion on breakout.
Key Levels
No zones specified
No zones specified
Invalidation Scenario
A weekly close below the support level invalidates this structure.
Bearish Charts [F&O]
Short setups indicating weakness
Prime Fresh Ltd
bearish fnoDouble Bottom Breakout
Daily Chart
Thesis & Analysis
No detailed thesis provided for this setup.
Price Action
- ■Price action is structurally positive.
- ■Forming higher highs and higher lows.
Volume Profile
- ■Volume is supportive of the price action.
- ■Wait for volume expansion on breakout.
Key Levels
No zones specified
No zones specified
Invalidation Scenario
A weekly close below the support level invalidates this structure.
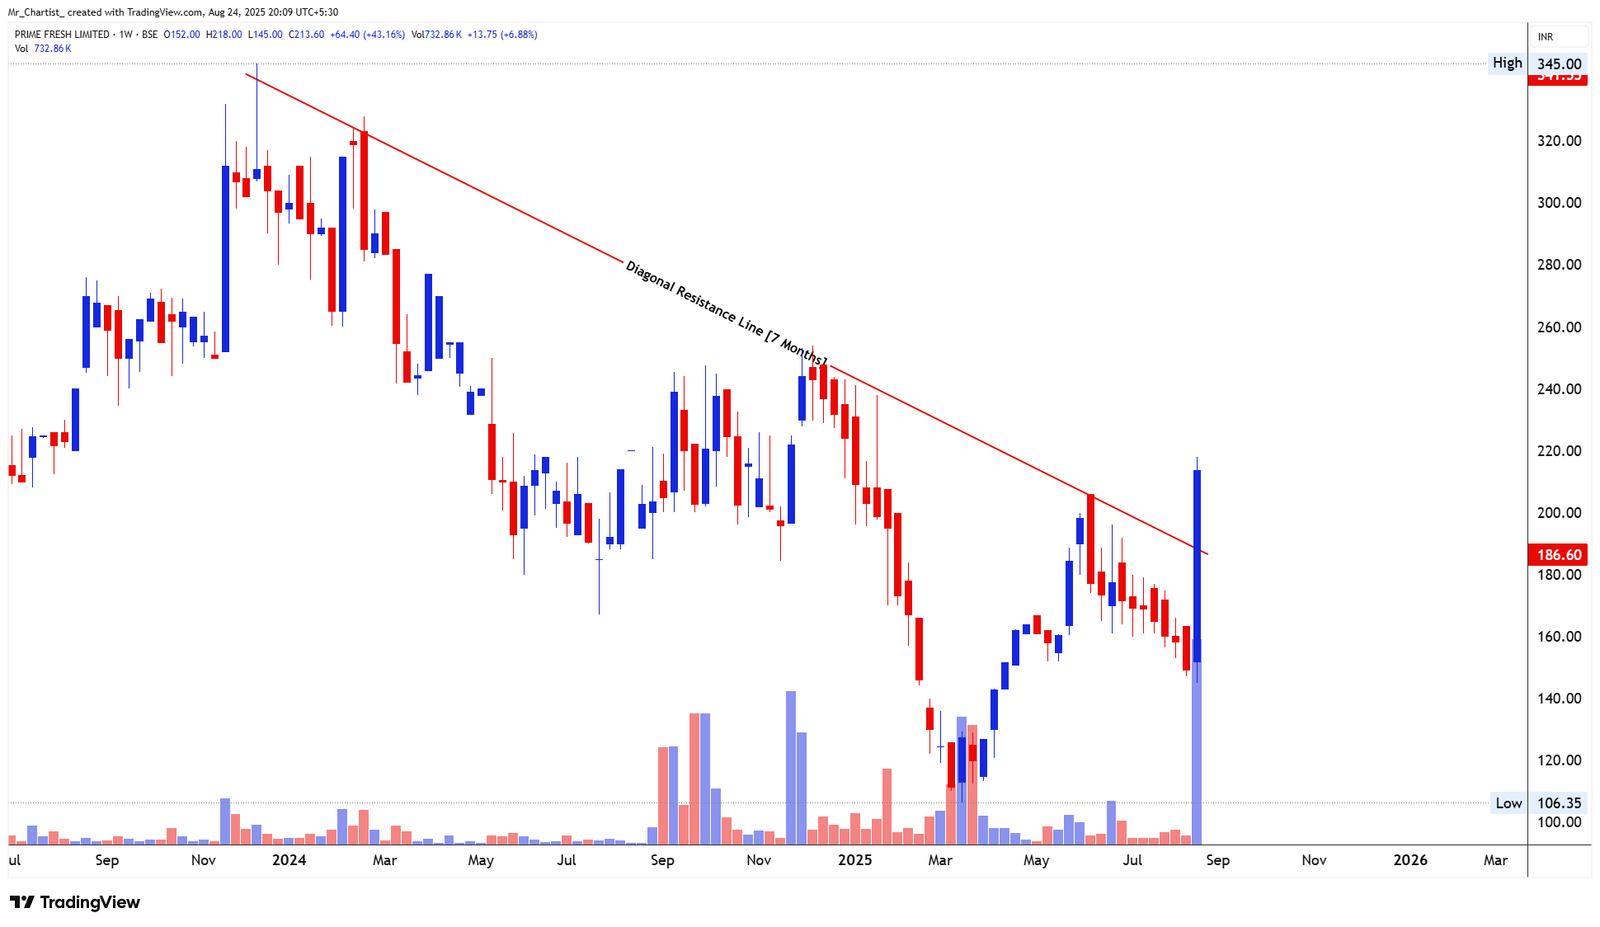
PRIME FRESH LTD
bearish fnoDowntrend Line Breakout
7 Months (Weekly Chart – Trend Reversal Signal)
Thesis & Analysis
Prime Fresh Ltd has broken out above a 7-month descending trendline, which had previously capped all major rallies since early 2024. The breakout occurred on a large bullish candle with a wide range and strong volume surge, signaling a possible trend reversal from the prolonged downtrend. The breakout level around ₹186.60 was decisively cleared, and price has now entered a new momentum phase. This diagonal breakout marks the end of the lower-highs-lower-lows structure that dominated the past quarters. Candlestick Behavior: This week’s candle is a bullish marubozu with no upper wick — indicating strong directional conviction. Prior candles showed decreasing range and volume, typical of compression before breakout. Clean breakout structure above trendline. Volume Analysis: Volume surged to the highest in over a year, validating the breakout. Past breakout attempts lacked volume; this move stands out. Sustained volume above 500K in coming sessions would confirm follow-through strength. 2. Crucial Support and Resistance Levels Support Zones: ₹186.60 – Trendline breakout point; immediate support. ₹170 – Prior swing high; minor support. ₹150 – Major base from recent accumulation. Resistance Zones: ₹230–₹240 – Short-term resistance zone. ₹260–₹275 – Historical congestion area. ₹300+ – Round number and prior breakdown point. 3. Strategic Trade Scenarios 🔸 Primary Setup – Post-Breakout Rally If price sustains above ₹186.60 and shows follow-through, a continued rally toward ₹230– ₹260 is likely in the near to medium term. Consolidation above ₹200 would further strengthen the bullish structure. 🔹 Alternate Setup – Retest Before Extension If price dips back to ₹186.60–₹190 but holds, a retest of breakout may offer a base for fresh momentum. ⚠️ Major Breakdown Risk: A close below ₹170 would weaken the breakout structure and may lead to a retest of the ₹150 zone, though current signals do not suggest imminent weakness.
Price Action
- ■Price action is structurally positive.
- ■Forming higher highs and higher lows.
Volume Profile
- ■Volume is supportive of the price action.
- ■Wait for volume expansion on breakout.
Key Levels
No zones specified
No zones specified
Invalidation Scenario
A weekly close below the support level invalidates this structure.
Mangalam Infra & Eng Ltd
bearish fnoDouble Bottom Breakout
Daily Chart
Thesis & Analysis
No detailed thesis provided for this setup.
Price Action
- ■Price action is structurally positive.
- ■Forming higher highs and higher lows.
Volume Profile
- ■Volume is supportive of the price action.
- ■Wait for volume expansion on breakout.
Key Levels
No zones specified
No zones specified
Invalidation Scenario
A weekly close below the support level invalidates this structure.
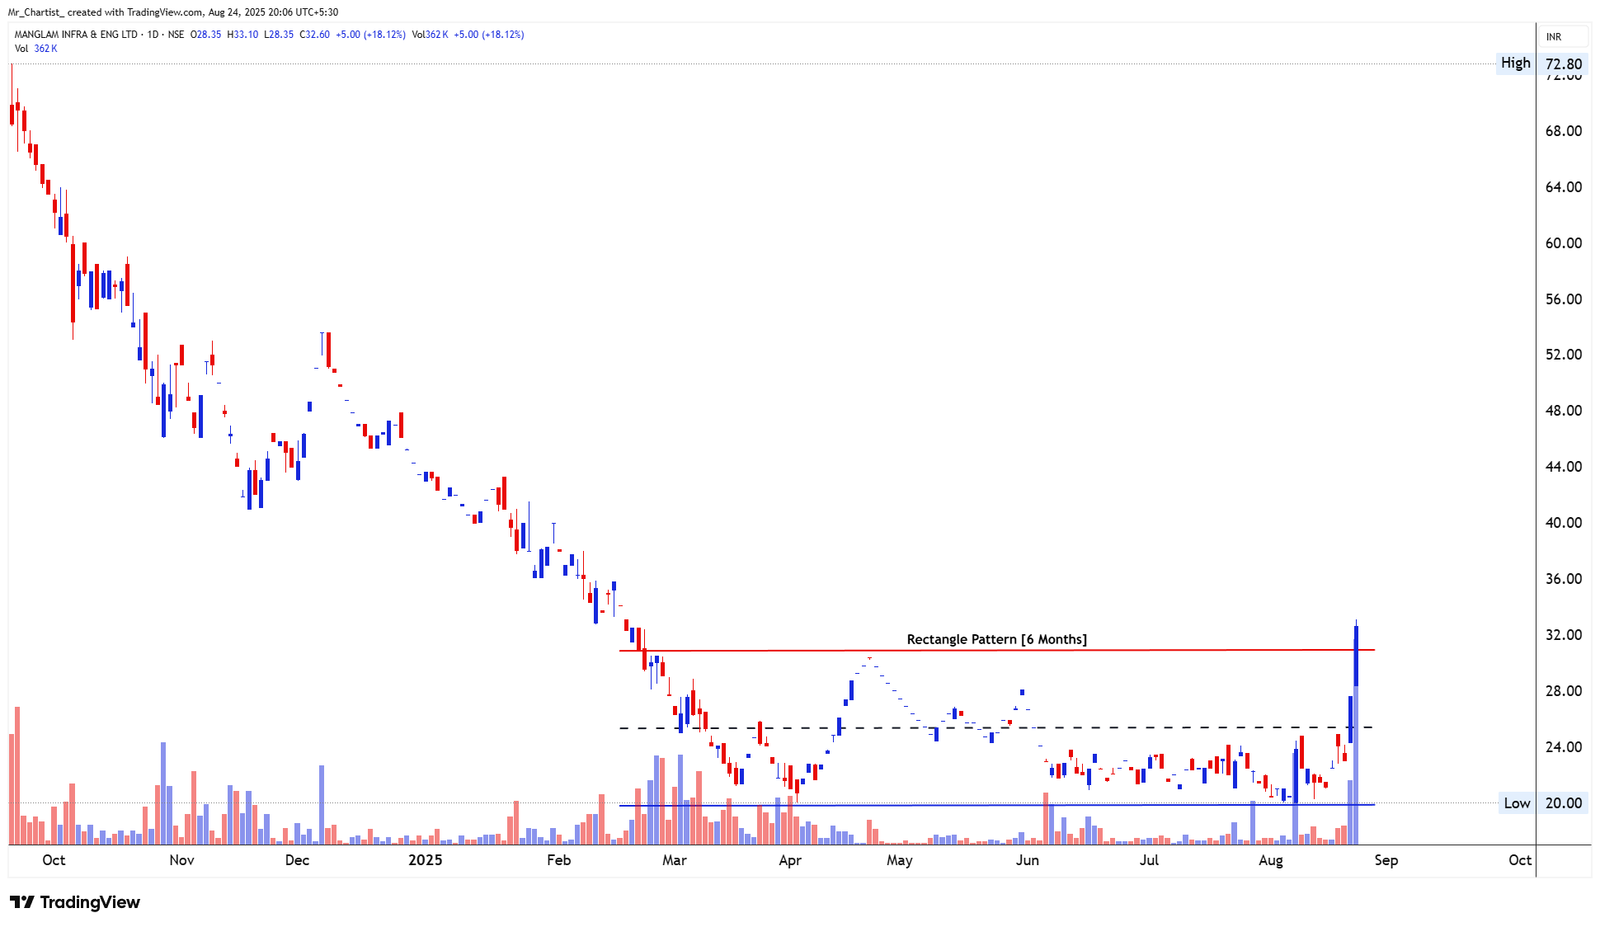
MANGALAM INFRA & ENG LTD
bearish fnoRectangle Breakout
6 Months (Daily Chart – Base Formation Breakout)
Thesis & Analysis
MIEL has successfully broken out of a 6-month rectangle pattern, with defined resistance near ₹31.50 and support around ₹20. The structure represents a prolonged accumulation phase, where price oscillated within a narrow range before today's high- volume breakout. The breakout candle closed well above the range, supported by heavy volume and bullish momentum, suggesting strong participation and possible trend reversal from the prior long-term downtrend. This shift reflects a move from consolidation to expansion, and the stock is now entering uncharted short-term territory with bullish undertones. Candlestick Behavior: Today's breakout candle is large-bodied and strong, closing near the high. No upper wick signifies strong conviction and momentum. Recent candles show steady buildup before the explosive move. Volume Analysis: Volume surged sharply to multi-month highs, confirming breakout strength. Previous sessions showed gradual accumulation. Sustained higher volume would support further upside. 2. Crucial Support and Resistance Levels Support Zones: ₹30.50–₹31.50 – Previous rectangle resistance; now immediate support. ₹28.00 – Mid-rectangle pivot; intraday support on dip. ₹25.00 – Last consolidation floor. Resistance Zones: ₹36.00–₹38.00 – Potential resistance based on measured breakout extension. ₹42.00+ – Historical congestion zone from prior downtrend. 3. Strategic Trade Scenarios 🔸 Primary Setup – Sustained Breakout Rally If price remains above ₹31.50 with continued volume flow, the breakout may extend toward ₹36.00–₹38.00. Trend confirmation improves on follow-up bullish candles. 🔹 Alternate Setup – Retest of Breakout Level If price pulls back to ₹30.50–₹31.50 but holds, it may offer a classic retest opportunity before another upward leg. ⚠️ Major Breakdown Risk: Only a sharp drop below ₹28.00 would weaken the breakout and suggest a failed move, possibly dragging it back to the ₹25.00 zone.
Price Action
- ■Price action is structurally positive.
- ■Forming higher highs and higher lows.
Volume Profile
- ■Volume is supportive of the price action.
- ■Wait for volume expansion on breakout.
Key Levels
No zones specified
No zones specified
Invalidation Scenario
A weekly close below the support level invalidates this structure.
Sudarshan Pharma Industries Ltd
bearish fnoDouble Bottom Breakout
Daily Chart
Thesis & Analysis
No detailed thesis provided for this setup.
Price Action
- ■Price action is structurally positive.
- ■Forming higher highs and higher lows.
Volume Profile
- ■Volume is supportive of the price action.
- ■Wait for volume expansion on breakout.
Key Levels
No zones specified
No zones specified
Invalidation Scenario
A weekly close below the support level invalidates this structure.
Chart Image Not Extracted
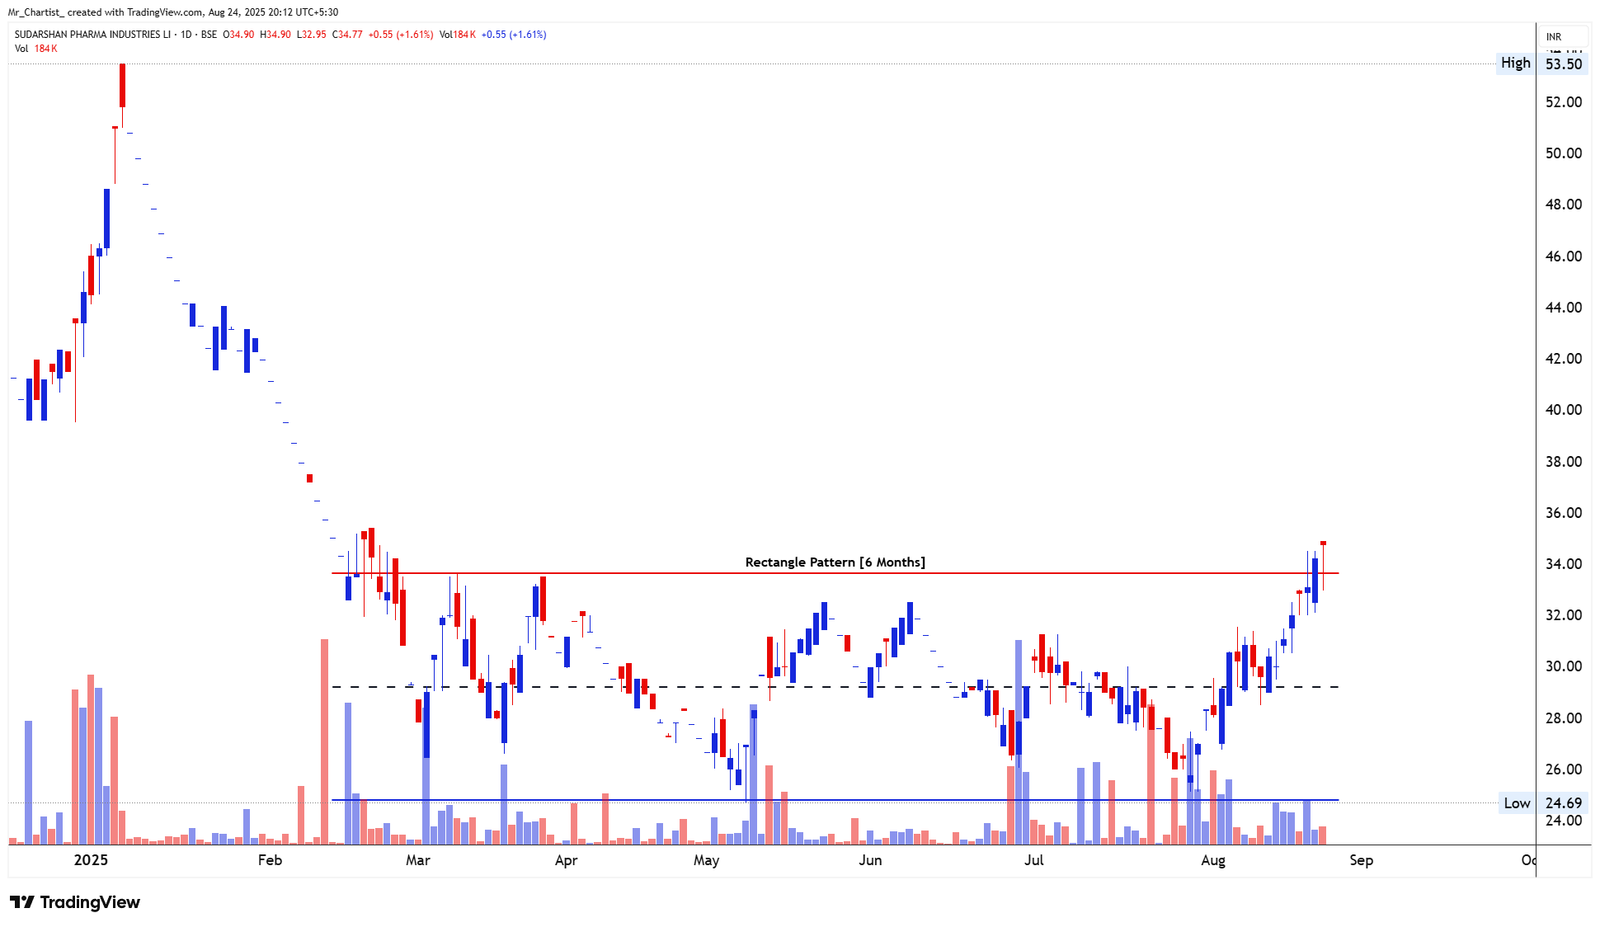
SUDARSHAN PHARMA INDUSTRIES LTD
bearish fnoRectangle Breakout
Daily Chart
Thesis & Analysis
The stock has broken out of a 6-month rectangle consolidation pattern, with the upper resistance at ₹34 being cleared on strong bullish momentum. This breakout is significant considering the stock was tightly range-bound between ₹34 (resistance) and ₹25 (support) since March 2025. Candlestick Structure: The last few candles show strong bodies with higher highs and higher lows — confirming bullish control. A decisive breakout candle has closed above the rectangle resistance. Minor upper wick suggests slight profit-taking but no rejection. Volume Behavior: Noticeable volume expansion during the breakout — essential confirmation signal. Volume remained muted during consolidation, making the current spike more impactful. 2. Key Support and Resistance Levels Support Zones: ₹34 – Previous resistance now acting as immediate support. ₹30 – Mid-level support within the rectangle. ₹25 – Pattern base support. Resistance Zones: ₹38–₹40 – Minor resistance based on prior price memory. ₹44–₹48 – Major supply zone. ₹53.50 – All-time high visible on chart. 3. Trade Scenarios and Strategy 🔸 Primary Scenario – Bullish Continuation If the stock holds above ₹34 on closing basis, there's potential for a continued rally toward ₹38–₹40 in the short term, and ₹44–₹48 in the medium term. 🔹 Retest Scenario – Pullback Entry If price retests ₹34–₹33 zone and holds, it may offer a high-probability re-entry zone before a fresh leg up. ⚠️ Failure Signal: If the price falls back into the rectangle and closes below ₹32, the breakout would be deemed false, increasing risk of decline toward ₹30 and ₹25.
Price Action
- ■Price action is structurally positive.
- ■Forming higher highs and higher lows.
Volume Profile
- ■Volume is supportive of the price action.
- ■Wait for volume expansion on breakout.
Key Levels
No zones specified
No zones specified
Invalidation Scenario
A weekly close below the support level invalidates this structure.
GPIL
bearish fnoDouble Bottom Breakout
Daily Chart
Thesis & Analysis
No detailed thesis provided for this setup.
Price Action
- ■Price action is structurally positive.
- ■Forming higher highs and higher lows.
Volume Profile
- ■Volume is supportive of the price action.
- ■Wait for volume expansion on breakout.
Key Levels
No zones specified
No zones specified
Invalidation Scenario
A weekly close below the support level invalidates this structure.
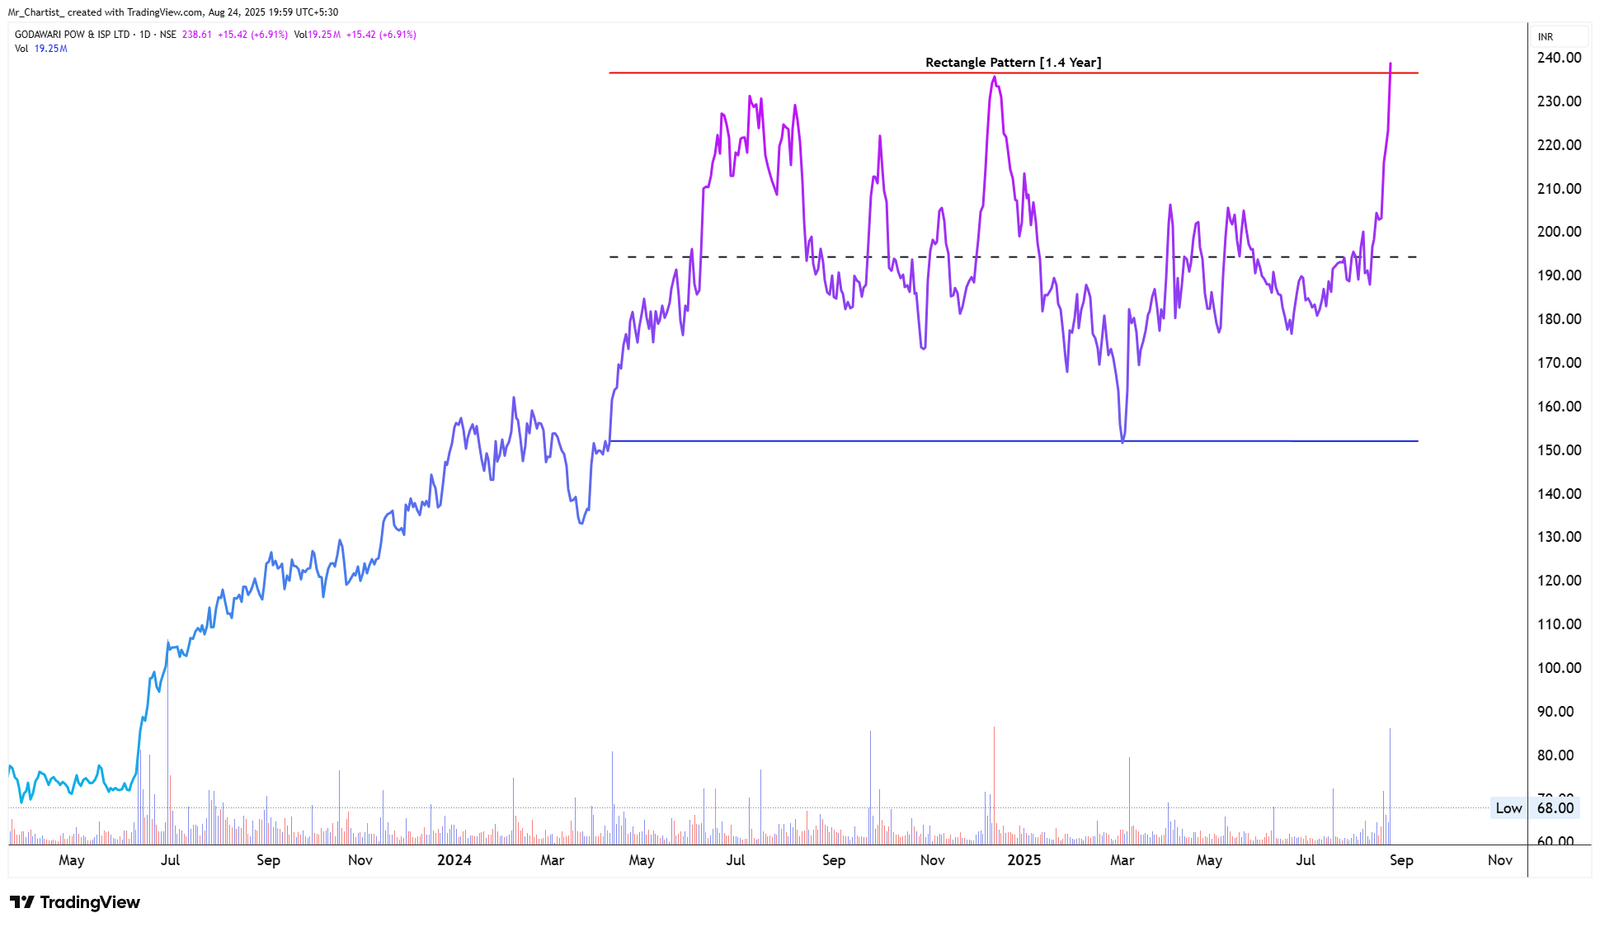
GPIL
bearish fnoRectangle Pattern (Resistance Retest)
1.4 Years (Daily Chart – Bullish Continuation Setup)
Thesis & Analysis
GPIL has been forming a large rectangle pattern for over a year, consolidating between ₹150 and ₹238. The stock recently retested the upper boundary of this range near ₹238, showing strong momentum but closing off highs—indicating hesitation near resistance. The pattern reflects a broad base with well-defined horizontal levels. Price remains in the upper half of the range, suggesting controlled accumulation with buyers gradually stepping in. Today's red candle near resistance suggests short-term supply pressure. A confirmed breakout above ₹238 with volume would validate the rectangle breakout and open up higher levels. However, rejection here may lead to a pullback toward mid-level support at ₹205. Candlestick Behavior: Long upper wick today signals supply near ₹238. Recent candles show increasing body size—momentum buildup. No clear reversal yet; structure remains neutral-to-bullish. Volume Analysis: Noticeable volume surge on recent rally—sign of accumulation. Today's high-volume rejection hints at profit booking. Sustained high volume on breakout is key confirmation. 2. Crucial Support and Resistance Levels Support Zones: ₹205 – Mid-range support and prior demand zone. ₹190 – Minor intermediate support. ₹150 – Strong base support, bottom of rectangle. Resistance Zones: ₹238 – Rectangle top; key breakout level. ₹260 – Minor resistance post-breakout. ₹285 – Measured move target if breakout sustains. 3. Strategic Trade Scenarios 🔸 Primary Setup – Breakout Above ₹238 If price closes above ₹238 with strong volume, it confirms rectangle breakout. Targets open up toward ₹260 and ₹285 over the medium term. 🔹 Alternate Setup – Range Retest Continues If price fails to close above ₹238 and dips back to ₹205–₹190, the rectangle pattern remains valid. Accumulation within this zone may continue. ⚠️ Major Breakdown Risk A close below ₹190 would damage structure short-term and bring downside risk toward ₹150. This would negate the bullish range thesis.
Price Action
- ■Price action is structurally positive.
- ■Forming higher highs and higher lows.
Volume Profile
- ■Volume is supportive of the price action.
- ■Wait for volume expansion on breakout.
Key Levels
No zones specified
No zones specified
Invalidation Scenario
A weekly close below the support level invalidates this structure.
Netweb Tech India Ltd
bearish fnoDouble Bottom Breakout
Daily Chart
Thesis & Analysis
No detailed thesis provided for this setup.
Price Action
- ■Price action is structurally positive.
- ■Forming higher highs and higher lows.
Volume Profile
- ■Volume is supportive of the price action.
- ■Wait for volume expansion on breakout.
Key Levels
No zones specified
No zones specified
Invalidation Scenario
A weekly close below the support level invalidates this structure.
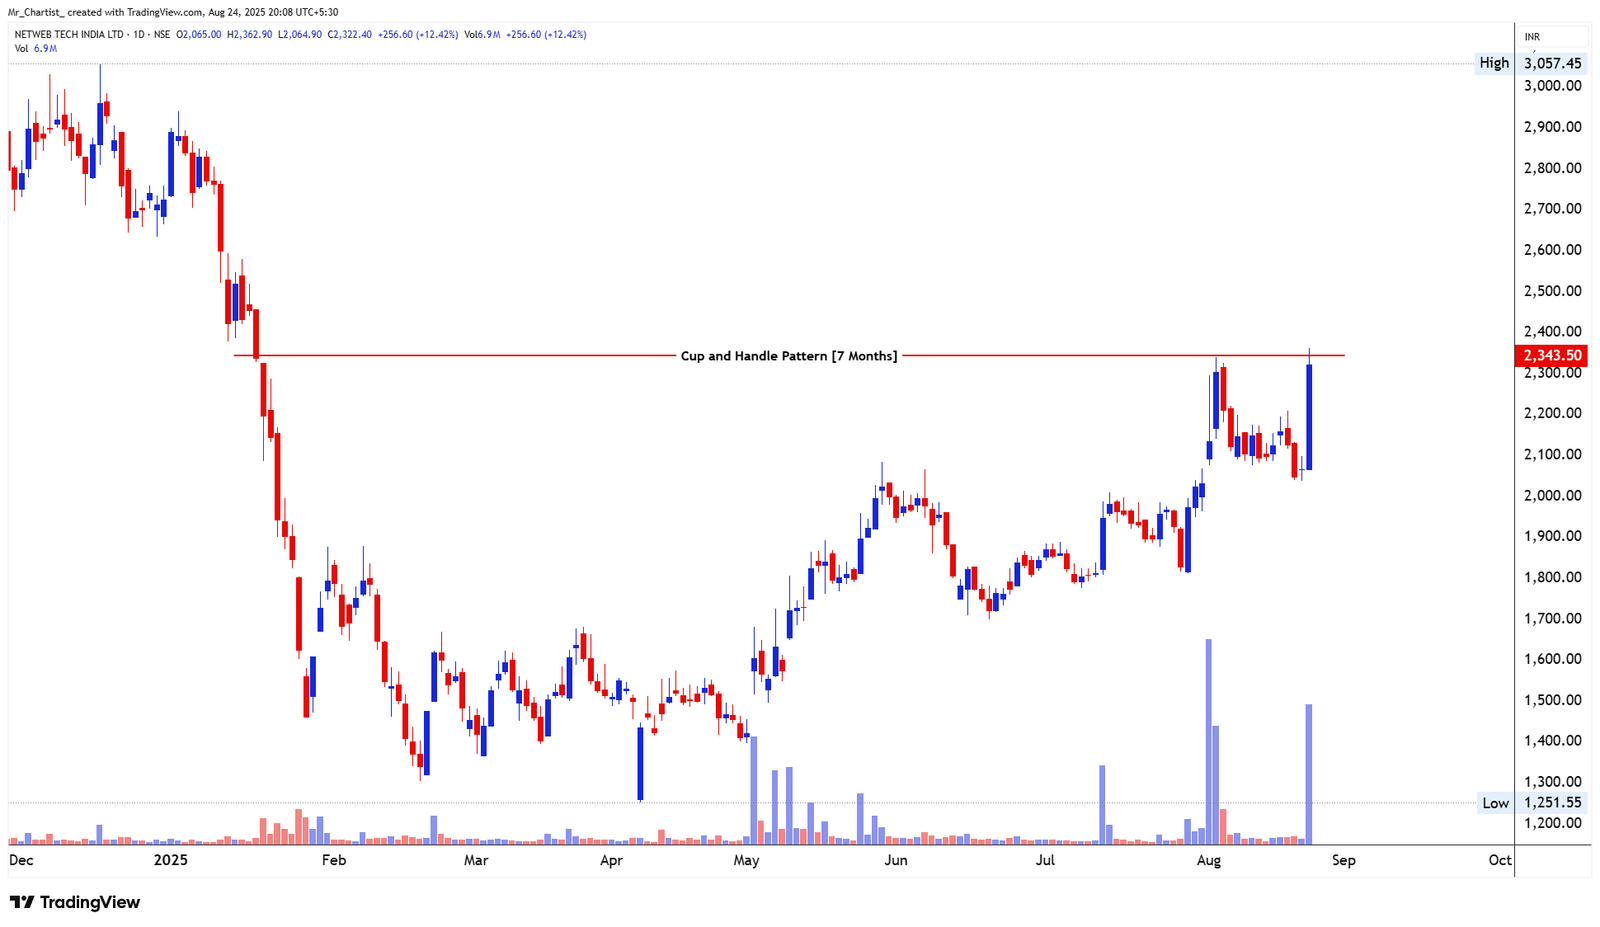
NETWEB TECH INDIA LTD
bearish fnoCup and Handle Formation (Handle Breakout Attempt)
7 Months (Daily Chart – Bullish Continuation Setup)
Thesis & Analysis
Netweb Tech has been forming a classic Cup and Handle pattern over the past 7 months, with price carving out a deep rounded base between January and June 2025. This base stabilized around the ₹1,250 level before staging a strong recovery to reclaim lost ground. The neckline resistance sits at ₹2,343.50, representing the top of the cup and a prior supply zone. Recently, the stock completed a shallow handle phase characterized by consolidation within a tight band around ₹2,100–₹2,250. The current breakout attempt above the neckline occurred on strong bullish momentum and volume surge, indicating rising participation and breakout confirmation. However, as with any handle breakout, sustaining above the neckline will be crucial in validating the pattern. Candlestick Behavior: The handle region displayed multiple inside candles and doji formations, typical of absorption phases. The breakout candle is large and bullish, engulfing recent consolidation candles—strong signal. Minimal upper wick suggests strong close near high. Volume Analysis: Noticeable volume contraction during handle consolidation – a bullish trait. Today's breakout candle was accompanied by a sharp spike in volume, indicating buyer interest. Lack of heavy volume during the dip supports accumulation bias. 2. Crucial Support and Resistance Levels Support Zones: ₹2,250 – Immediate support (top of handle range and retest zone). ₹2,100 – Handle low and short-term pivot. ₹1,875 – Mid-base support zone from earlier structure. Resistance Zones: ₹2,343.50 – Breakout level; must hold for confirmation. ₹2,500 – Short-term resistance zone (psychological and swing barrier). ₹2,775 – Measured move target based on pattern depth. 3. Strategic Trade Scenarios 🔸 Primary Setup – Breakout Follow-Through Above ₹2,343.50 If price sustains above ₹2,343.50 on follow-up sessions, it would validate the cup and handle pattern. This opens up targets of ₹2,500, followed by ₹2,775 as a measured objective over the medium term. 🔹 Alternate Setup – Retest and Bounce from ₹2,250–₹2,275 In case of minor pullbacks, watch the ₹2,250 zone for demand re-entry. A successful retest followed by a bounce would reconfirm bullish continuation and offer a favorable re-entry. ⚠️ Major Breakdown Risk A decisive close below ₹2,100 would invalidate the handle structure and trigger short-term weakness. This may result in price slipping toward ₹1,875, negating the current breakout optimism.
Price Action
- ■Price action is structurally positive.
- ■Forming higher highs and higher lows.
Volume Profile
- ■Volume is supportive of the price action.
- ■Wait for volume expansion on breakout.
Key Levels
No zones specified
No zones specified
Invalidation Scenario
A weekly close below the support level invalidates this structure.
Ramco Industries Ltd
bearish fnoDouble Bottom Breakout
Daily Chart
Thesis & Analysis
No detailed thesis provided for this setup.
Price Action
- ■Price action is structurally positive.
- ■Forming higher highs and higher lows.
Volume Profile
- ■Volume is supportive of the price action.
- ■Wait for volume expansion on breakout.
Key Levels
No zones specified
No zones specified
Invalidation Scenario
A weekly close below the support level invalidates this structure.
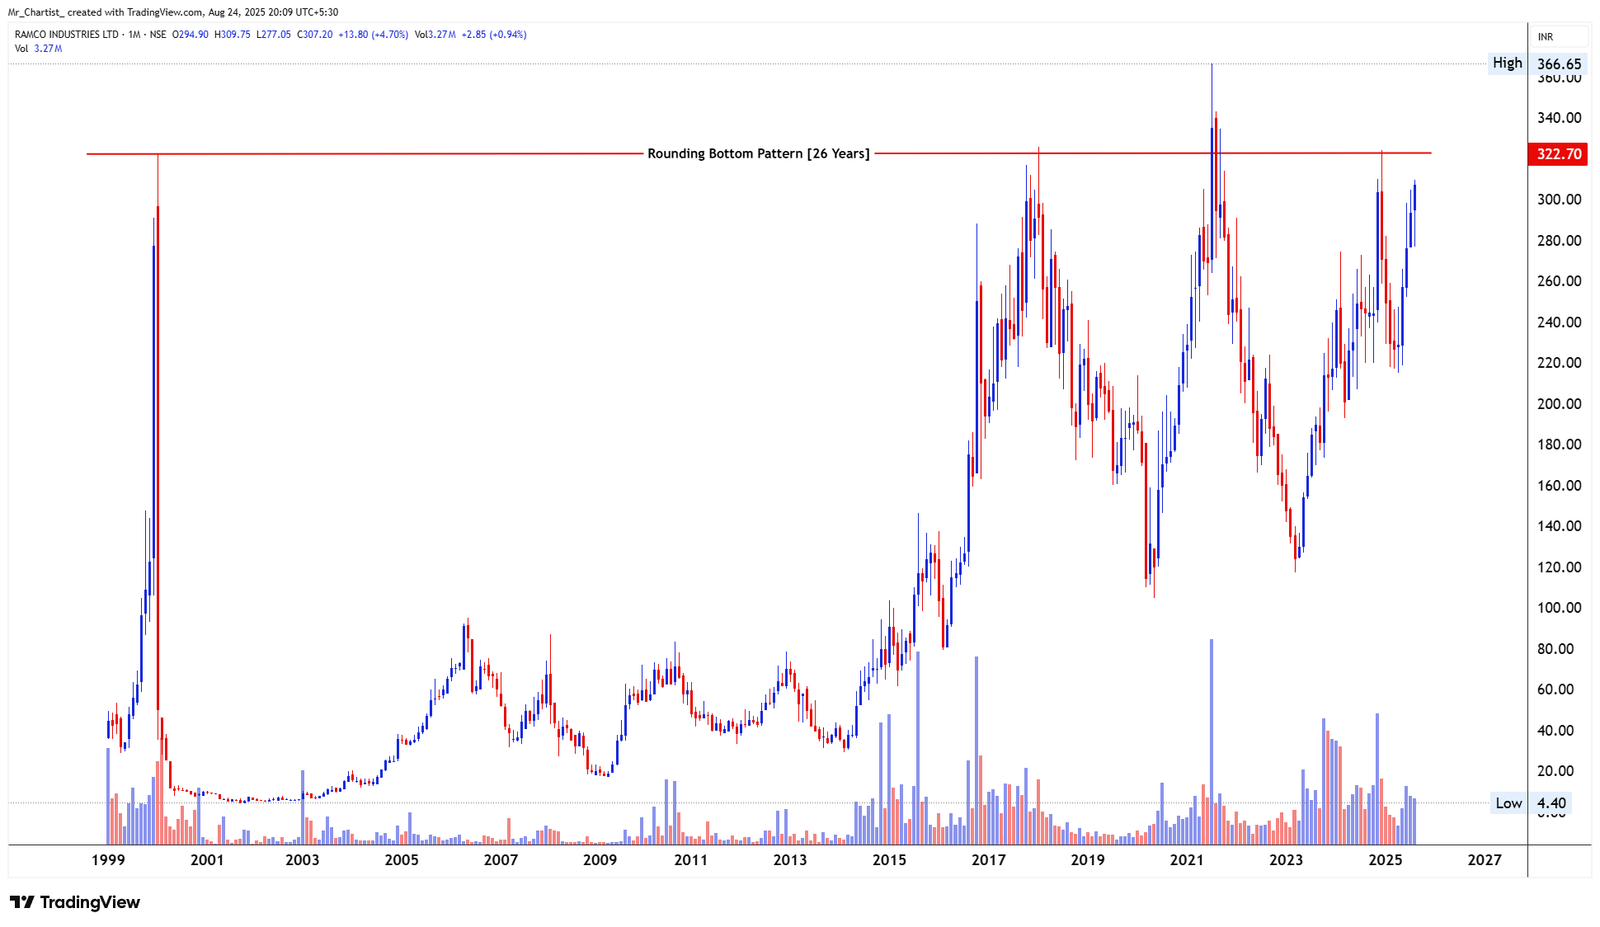
RAMCO INDUSTRIES LTD
bearish fnoRounding Bottom Pattern
26 Years (Monthly Chart – Long-Term Structural Setup)
Thesis & Analysis
Ramco Industries is forming a massive rounding bottom pattern, spanning more than two decades on the monthly chart—a classic long-term base building structure that reflects gradual accumulation, sectoral shifts, and macro recovery. The rounding structure began forming post the 1999 high near ₹322.70, which now acts as the major neckline resistance. Since then, the stock went through multiple long down-cycles and recoveries, but each corrective phase gradually saw higher lows —especially notable from 2013 onward. In the recent 5 years, price has been climbing steadily, respecting the curvature of the base. The latest bullish leg has now brought it back near the key neckline at ₹322.70, where it is facing historical supply. This kind of prolonged accumulation pattern often precedes a multi-year breakout rally, if confirmed with volume and price momentum above the neckline. Candlestick Behavior: Monthly candles show strong bullish recovery since early 2023. Recent candles are showing small wicks and higher closes – signs of steady demand. Current price is consolidating just below the neckline – a healthy pre-breakout pause. Volume Analysis: Historical volume was muted for years, but picked up strongly from 2016 onward. Multiple monthly spikes during rallies suggest institutional activity. No signs of panic volume on declines; accumulation likely ongoing. 2. Crucial Support and Resistance Levels Support Zones: ₹275 – Minor support from recent consolidation. ₹245 – Higher low support formed in 2023. ₹200 – Long-term structural base zone and 10-year average. Resistance Zones: ₹322.70 – Multi-decade neckline and historical high. ₹345 – 2018 swing high; potential barrier post-breakout. ₹400+ – Psychological zone and long-term breakout extension target.
Price Action
- ■Price action is structurally positive.
- ■Forming higher highs and higher lows.
Volume Profile
- ■Volume is supportive of the price action.
- ■Wait for volume expansion on breakout.
Key Levels
No zones specified
No zones specified
Invalidation Scenario
A weekly close below the support level invalidates this structure.
RAMCO INDUSTRIES LTD
bearish fnoDouble Bottom Breakout
Daily Chart
Thesis & Analysis
No detailed thesis provided for this setup.
Price Action
- ■Price action is structurally positive.
- ■Forming higher highs and higher lows.
Volume Profile
- ■Volume is supportive of the price action.
- ■Wait for volume expansion on breakout.
Key Levels
No zones specified
No zones specified
Invalidation Scenario
A weekly close below the support level invalidates this structure.
Royal Orchid Hotels Ltd
bearish fnoDouble Bottom Breakout
Daily Chart
Thesis & Analysis
No detailed thesis provided for this setup.
Price Action
- ■Price action is structurally positive.
- ■Forming higher highs and higher lows.
Volume Profile
- ■Volume is supportive of the price action.
- ■Wait for volume expansion on breakout.
Key Levels
No zones specified
No zones specified
Invalidation Scenario
A weekly close below the support level invalidates this structure.
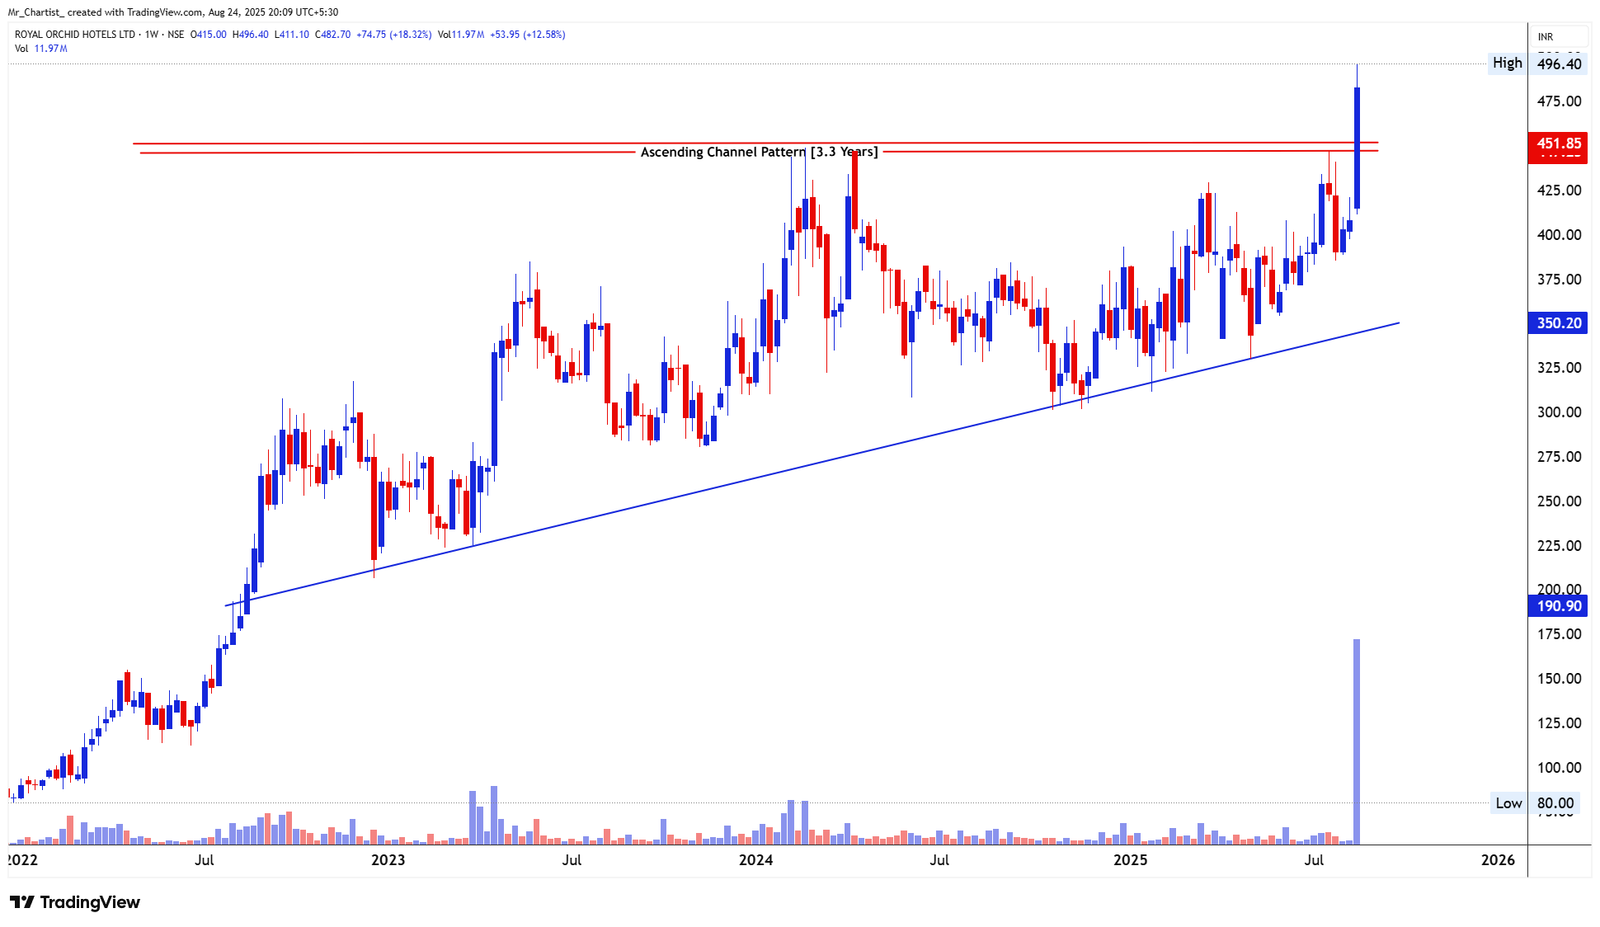
ROYAL ORCHID HOTELS LTD
bearish fnoAscending Channel Pattern
3.3 Years (Weekly Chart – Bullish Breakout)
Thesis & Analysis
Royal Orchid Hotels has been gradually building strength inside a well-defined ascending channel over the last 3.3 years, showcasing a textbook higher highs and higher lows structure. Price action has respected the lower rising trendline through multiple retests, offering structural integrity and a clear bullish bias. This week, price decisively broke above the upper channel resistance (~₹451.85), supported by a strong bullish candle and surge in volume, suggesting institutional interest. The breakout marks a shift from medium-term consolidation into potential trend acceleration. The breakout candle also cleared prior swing highs (₹450–₹460 zone), turning that area into a potential retest and support zone going forward. This also invalidates prior supply pressure and signals fresh buying momentum. Candlestick Behavior: The breakout candle is large-bodied and closes near the high – a strong bullish signal. Prior weeks showed tight ranges and small candles, indicating compression before the breakout. Breakout from such a long-term channel often leads to sustained follow-through. Volume Analysis: Volume on the breakout is the highest in the last 12 months, confirming strength. Past rallies also showed clean volume expansion – a bullish characteristic. Volume contraction within the channel earlier confirmed accumulation phase. 2. Crucial Support and Resistance Levels Support Zones: ₹451.85 – Breakout zone and prior resistance; now acting as first support. ₹420 – Minor support from previous price clusters. ₹350 – Long-term trendline support of the ascending channel. Resistance Zones: ₹500 – Psychological round number; near-term resistance. ₹525 – Projected target based on channel height. ₹550–₹580 – Extension zone if momentum sustains.
Price Action
- ■Price action is structurally positive.
- ■Forming higher highs and higher lows.
Volume Profile
- ■Volume is supportive of the price action.
- ■Wait for volume expansion on breakout.
Key Levels
No zones specified
No zones specified
Invalidation Scenario
A weekly close below the support level invalidates this structure.
ROYAL ORCHID HOTELS LTD
bearish fnoDouble Bottom Breakout
Daily Chart
Thesis & Analysis
No detailed thesis provided for this setup.
Price Action
- ■Price action is structurally positive.
- ■Forming higher highs and higher lows.
Volume Profile
- ■Volume is supportive of the price action.
- ■Wait for volume expansion on breakout.
Key Levels
No zones specified
No zones specified
Invalidation Scenario
A weekly close below the support level invalidates this structure.
Shaily Engineering Plastics Ltd
bearish fnoDouble Bottom Breakout
Daily Chart
Thesis & Analysis
No detailed thesis provided for this setup.
Price Action
- ■Price action is structurally positive.
- ■Forming higher highs and higher lows.
Volume Profile
- ■Volume is supportive of the price action.
- ■Wait for volume expansion on breakout.
Key Levels
No zones specified
No zones specified
Invalidation Scenario
A weekly close below the support level invalidates this structure.
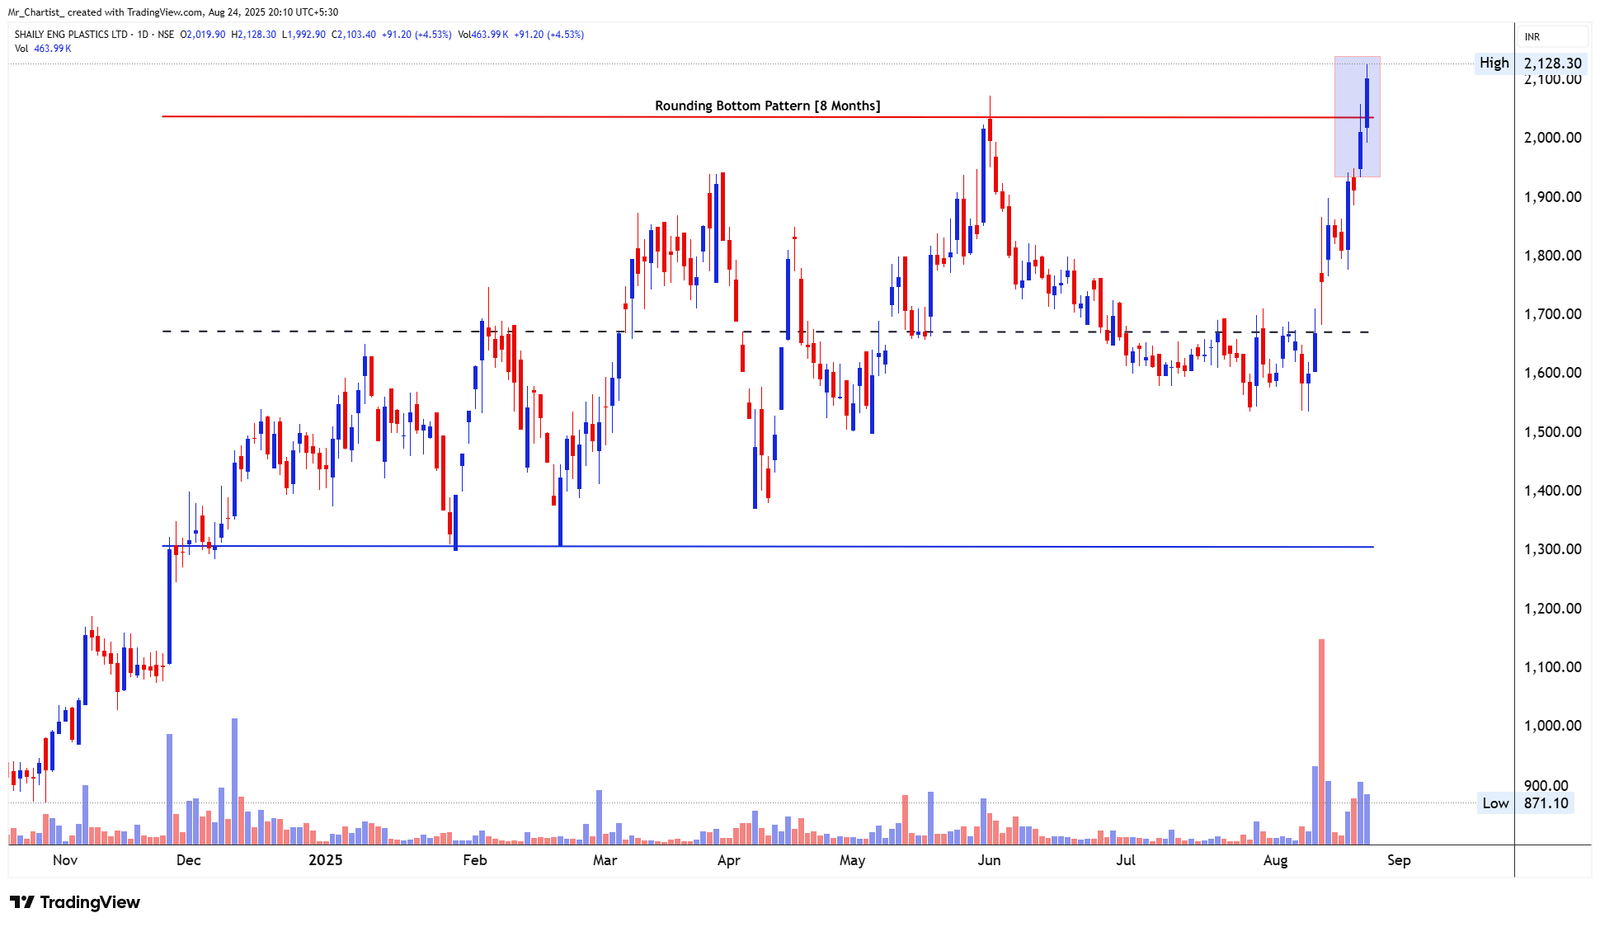
SHAILY ENGINEERING PLASTICS LTD
bearish fnoRounding Bottom Pattern
8 Months (Daily Chart – Bullish Reversal Structure)
Thesis & Analysis
Shaily Engineering Plastics has completed an 8-month Rounding Bottom pattern, a classic accumulation-to-breakout formation, signifying a base-building phase followed by fresh bullish intent. The structure exhibits a smooth curve with multiple rejections around the neckline zone near ₹2,000, which has now been decisively broken. The stock saw strong follow-through price action above the neckline, hitting a fresh high of ₹2,128.30 with a strong bullish candle. The breakout zone has also been retested intraday and held, validating it as fresh support. This kind of bottoming structure reflects long-term seller exhaustion followed by gradual buyer dominance, setting the stage for trend reversal. Candlestick Behavior: The breakout candle is large, clean, and closes near the high—bullish intent. Prior sessions showed tight coiling near ₹1,900–₹2,000 resistance before the breakout. Minor upper wick on breakout suggests mild profit booking, but structure remains strong. Volume Analysis: Volume during breakout was significantly above average, confirming accumulation and bullish strength. Noticeable volume expansion over the last 2 weeks, showing steady demand flow. Prior down-moves had declining volume—a sign of seller fatigue. 2. Crucial Support and Resistance Levels Support Zones: ₹2,000 – Neckline breakout zone; now acting as key support. ₹1,700 – Intermediate range support from multiple prior swing lows. ₹1,300 – Pattern base and long-term demand zone. Resistance Zones: ₹2,150 – Immediate resistance from today’s high. ₹2,250–2,300 – Short-term Fibonacci extension targets. ₹2,500+ – Potential measured move if the full pattern unfolds.
Price Action
- ■Price action is structurally positive.
- ■Forming higher highs and higher lows.
Volume Profile
- ■Volume is supportive of the price action.
- ■Wait for volume expansion on breakout.
Key Levels
No zones specified
No zones specified
Invalidation Scenario
A weekly close below the support level invalidates this structure.
SHAILY ENGINEERING PLASTICS LTD
bearish fnoDouble Bottom Breakout
Daily Chart
Thesis & Analysis
No detailed thesis provided for this setup.
Price Action
- ■Price action is structurally positive.
- ■Forming higher highs and higher lows.
Volume Profile
- ■Volume is supportive of the price action.
- ■Wait for volume expansion on breakout.
Key Levels
No zones specified
No zones specified
Invalidation Scenario
A weekly close below the support level invalidates this structure.
Tamilnadu Petroproducts Ltd
bearish fnoDouble Bottom Breakout
Daily Chart
Thesis & Analysis
No detailed thesis provided for this setup.
Price Action
- ■Price action is structurally positive.
- ■Forming higher highs and higher lows.
Volume Profile
- ■Volume is supportive of the price action.
- ■Wait for volume expansion on breakout.
Key Levels
No zones specified
No zones specified
Invalidation Scenario
A weekly close below the support level invalidates this structure.
Chart Image Not Extracted
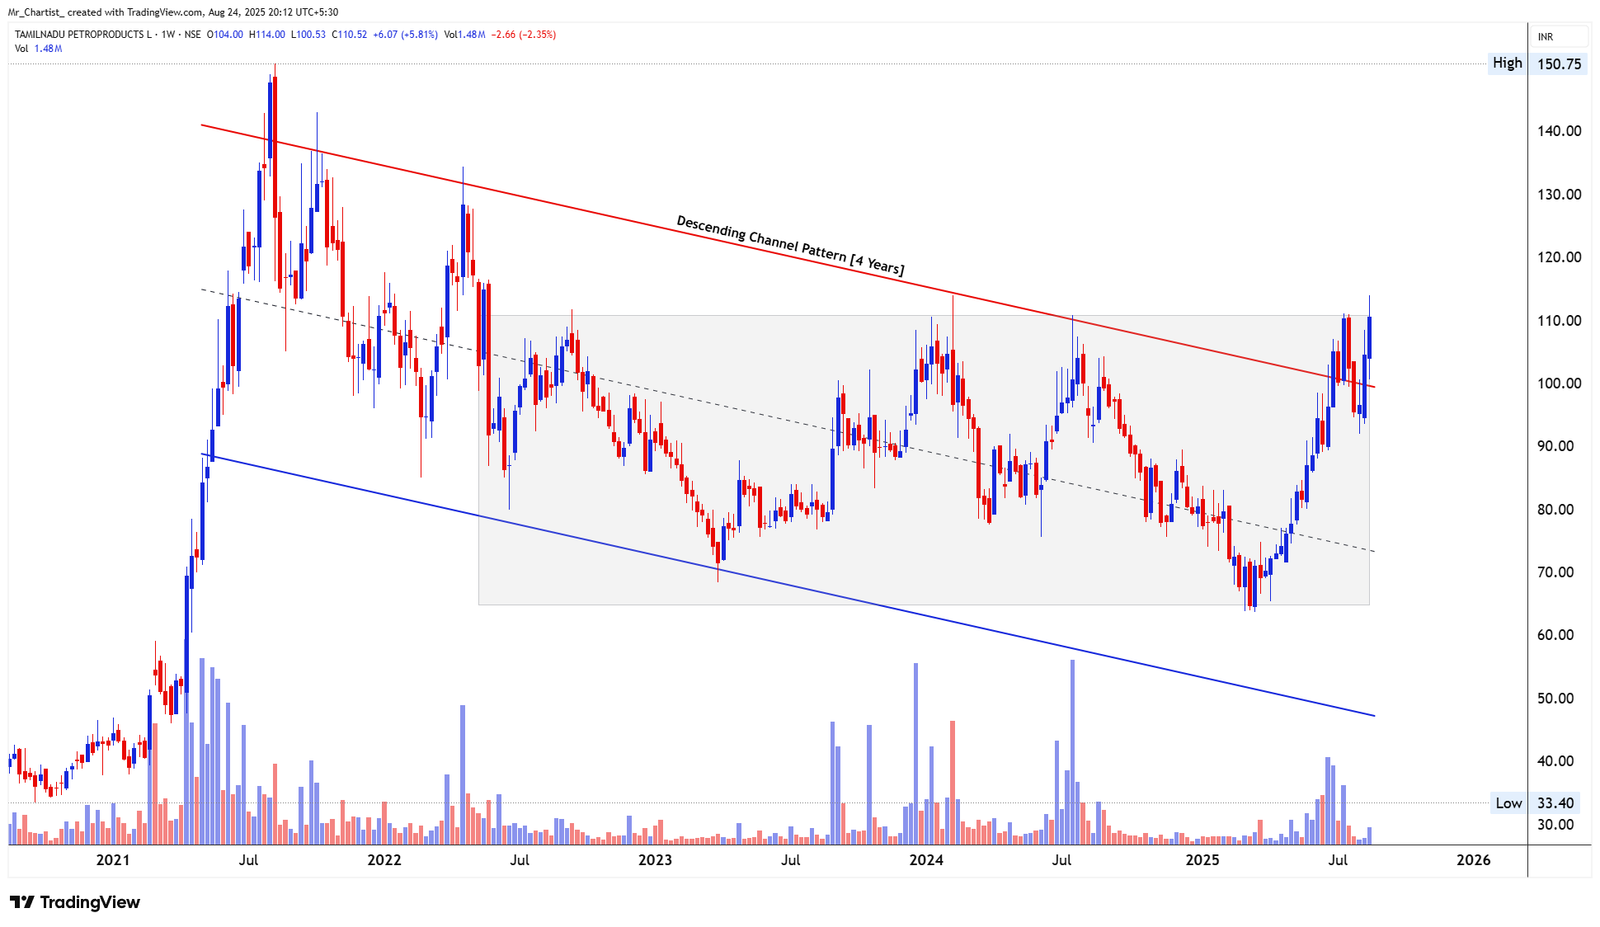
TAMILNADU PETROPRODUCTS LTD
bearish fnoDescending Channel Pattern
4 Years (Weekly Chart – Trend Reversal Setup in Progress)
Thesis & Analysis
Tamilnadu Petroproducts has been trading within a descending channel for the past 4 years, forming consistent lower highs and lower lows within well-defined boundaries. This prolonged corrective structure has shaped a classic falling channel, often considered a bullish reversal pattern when broken to the upside. Recently, the stock has broken out above the upper boundary of the channel, marked by a red trendline around ₹105–₹108. This is a major structural development and the first decisive breakout since the pattern began in 2021. The breakout was confirmed by a strong bullish candle, although the current weekly candle shows a mild pullback—common in retest scenarios. This development could mark a potential trend shift from downtrend to uptrend, especially if price sustains above the breakout zone in coming weeks. Candlestick Behavior: The breakout candle was large and bullish with a close above long-term resistance. Current week shows a pullback candle, likely part of a retest. Higher lows and impulsive rallies post-June 2025 suggest improving momentum. Volume Analysis: Volume has been rising steadily since the June low—an early accumulation signal. Breakout week had above-average volume, validating breakout strength. Pullback volume remains moderate, suggesting it's more of a retest than a reversal. 2. Crucial Support and Resistance Levels Support Zones: ₹105–₹108 – Previous channel resistance, now acting as crucial support. ₹92–₹95 – Intermediate pivot from recent consolidation. ₹70 – Multi-touch base of the channel, long-term demand zone. Resistance Zones: ₹120 – Minor horizontal resistance and prior rejection zone. ₹132–₹135 – Major resistance from mid-2022 swing highs. ₹150+ – Long-term target if the breakout sustains and uptrend accelerates.
Price Action
- ■Price action is structurally positive.
- ■Forming higher highs and higher lows.
Volume Profile
- ■Volume is supportive of the price action.
- ■Wait for volume expansion on breakout.
Key Levels
No zones specified
No zones specified
Invalidation Scenario
A weekly close below the support level invalidates this structure.
Chart Image Not Extracted
TAMILNADU PETROPRODUCTS LTD
bearish fnoDouble Bottom Breakout
Daily Chart
Thesis & Analysis
No detailed thesis provided for this setup.
Price Action
- ■Price action is structurally positive.
- ■Forming higher highs and higher lows.
Volume Profile
- ■Volume is supportive of the price action.
- ■Wait for volume expansion on breakout.
Key Levels
No zones specified
No zones specified
Invalidation Scenario
A weekly close below the support level invalidates this structure.
APLAB Ltd
bearish fnoDouble Bottom Breakout
Daily Chart
Thesis & Analysis
No detailed thesis provided for this setup.
Price Action
- ■Price action is structurally positive.
- ■Forming higher highs and higher lows.
Volume Profile
- ■Volume is supportive of the price action.
- ■Wait for volume expansion on breakout.
Key Levels
No zones specified
No zones specified
Invalidation Scenario
A weekly close below the support level invalidates this structure.
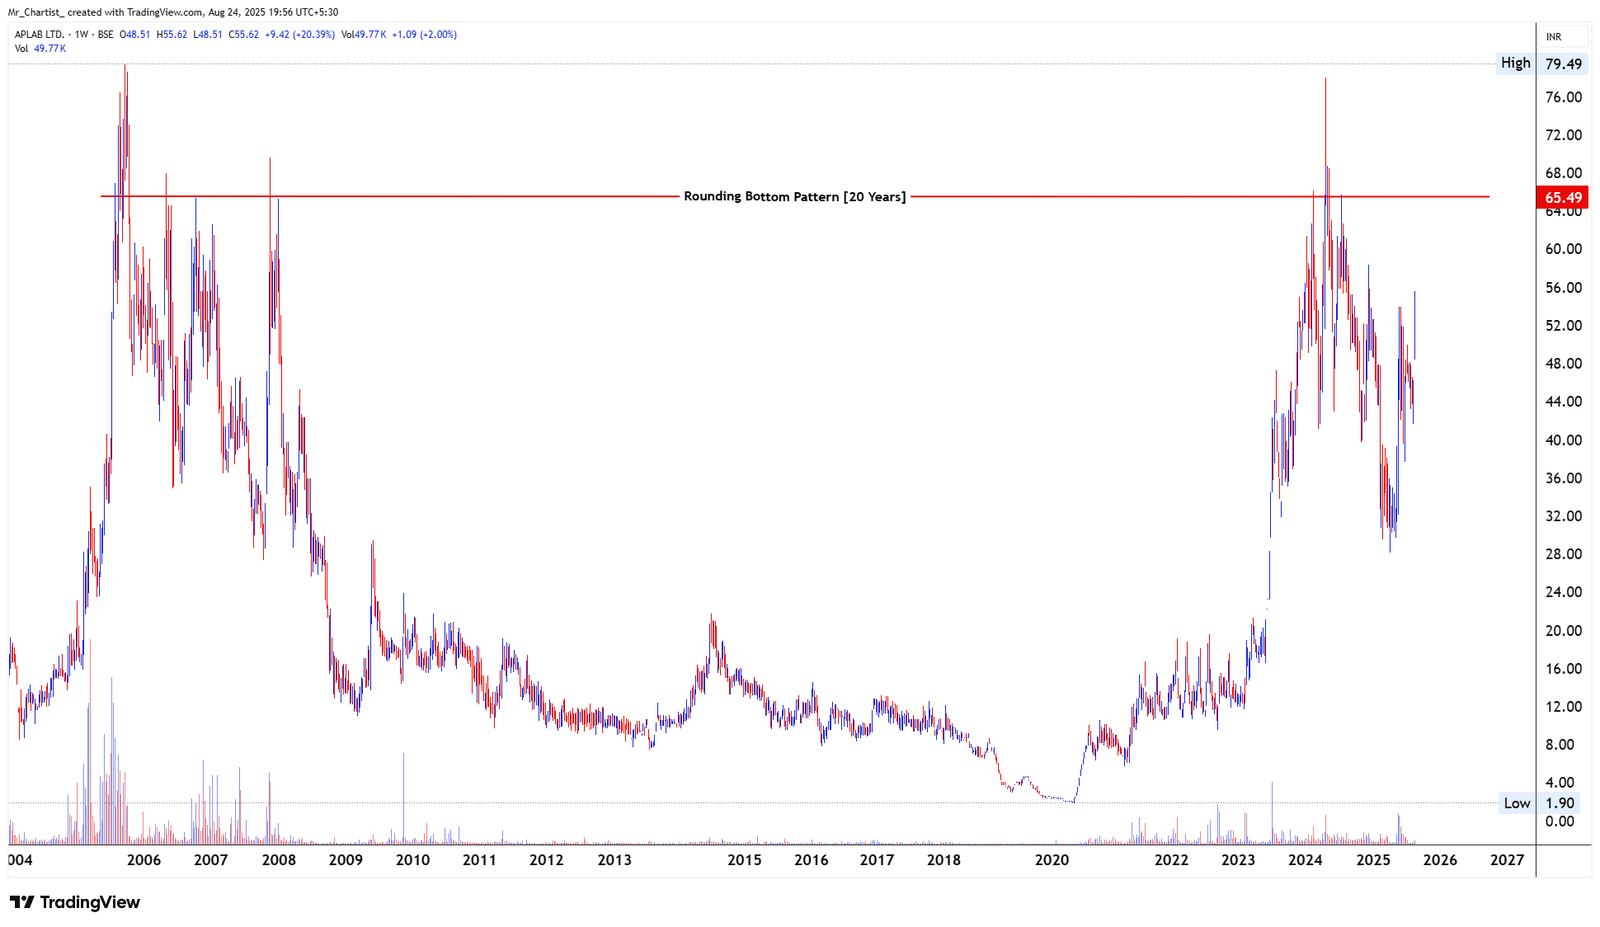
APLAB LTD
bearish fnoRounding Bottom Pattern
20 Years (Weekly Chart – Multi-Decade Base Formation)
Thesis & Analysis
APLAB Ltd is forming a massive rounding bottom pattern that has taken shape over the last two decades. This is one of the most significant long-term bottoming patterns visible on the broader BSE universe, spanning from the highs of 2005 to the recent basing and surge post-2023. After years of decline and consolidation, the stock finally started moving higher from 2022 onward, indicating a potential structural reversal. The long-term neckline lies at ₹65.49, which has historically acted as both a support (2005– 2007) and resistance (2024). A breakout above this level could mark the completion of the rounding base and trigger a major long-term uptrend. The current move looks like a retest and coiling action below the neckline. Recent bullish price action with a strong 20% weekly move hints at reaccumulation before a potential breakout attempt. Candlestick Behavior: Bullish wide-range candle seen this week off the ₹45 support area. Prior weeks showed lower wicks and inside bars, signaling demand. ₹65.49 remains the clear breakout barrier, with price compressing below it. Volume Analysis: Rising volume trend post-2023 indicates growing interest and accumulation. Volume surges correspond to impulsive legs; current spike is aligned with price. No panic volumes on declines—a bullish sign that distribution is minimal. 2. Crucial Support and Resistance Levels Support Zones: ₹45.00 – Recent bounce zone and minor demand area. ₹36–₹38 – Key swing low from March 2025. ₹28.00 – Prior breakout zone and base of last upmove. Resistance Zones: ₹65.49 – Decades-long neckline; breakout confirmation level. ₹72.00–₹76.00 – Spike rejection zone from 2024 highs. ₹85.00+ – Measured breakout target zone post pattern completion
Price Action
- ■Price action is structurally positive.
- ■Forming higher highs and higher lows.
Volume Profile
- ■Volume is supportive of the price action.
- ■Wait for volume expansion on breakout.
Key Levels
No zones specified
No zones specified
Invalidation Scenario
A weekly close below the support level invalidates this structure.
APLAB LTD
bearish fnoDouble Bottom Breakout
Daily Chart
Thesis & Analysis
No detailed thesis provided for this setup.
Price Action
- ■Price action is structurally positive.
- ■Forming higher highs and higher lows.
Volume Profile
- ■Volume is supportive of the price action.
- ■Wait for volume expansion on breakout.
Key Levels
No zones specified
No zones specified
Invalidation Scenario
A weekly close below the support level invalidates this structure.
Austin Engineering Co. Ltd
bearish fnoDouble Bottom Breakout
Daily Chart
Thesis & Analysis
No detailed thesis provided for this setup.
Price Action
- ■Price action is structurally positive.
- ■Forming higher highs and higher lows.
Volume Profile
- ■Volume is supportive of the price action.
- ■Wait for volume expansion on breakout.
Key Levels
No zones specified
No zones specified
Invalidation Scenario
A weekly close below the support level invalidates this structure.
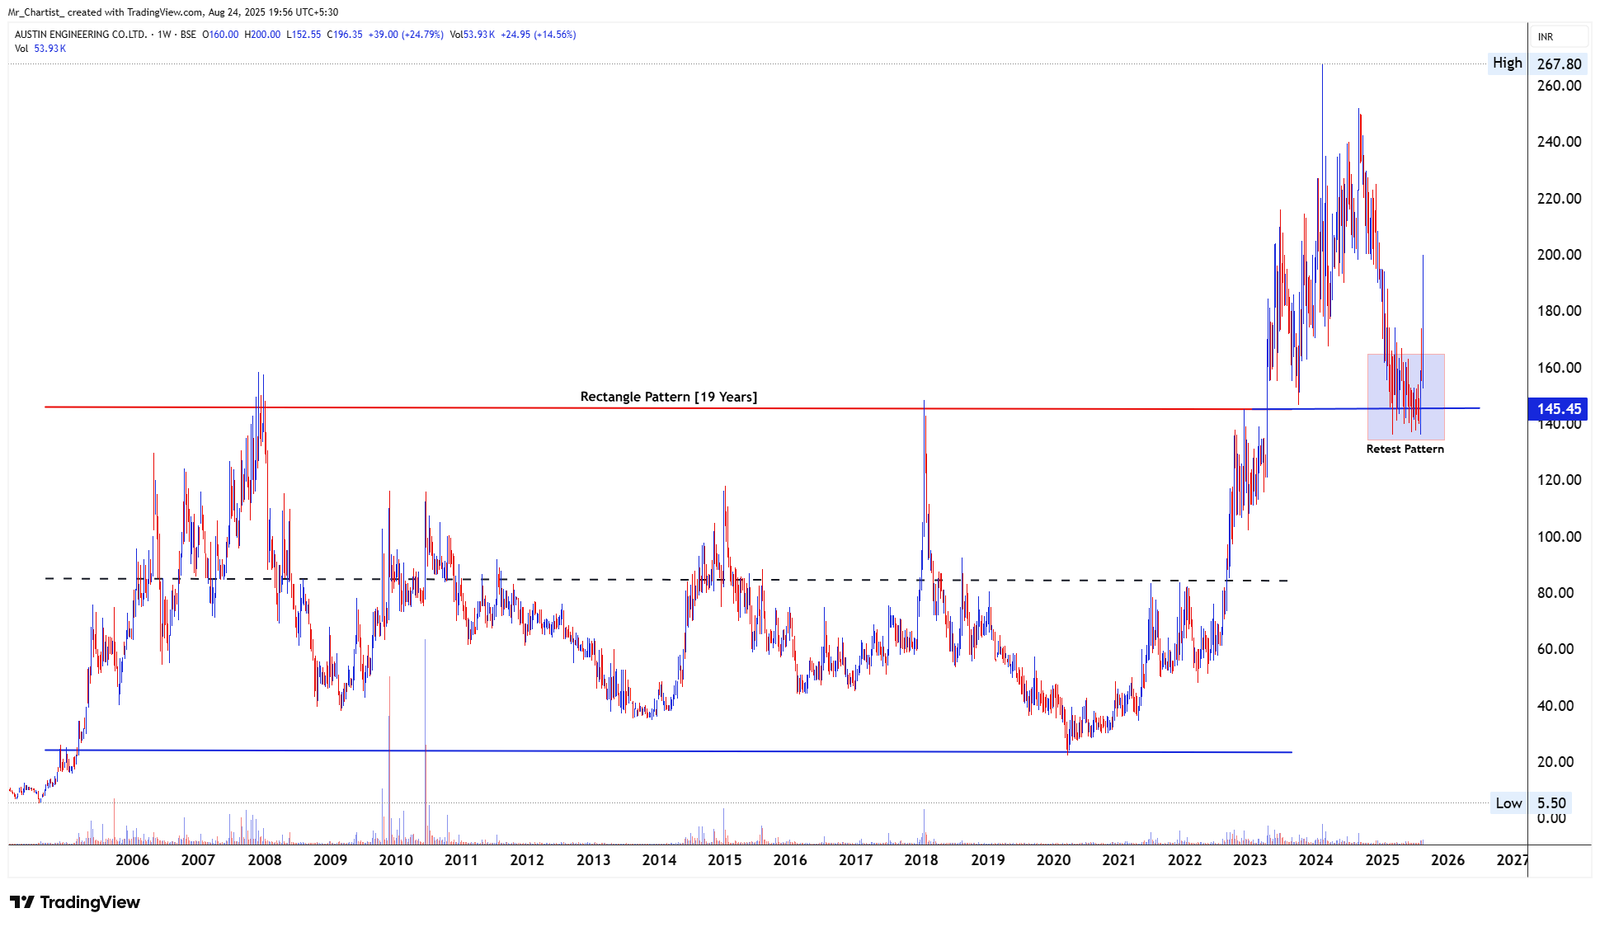
AUSTIN ENGINEERING CO. LTD
bearish fnoRectangle Pattern with Retest
19 Years (Weekly Chart – Breakout Retest Phase)
Thesis & Analysis
Austin Engineering has recently completed a breakout from a 19-year Rectangle Pattern, marking one of the most significant structural shifts in its history. The rectangle was formed between ₹145.45 (upper resistance) and a long-standing base near ₹25, creating a wide consolidation zone from 2005 to 2023. The breakout above ₹145.45 occurred in 2024 with strong price momentum, but after hitting highs of ₹267.80, the price has retraced back to retest the breakout zone —a classic retest formation. Price is now hovering just around the former resistance turned support at ₹145.45, validating this level as a structural pivot. Despite the sharp drop this week, the larger structure remains intact, as long as the price holds above the ₹145 support region. This retest offers an opportunity for reaccumulation before the next leg higher—provided the level holds. Candlestick Behavior: Recent candles show a volatile retest box between ₹145 and ₹160. Long wicks and wide-body bearish candles indicate selling pressure but also demand at lower ends. The zone is acting as a fight ground between buyers defending the breakout and short-term sellers booking gains. Volume Analysis: Volume expanded meaningfully during the initial breakout in 2023–2024. The current decline is accompanied by lower volume, hinting at a lack of distribution. Volume spikes during up moves have historically marked impulsive rallies— watch for similar activity on reclaiming ₹170+. 2. Crucial Support and Resistance Levels Support Zones: ₹145.45 – Key retest level and former breakout zone; critical for trend continuation. ₹125.00–₹130.00 – Swing low zone inside the retest box; deeper support. ₹100.00 – Breakdown invalidation level; below this, the long-term structure weakens. Resistance Zones: ₹175.00–₹180.00 – Near-term ceiling within the current range. ₹200.00 – Psychological resistance and failed breakout level from this week. ₹267.80 – All-time high and pattern breakout target level.
Price Action
- ■Price action is structurally positive.
- ■Forming higher highs and higher lows.
Volume Profile
- ■Volume is supportive of the price action.
- ■Wait for volume expansion on breakout.
Key Levels
No zones specified
No zones specified
Invalidation Scenario
A weekly close below the support level invalidates this structure.
AUSTIN ENGINEERING CO. LTD
bearish fnoDouble Bottom Breakout
Daily Chart
Thesis & Analysis
No detailed thesis provided for this setup.
Price Action
- ■Price action is structurally positive.
- ■Forming higher highs and higher lows.
Volume Profile
- ■Volume is supportive of the price action.
- ■Wait for volume expansion on breakout.
Key Levels
No zones specified
No zones specified
Invalidation Scenario
A weekly close below the support level invalidates this structure.
Bhakti Gems & Jewellery Ltd
bearish fnoDouble Bottom Breakout
Daily Chart
Thesis & Analysis
No detailed thesis provided for this setup.
Price Action
- ■Price action is structurally positive.
- ■Forming higher highs and higher lows.
Volume Profile
- ■Volume is supportive of the price action.
- ■Wait for volume expansion on breakout.
Key Levels
No zones specified
No zones specified
Invalidation Scenario
A weekly close below the support level invalidates this structure.
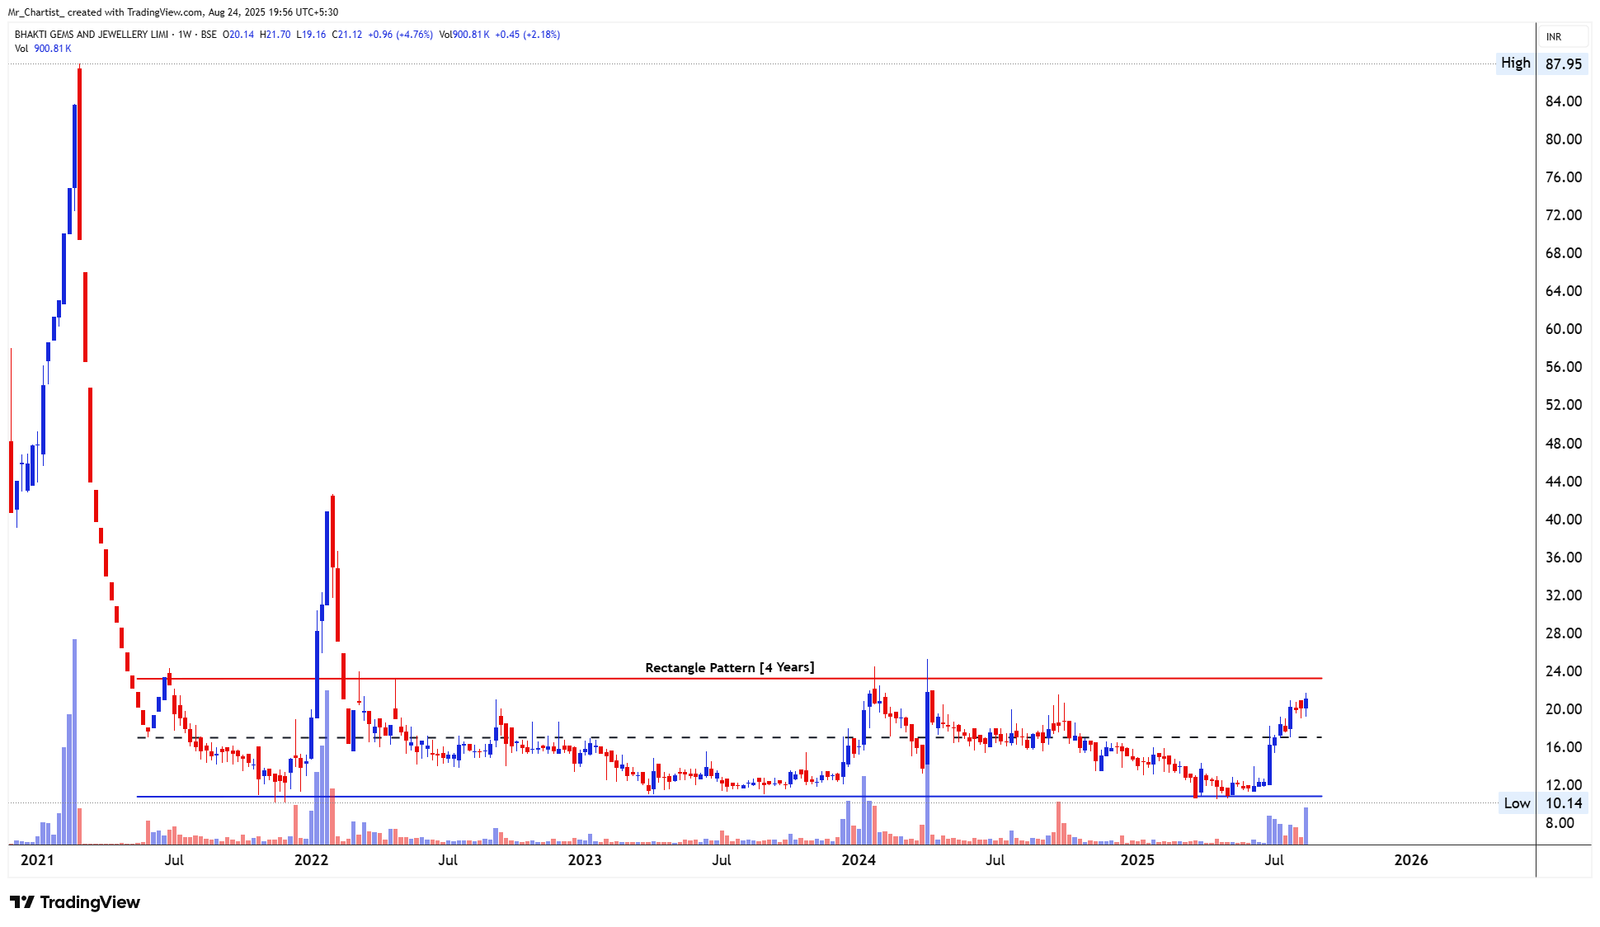
BHAKTI GEMS & JEWELLERY LTD
bearish fnoRectangle Pattern
4 Years (Weekly Chart – Nearing Breakout)
Thesis & Analysis
Bhakti Gems & Jewellery Ltd is currently trading at the upper resistance boundary of a well-defined rectangle pattern that has spanned over 4 years, ranging between ₹12 (support) and ₹25 (resistance). The price has remained largely range-bound since 2021, forming a prolonged base—suggesting long-term accumulation. The stock recently showed strong momentum off the lower support zone near ₹15, rallying swiftly toward the resistance line at ₹25. This type of behavior—low volatility followed by a sharp impulse—is often a precursor to breakout attempts. The structure is approaching an inflection point, and a weekly close above ₹25 would confirm a multi-year breakout, potentially leading to a significant price discovery phase. Candlestick Behavior: Recent candles show strong bullish bodies with minimal wicks—indicative of sustained demand. A cluster of candles near ₹21–₹22 suggests pause before breakout. There’s no sign of rejection yet from the ₹25 resistance, keeping breakout hopes alive. Volume Analysis: Volume has notably picked up during the recent up move—marking strong participation. Prior consolidations saw thin volumes—implying limited distribution. A breakout backed by volume expansion would validate breakout strength and conviction. 2. Crucial Support and Resistance Levels Support Zones: ₹19.50–₹20.00 – Minor support from recent breakout of range midpoint. ₹16.00 – Launchpad zone from which the current rally began. ₹12.00 – Major base and bottom of the rectangle pattern. Resistance Zones: ₹25.00 – Multi-year resistance; breakout level. ₹28.00–₹30.00 – Likely post-breakout supply zone from prior spikes. ₹35.00+ – Pattern target zone if breakout sustains and momentum continues.
Price Action
- ■Price action is structurally positive.
- ■Forming higher highs and higher lows.
Volume Profile
- ■Volume is supportive of the price action.
- ■Wait for volume expansion on breakout.
Key Levels
No zones specified
No zones specified
Invalidation Scenario
A weekly close below the support level invalidates this structure.
BHAKTI GEMS & JEWELLERY LTD
bearish fnoDouble Bottom Breakout
Daily Chart
Thesis & Analysis
No detailed thesis provided for this setup.
Price Action
- ■Price action is structurally positive.
- ■Forming higher highs and higher lows.
Volume Profile
- ■Volume is supportive of the price action.
- ■Wait for volume expansion on breakout.
Key Levels
No zones specified
No zones specified
Invalidation Scenario
A weekly close below the support level invalidates this structure.
Bhatia Communications & Retail Ltd
bearish fnoDouble Bottom Breakout
Daily Chart
Thesis & Analysis
No detailed thesis provided for this setup.
Price Action
- ■Price action is structurally positive.
- ■Forming higher highs and higher lows.
Volume Profile
- ■Volume is supportive of the price action.
- ■Wait for volume expansion on breakout.
Key Levels
No zones specified
No zones specified
Invalidation Scenario
A weekly close below the support level invalidates this structure.
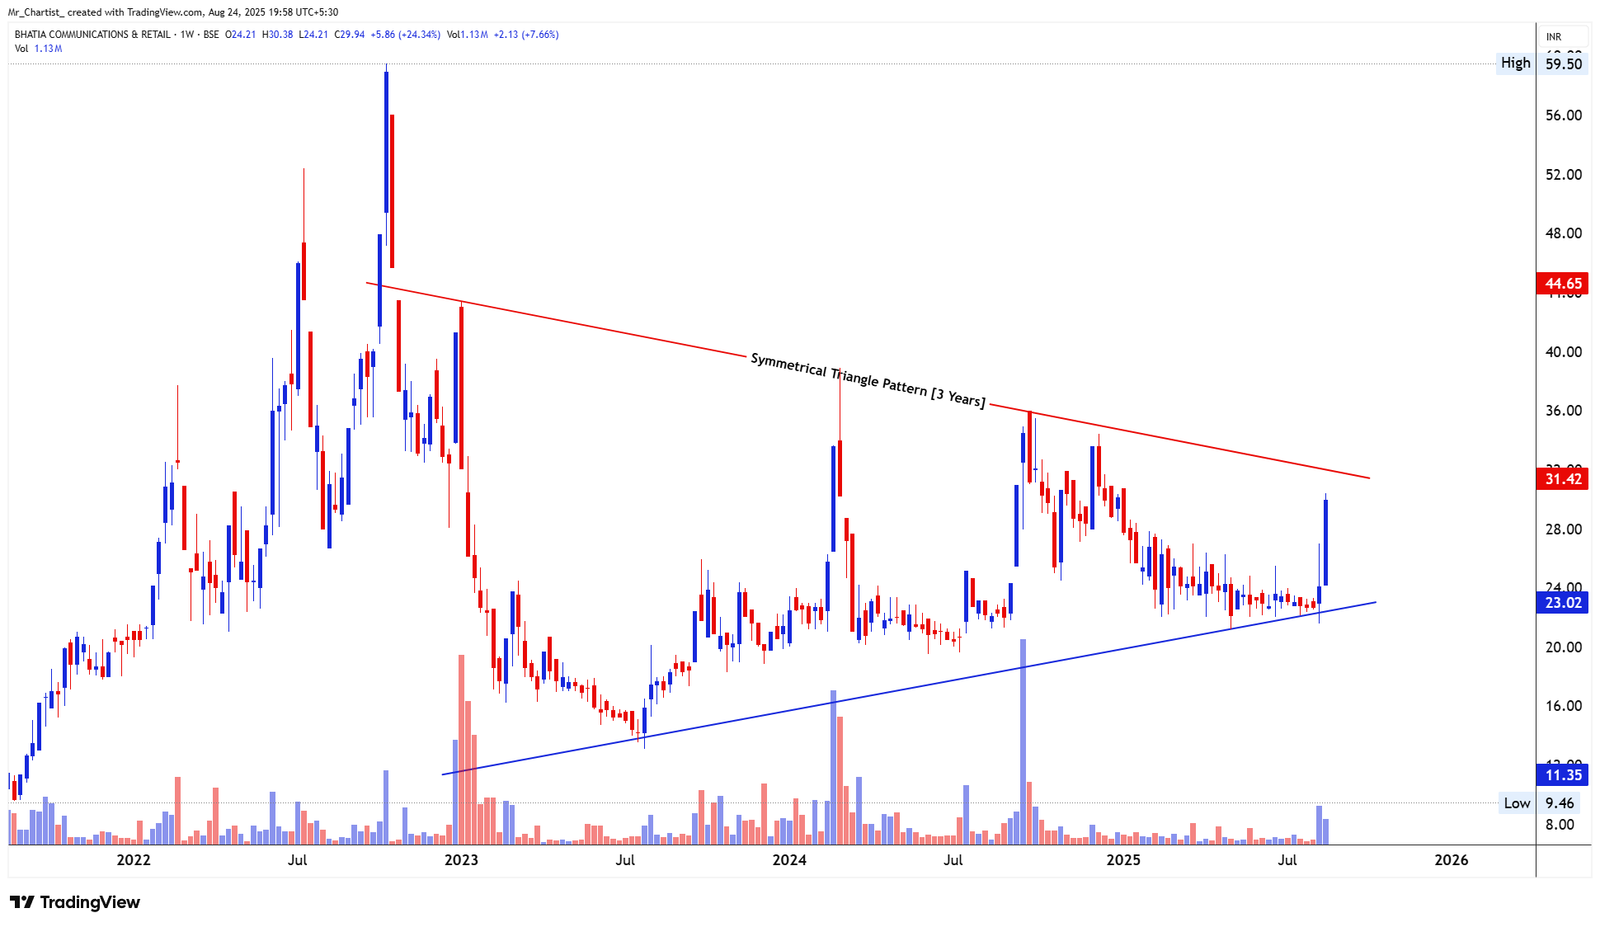
BHATIA COMMUNICATIONS & RETAIL LTD
bearish fnoSymmetrical Triangle Pattern
3 Years (Weekly Chart – Compressed Structure)
Thesis & Analysis
Bhatia Communications has formed a symmetrical triangle pattern spanning across 3 years, a structure defined by lower highs and higher lows, indicating progressive compression and price contraction. This pattern reflects long-term equilibrium between buyers and sellers, and suggests that a major breakout or breakdown may be imminent. Currently, the price is approaching the upper descending trendline resistance near ₹31.50. A strong bullish candle this week has pushed it higher by over 24%, supported by a significant volume spike, hinting at renewed bullish interest near the apex of the triangle. This confluence of price expansion + nearing resistance makes it a high-alert setup for a possible breakout. Candlestick Behavior: This week’s candle has a large real body and small upper wick—clear buying dominance. The pattern shows diminishing selling pressure since 2023. Strong support has held around ₹23.00–₹24.00 multiple times, forming a solid base. Volume Analysis: Sharp volume surge on the recent breakout attempt suggests accumulation transitioning into momentum. Prior triangle phases were marked by low volume—typical of this pattern type. Sustained volume above ₹31.50 would confirm bullish breakout conviction. 2. Crucial Support and Resistance Levels Support Zones: ₹23.00–₹24.00 – Base support and ascending trendline; strong demand zone. ₹20.00 – Historical cluster and fallback support. ₹11.35 – Long-term support and pattern invalidation point. Resistance Zones: ₹31.50 – Triangle resistance and breakout trigger. ₹35.00–₹36.00 – Historical congestion zone. ₹44.00–₹45.00 – Pre-pattern breakdown supply zone.
Price Action
- ■Price action is structurally positive.
- ■Forming higher highs and higher lows.
Volume Profile
- ■Volume is supportive of the price action.
- ■Wait for volume expansion on breakout.
Key Levels
No zones specified
No zones specified
Invalidation Scenario
A weekly close below the support level invalidates this structure.
BHATIA COMMUNICATIONS & RETAIL LTD
bearish fnoDouble Bottom Breakout
Daily Chart
Thesis & Analysis
No detailed thesis provided for this setup.
Price Action
- ■Price action is structurally positive.
- ■Forming higher highs and higher lows.
Volume Profile
- ■Volume is supportive of the price action.
- ■Wait for volume expansion on breakout.
Key Levels
No zones specified
No zones specified
Invalidation Scenario
A weekly close below the support level invalidates this structure.
CL Educate Ltd
bearish fnoDouble Bottom Breakout
Daily Chart
Thesis & Analysis
No detailed thesis provided for this setup.
Price Action
- ■Price action is structurally positive.
- ■Forming higher highs and higher lows.
Volume Profile
- ■Volume is supportive of the price action.
- ■Wait for volume expansion on breakout.
Key Levels
No zones specified
No zones specified
Invalidation Scenario
A weekly close below the support level invalidates this structure.
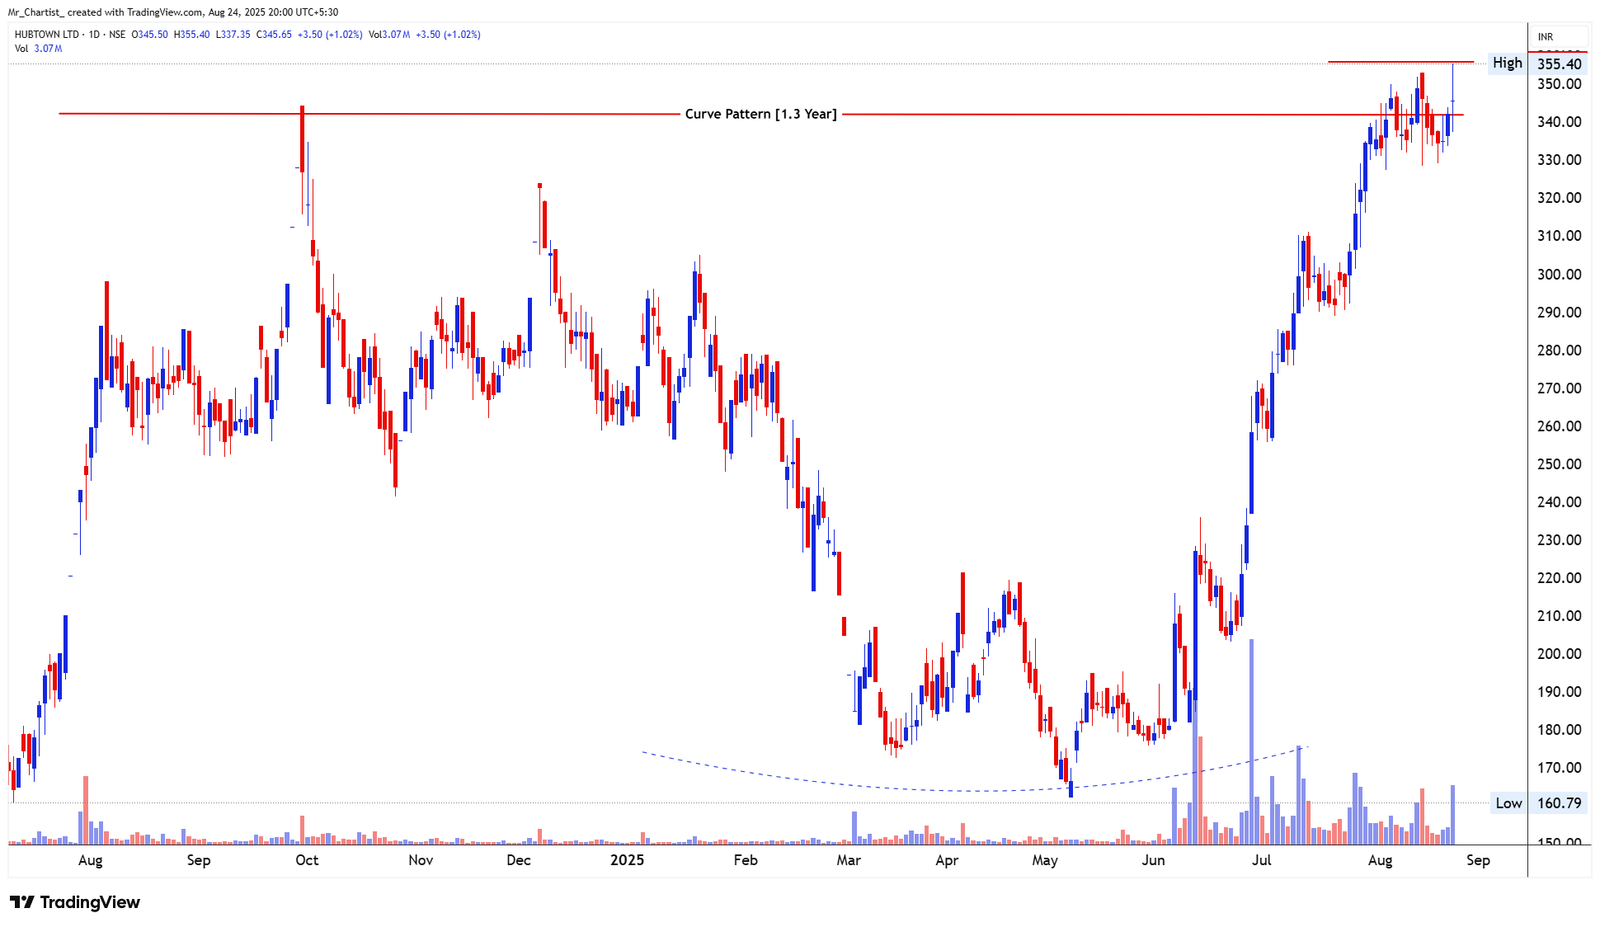
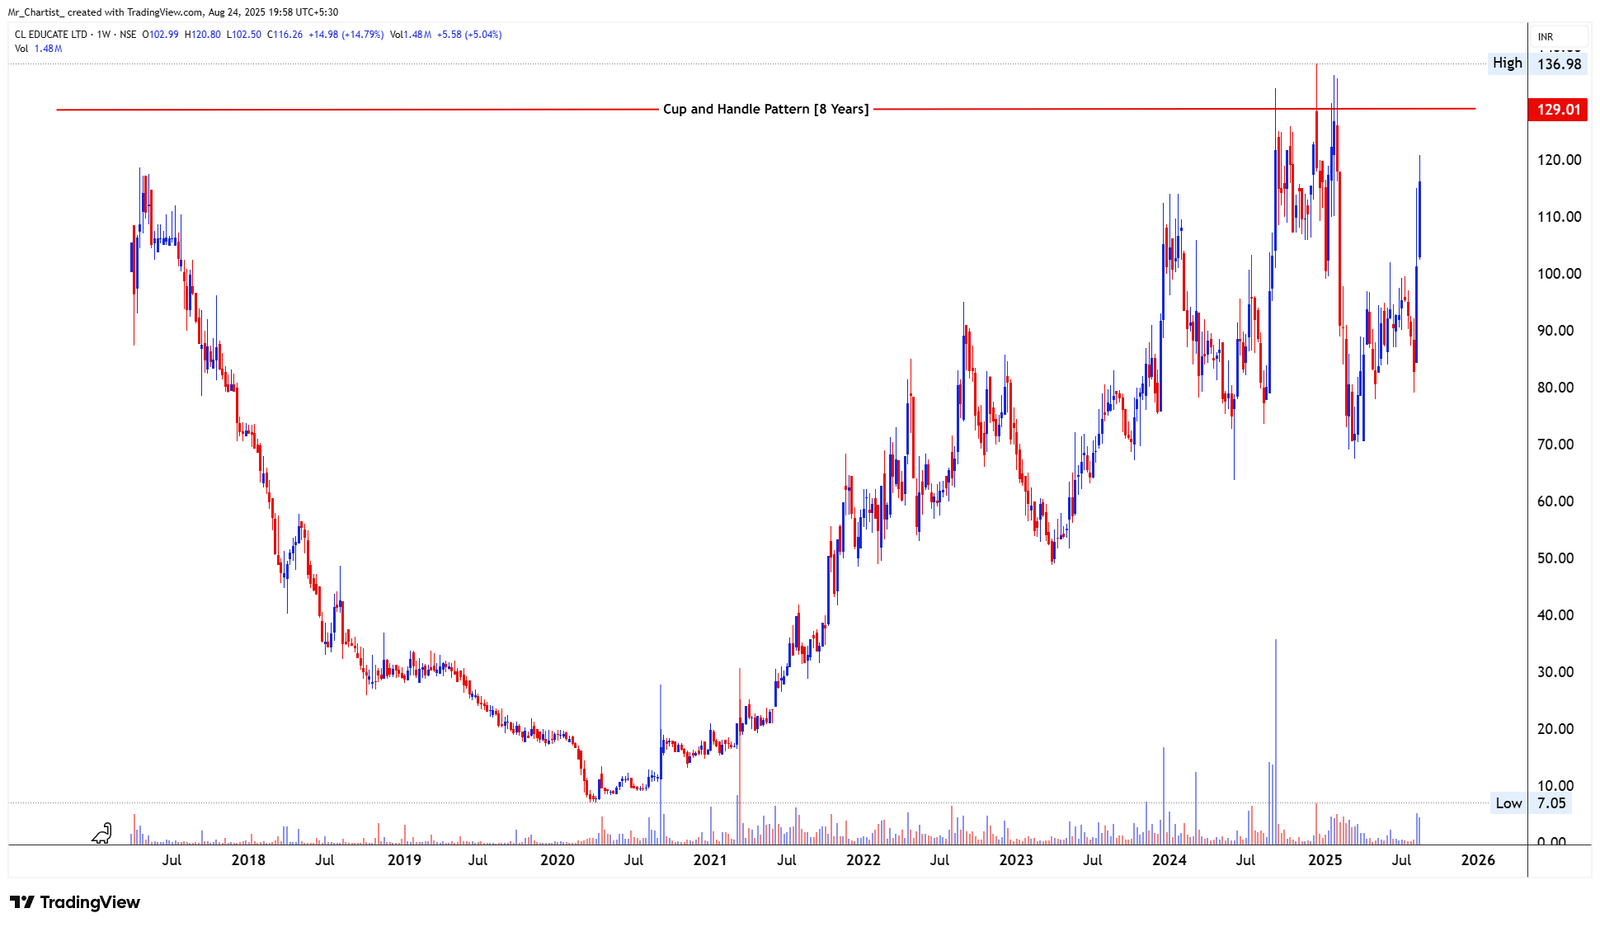
CL EDUCATE LTD
bearish fnoCup and Handle Pattern
8 Years (Weekly Chart – Long-term Base Formation)
Thesis & Analysis
CL Educate Ltd has formed a classic Cup and Handle pattern over the last 8 years, signaling a massive accumulation base. The rounded “cup” base formed from 2017 to 2023, followed by a volatile handle over the past year and a half. The breakout level stands at ₹129, which aligns with multiple past rejection points. The current price action shows a strong candle this week with a 14.79% gain, hinting that buyers are preparing for a potential breakout attempt. This structure is typically bullish, especially when emerging from long-term downtrends and multi-year consolidation, as it reflects a shift in institutional sentiment and long-term positioning. Candlestick Behavior: This week’s bullish engulfing candle with good volume reflects buy-side dominance. Past attempts to break ₹129 were rejected, forming the “handle” of the pattern. Higher lows within the handle suggest improving momentum and accumulation. Volume Analysis: Significant volume uptick in recent weeks points to smart money participation. Cup formation phase saw lower volumes, while the handle now shows gradual volume build-up, matching the ideal volume profile of this pattern. A breakout accompanied by >2M volume would validate pattern resolution. 2. Crucial Support and Resistance Levels Support Zones: ₹105–₹110 – Recent breakout attempt support; previous consolidation zone. ₹90 – Handle base and technical invalidation point. ₹60–₹70 – Long-term support and accumulation area. Resistance Zones: ₹129 – Cup and handle neckline; breakout trigger level. ₹137–₹140 – Historical resistance and previous spike highs. ₹160+ – Psychological and momentum continuation zone.
Price Action
- ■Price action is structurally positive.
- ■Forming higher highs and higher lows.
Volume Profile
- ■Volume is supportive of the price action.
- ■Wait for volume expansion on breakout.
Key Levels
No zones specified
No zones specified
Invalidation Scenario
A weekly close below the support level invalidates this structure.
CL EDUCATE LTD
bearish fnoDouble Bottom Breakout
Daily Chart
Thesis & Analysis
No detailed thesis provided for this setup.
Price Action
- ■Price action is structurally positive.
- ■Forming higher highs and higher lows.
Volume Profile
- ■Volume is supportive of the price action.
- ■Wait for volume expansion on breakout.
Key Levels
No zones specified
No zones specified
Invalidation Scenario
A weekly close below the support level invalidates this structure.
Dynemic Products Ltd
bearish fnoDouble Bottom Breakout
Daily Chart
Thesis & Analysis
No detailed thesis provided for this setup.
Price Action
- ■Price action is structurally positive.
- ■Forming higher highs and higher lows.
Volume Profile
- ■Volume is supportive of the price action.
- ■Wait for volume expansion on breakout.
Key Levels
No zones specified
No zones specified
Invalidation Scenario
A weekly close below the support level invalidates this structure.
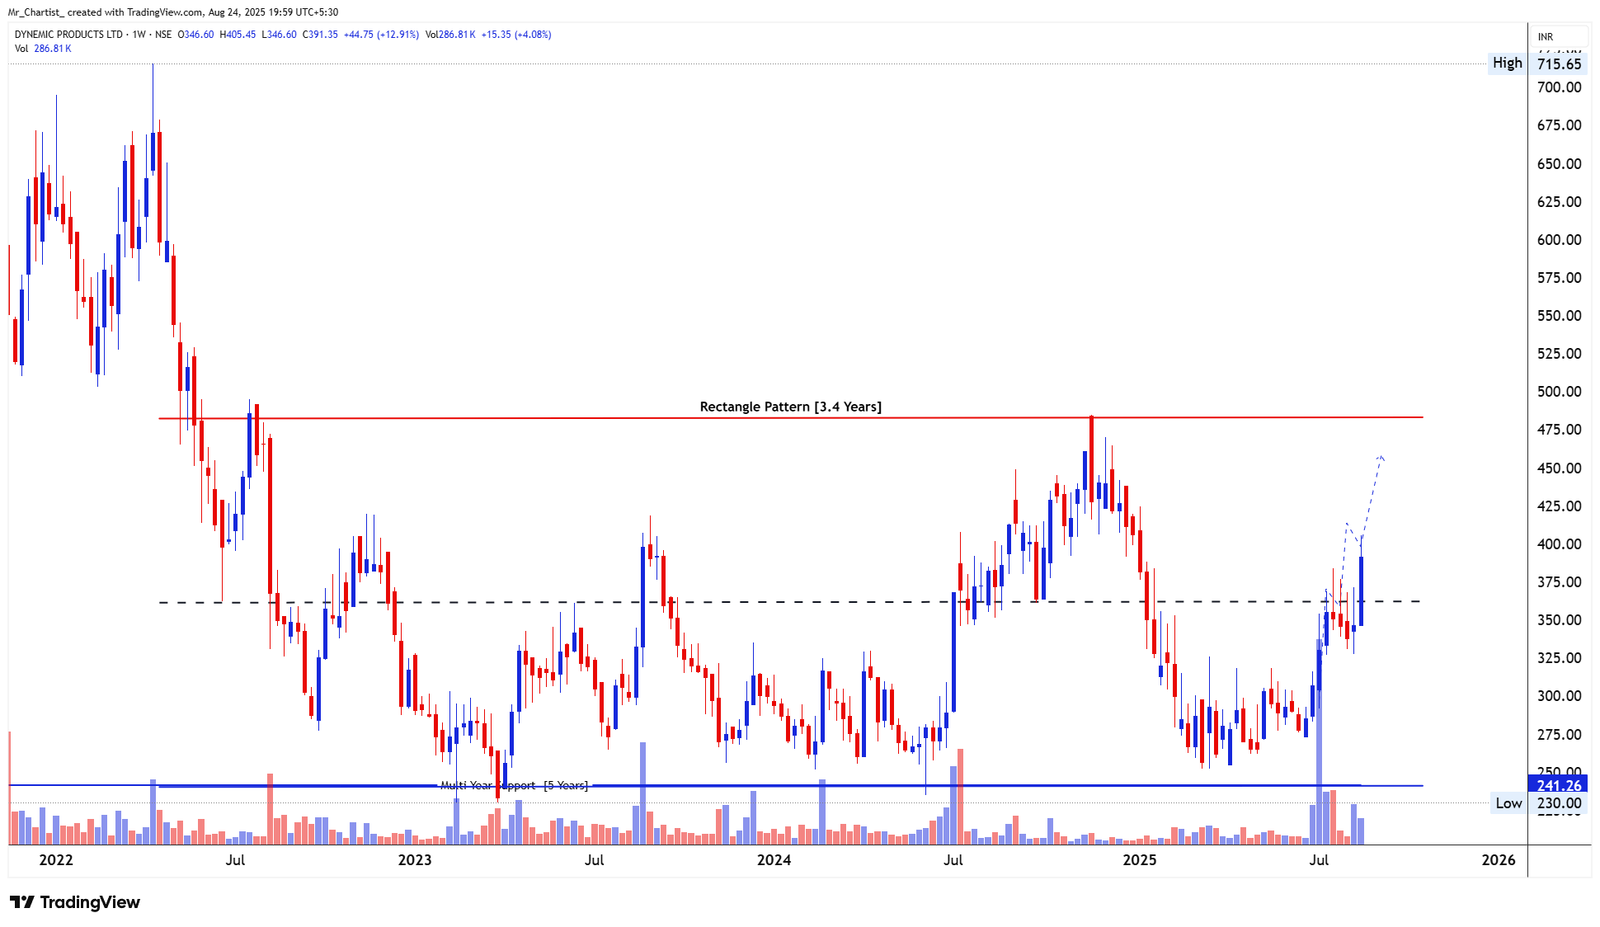
DYNEMIC PRODUCTS LTD
bearish fnoRectangle Pattern
3.4 Years (Weekly Chart – Broad Range Consolidation)
Thesis & Analysis
Dynemic Products Ltd has been trading in a well-defined rectangle range for the last 3.4 years, oscillating between ₹240–₹490 levels. This pattern reflects extended accumulation after a prior downtrend and can act as a launching base for the next leg up. The price has shown a strong revival from the multi-year support near ₹240–₹260 and is currently approaching the mid-range resistance zone near ₹400–₹420. If the stock builds momentum from here, the next test would be the rectangle breakout zone at ₹490. Importantly, a 5-year support zone around ₹240 held firmly during market-wide corrections, validating buyer interest at the lower band. Candlestick Behavior: Strong bullish candles over the past 3 weeks signal aggressive buying interest. Higher lows and tight-range consolidation prior to breakout indicate absorption of supply. The current price action has breached mid-zone resistance, and a small flag or consolidation here would be constructive. Volume Analysis: Massive volume expansion during the breakout from ₹330–₹350 zone, indicating institutional activity. Higher volume than average on recent bullish candles strengthens conviction. Volume spike near lows validates the accumulation thesis and potential reversal zone. 2. Crucial Support and Resistance Levels Support Zones: ₹350–₹370 – Current breakout retest zone and short-term base. ₹300–₹320 – Minor support and volume cluster. ₹240–₹260 – Major multi-year support, tested multiple times. Resistance Zones: ₹420 – Near-term resistance zone (mid-level of rectangle). ₹490 – Key breakout level of the 3.4-year rectangle. ₹550–₹575 – Post-breakout potential resistance based on prior supply.
Price Action
- ■Price action is structurally positive.
- ■Forming higher highs and higher lows.
Volume Profile
- ■Volume is supportive of the price action.
- ■Wait for volume expansion on breakout.
Key Levels
No zones specified
No zones specified
Invalidation Scenario
A weekly close below the support level invalidates this structure.
DYNEMIC PRODUCTS LTD
bearish fnoDouble Bottom Breakout
Daily Chart
Thesis & Analysis
No detailed thesis provided for this setup.
Price Action
- ■Price action is structurally positive.
- ■Forming higher highs and higher lows.
Volume Profile
- ■Volume is supportive of the price action.
- ■Wait for volume expansion on breakout.
Key Levels
No zones specified
No zones specified
Invalidation Scenario
A weekly close below the support level invalidates this structure.
Fredun Pharmaceuticals Ltd
bearish fnoDouble Bottom Breakout
Daily Chart
Thesis & Analysis
No detailed thesis provided for this setup.
Price Action
- ■Price action is structurally positive.
- ■Forming higher highs and higher lows.
Volume Profile
- ■Volume is supportive of the price action.
- ■Wait for volume expansion on breakout.
Key Levels
No zones specified
No zones specified
Invalidation Scenario
A weekly close below the support level invalidates this structure.
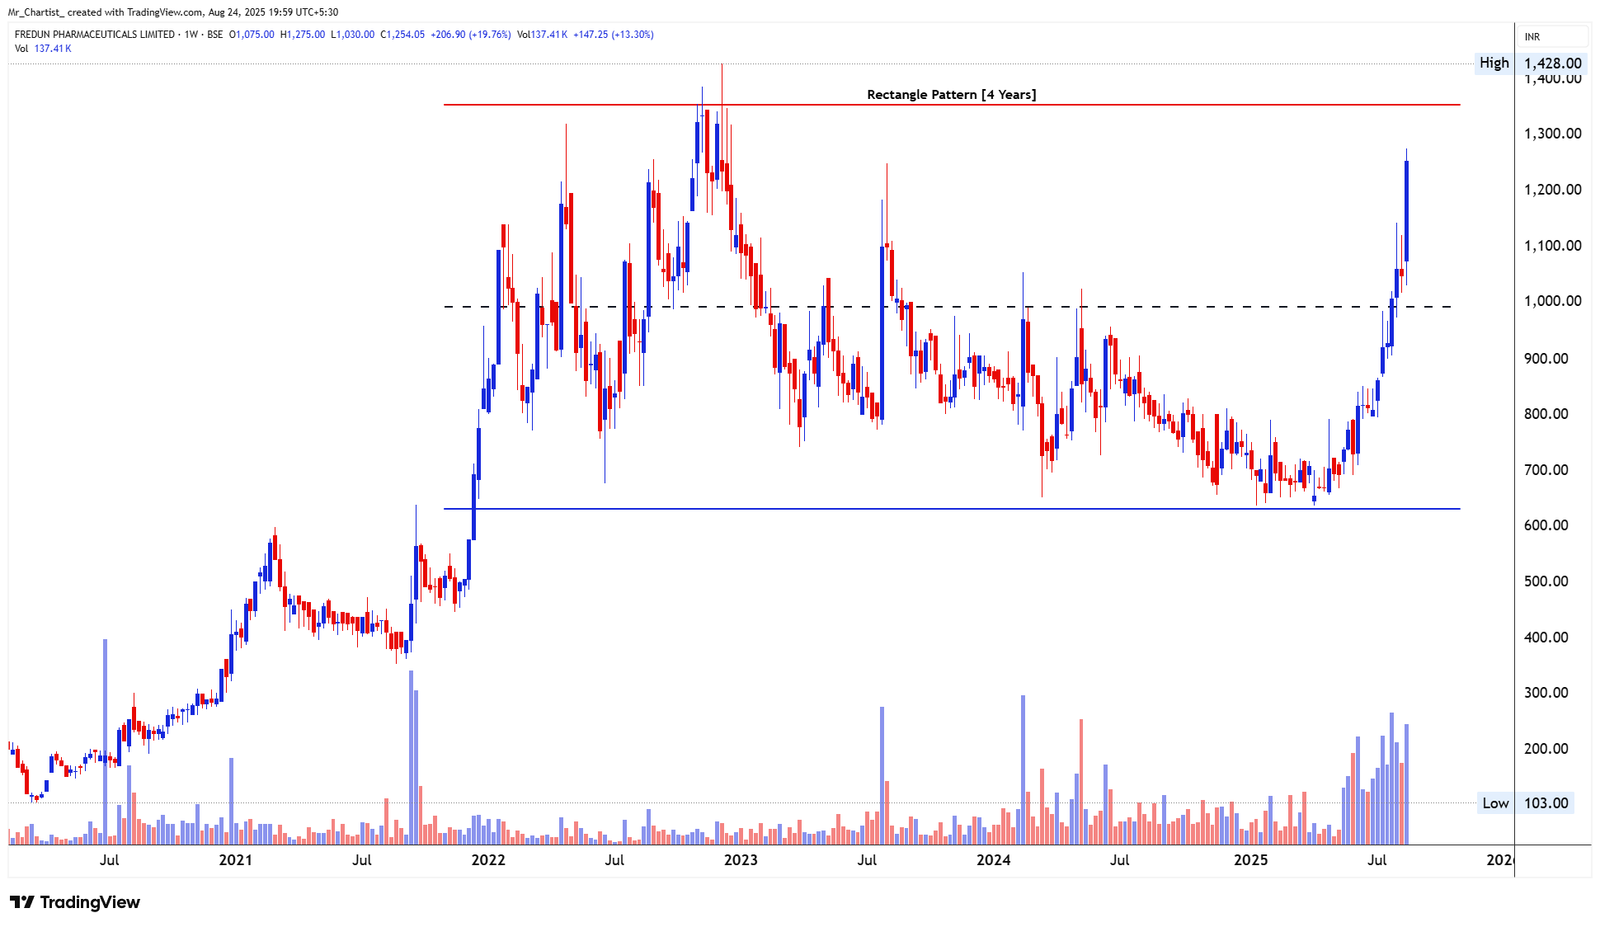
FREDUN PHARMACEUTICALS LTD
bearish fnoRectangle Pattern
4 Years (Weekly Chart – Long-Term Accumulation Base)
Thesis & Analysis
Fredun Pharmaceuticals Ltd has been forming a large rectangle pattern for over 4 years, with price oscillating between ₹620 (support) and ₹1,375 (resistance). This type of price behavior signals a sideways accumulation phase, where the stock digests previous gains and consolidates for a major breakout or breakdown. The recent price surge has taken the stock to the upper boundary of this range, testing the ₹1,375 resistance zone, which has historically acted as a supply ceiling. The strong upmove came with increased volume, indicating institutional participation and improving sentiment. The structure appears to be transitioning from accumulation to potential markup, with the stock building a classic U-shaped base within the rectangle, a precursor to breakouts in such setups. Candlestick Behavior: A series of bullish candles over recent weeks, especially the latest large candle, suggests strong momentum and follow-through buying. The consolidation seen during 2023–2024 near the mid-level (~₹950–₹1,000) acted as springboard for the recent breakout leg. The current bar is approaching prior rejection zones, so some consolidation or shakeout behavior can occur before a clean breakout. Volume Analysis: Volume has spiked significantly in the last few weeks, confirming accumulation turning into breakout interest. Sustained high volume while approaching resistance is a constructive signal. The volume trend is rising, and the recent breakout attempts are backed by credible participation. 2. Crucial Support and Resistance Levels Support Zones: ₹1,050–₹1,100 – Immediate demand zone on minor dips. ₹950 – Mid-rectangle pivot and volume cluster. ₹620–₹650 – Multi-year rectangle base support. Resistance Zones: ₹1,375–₹1,400 – Major rectangle breakout level. ₹1,500+ – Post-breakout potential measured target. ₹1,650 – Fib extension and longer-term supply zone.
Price Action
- ■Price action is structurally positive.
- ■Forming higher highs and higher lows.
Volume Profile
- ■Volume is supportive of the price action.
- ■Wait for volume expansion on breakout.
Key Levels
No zones specified
No zones specified
Invalidation Scenario
A weekly close below the support level invalidates this structure.
FREDUN PHARMACEUTICALS LTD
bearish fnoDouble Bottom Breakout
Daily Chart
Thesis & Analysis
No detailed thesis provided for this setup.
Price Action
- ■Price action is structurally positive.
- ■Forming higher highs and higher lows.
Volume Profile
- ■Volume is supportive of the price action.
- ■Wait for volume expansion on breakout.
Key Levels
No zones specified
No zones specified
Invalidation Scenario
A weekly close below the support level invalidates this structure.
Garnet Construction Ltd
bearish fnoDouble Bottom Breakout
Daily Chart
Thesis & Analysis
No detailed thesis provided for this setup.
Price Action
- ■Price action is structurally positive.
- ■Forming higher highs and higher lows.
Volume Profile
- ■Volume is supportive of the price action.
- ■Wait for volume expansion on breakout.
Key Levels
No zones specified
No zones specified
Invalidation Scenario
A weekly close below the support level invalidates this structure.
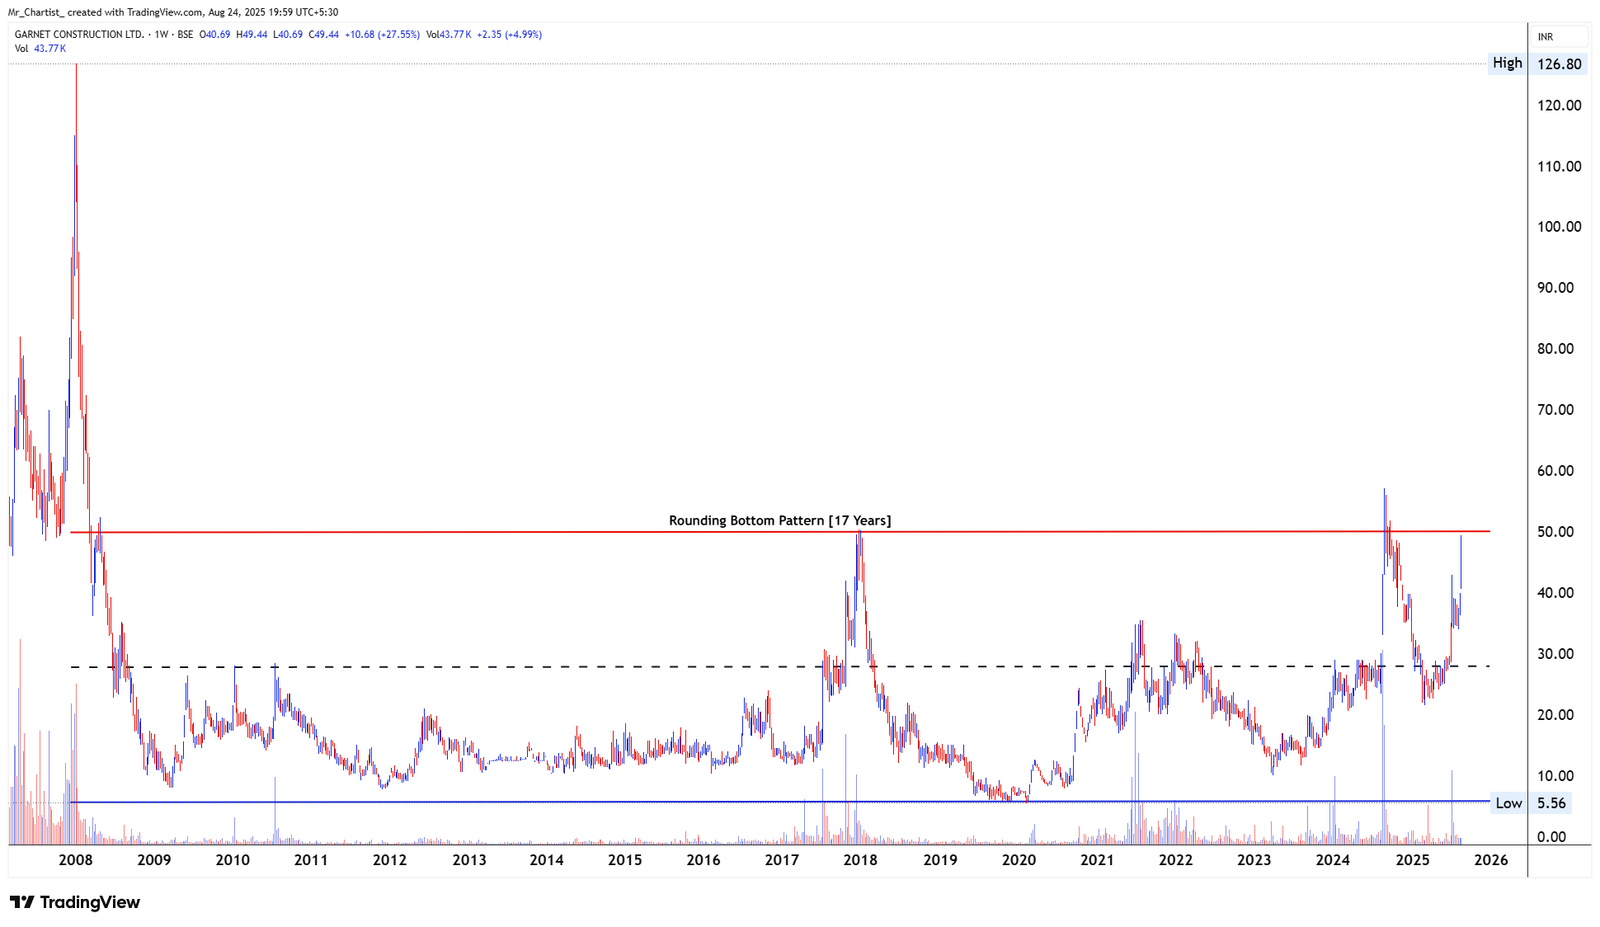
GARNET CONSTRUCTION LTD
bearish fnoRounding Bottom Pattern
17 Years (Weekly Chart – Long-Term Structural Bottom Formation)
Thesis & Analysis
Garnet Construction Ltd has formed a classic Rounding Bottom pattern spanning over 17 years. This is a powerful long-term reversal structure, indicating a slow transition from a prolonged downtrend (distribution and markdown phases) into accumulation and now the early signs of a markup phase. The stock bottomed out near ₹5.5 and remained range-bound for more than a decade. Price gradually formed a U-shaped curve, which signals smart money accumulation over time. The recent upward momentum has now brought the stock near the critical neckline/resistance zone around ₹52–₹55, marking the top of this pattern. This kind of long-term rounding bottom is rare and typically signifies a major secular reversal, especially if confirmed by a breakout on volume. Candlestick Behavior: A sequence of strong bullish candles has emerged since early 2025. Recent candles are long-bodied and supported by expanding volume, suggesting serious buying interest. Price action is approaching the neckline, where profit booking and mild volatility may occur before a clean breakout. Volume Analysis: Volume has seen a noticeable uptick in recent months, a key requirement in the final phase of rounding bottom breakouts. A consistent rise in volume during upward price movement confirms that institutional participation is likely. If volume continues to increase while approaching ₹52–₹55, a breakout becomes more probable and sustainable. 2. Crucial Support and Resistance Levels Support Zones: ₹38–₹40: Immediate support zone from the recent minor breakout base. ₹28–₹30: Mid-level support from prior consolidation during 2022–2023. ₹5.50: Long-term multi-year bottom and ultimate downside risk level. Resistance Zones: ₹52–₹55: Critical neckline of the 17-year rounding bottom — major breakout level. ₹70–₹75: Post-breakout target zone (based on measured move). i i l i f ld l
Price Action
- ■Price action is structurally positive.
- ■Forming higher highs and higher lows.
Volume Profile
- ■Volume is supportive of the price action.
- ■Wait for volume expansion on breakout.
Key Levels
No zones specified
No zones specified
Invalidation Scenario
A weekly close below the support level invalidates this structure.
GARNET CONSTRUCTION LTD
bearish fnoDouble Bottom Breakout
Daily Chart
Thesis & Analysis
No detailed thesis provided for this setup.
Price Action
- ■Price action is structurally positive.
- ■Forming higher highs and higher lows.
Volume Profile
- ■Volume is supportive of the price action.
- ■Wait for volume expansion on breakout.
Key Levels
No zones specified
No zones specified
Invalidation Scenario
A weekly close below the support level invalidates this structure.
Kaveri Defence & Wire Tech Ltd
bearish fnoDouble Bottom Breakout
Daily Chart
Thesis & Analysis
No detailed thesis provided for this setup.
Price Action
- ■Price action is structurally positive.
- ■Forming higher highs and higher lows.
Volume Profile
- ■Volume is supportive of the price action.
- ■Wait for volume expansion on breakout.
Key Levels
No zones specified
No zones specified
Invalidation Scenario
A weekly close below the support level invalidates this structure.
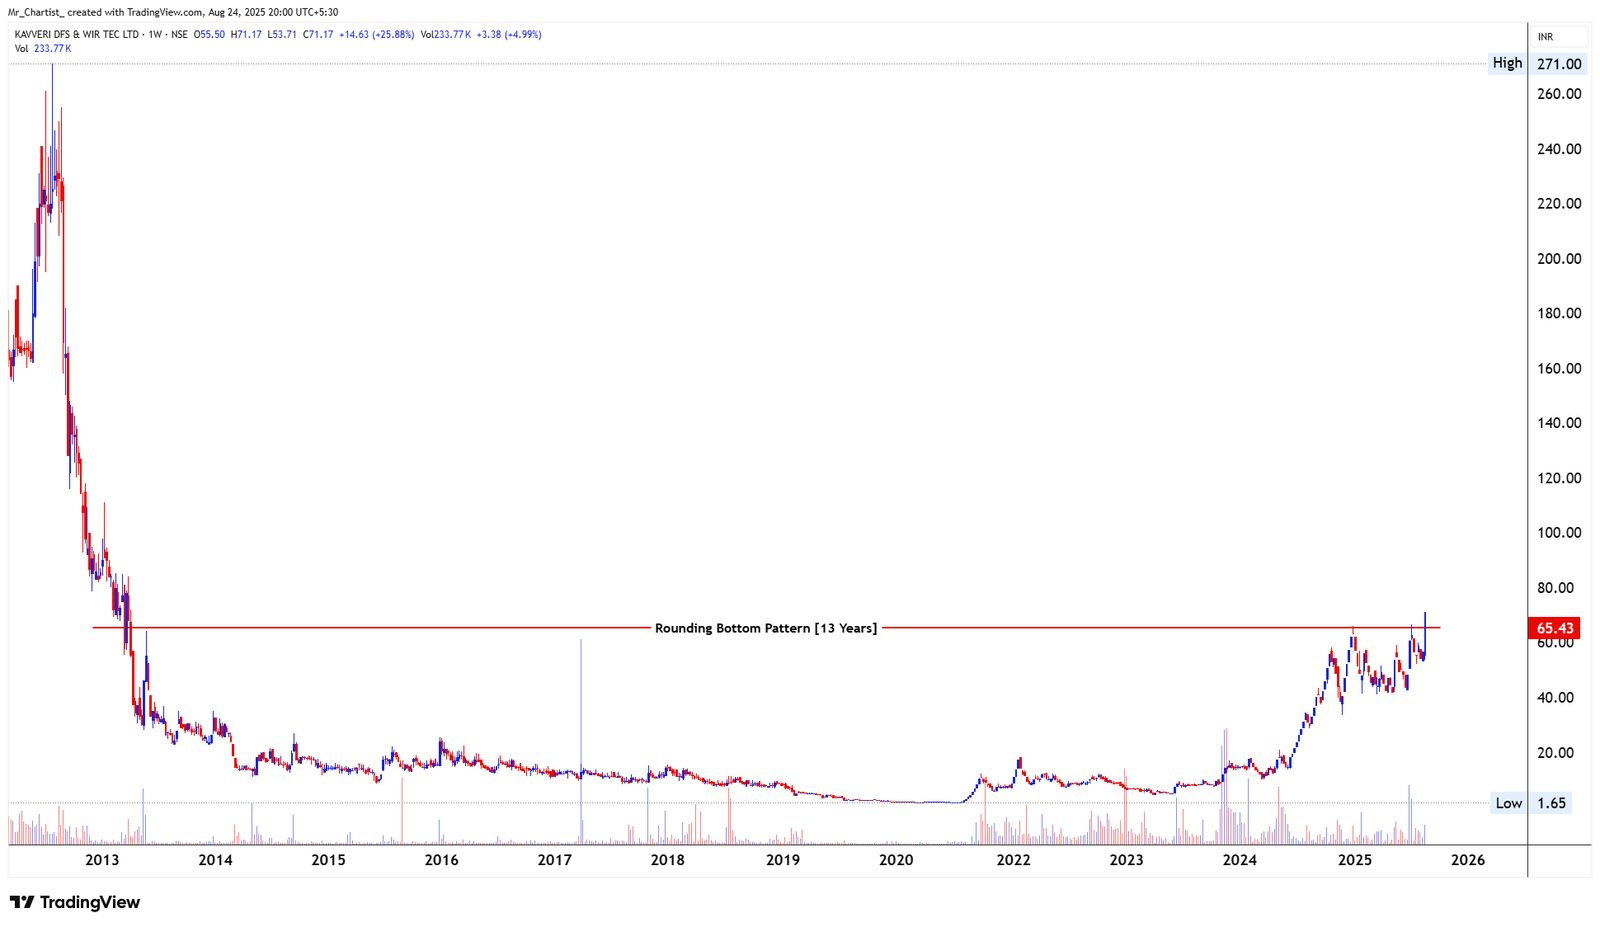
KAVERI DEFENCE & WIRE TECH LTD
bearish fnoRounding Bottom Pattern
13 Years (Weekly Chart – Long-Term Bottom Reversal)
Thesis & Analysis
Kaveri Defence has been carving out a classic rounding bottom formation over a massive 13-year period — a highly significant structural base suggesting a secular reversal in trend. The pattern started forming around 2012 after a steep markdown phase from its 2012 highs near ₹270. The price then spent over a decade in a tight, low-volume base- building phase between ₹2 and ₹20. From 2023 onward, price started showing life with higher lows, breakouts on minor resistances, and increasing volume, forming a rounded curvature on the chart. In recent months, the stock has sharply moved higher to test the ₹65.43 neckline, which has served as a historical resistance for nearly a decade. The recent breakout attempt above this level marks a potential long-term breakout zone and opens the possibility of transitioning into a new markup cycle. Candlestick Behavior: A clear sequence of higher highs and higher lows emerged from early 2024. Recent bullish candles are long-bodied and supported by strong follow-through. The breakout above ₹65 was aggressive and is being followed by consolidation candles, which is constructive before further upside. Volume Analysis: Volume has dramatically increased during breakout attempts — a key confirmation of institutional interest. Volume in the latest breakout candle is among the highest in the last 5 years. Rising volume on upward price movement signals validity of the breakout and market conviction. 2. Crucial Support and Resistance Levels Support Zones: ₹62–₹65: Immediate breakout retest zone; previous neckline of the rounding bottom. ₹48–₹50: Secondary support and minor demand zone formed during the 2025 rally. ₹20–₹22: Historical accumulation band; breakdown below this would negate the structure. Resistance Zones: ₹85–₹90: Short-term resistance cluster from 2024 swing highs. ₹105–₹110: Psychological barrier and near-term price target post-breakout. ₹135–₹150: Longer-term extension and historical congestion zone; measured move potential.
Price Action
- ■Price action is structurally positive.
- ■Forming higher highs and higher lows.
Volume Profile
- ■Volume is supportive of the price action.
- ■Wait for volume expansion on breakout.
Key Levels
No zones specified
No zones specified
Invalidation Scenario
A weekly close below the support level invalidates this structure.
KAVERI DFS & WIR TEC LTD
bearish fnoDouble Bottom Breakout
Daily Chart
Thesis & Analysis
No detailed thesis provided for this setup.
Price Action
- ■Price action is structurally positive.
- ■Forming higher highs and higher lows.
Volume Profile
- ■Volume is supportive of the price action.
- ■Wait for volume expansion on breakout.
Key Levels
No zones specified
No zones specified
Invalidation Scenario
A weekly close below the support level invalidates this structure.
Lotus Eye Hospital & Institute Ltd
bearish fnoDouble Bottom Breakout
Daily Chart
Thesis & Analysis
No detailed thesis provided for this setup.
Price Action
- ■Price action is structurally positive.
- ■Forming higher highs and higher lows.
Volume Profile
- ■Volume is supportive of the price action.
- ■Wait for volume expansion on breakout.
Key Levels
No zones specified
No zones specified
Invalidation Scenario
A weekly close below the support level invalidates this structure.
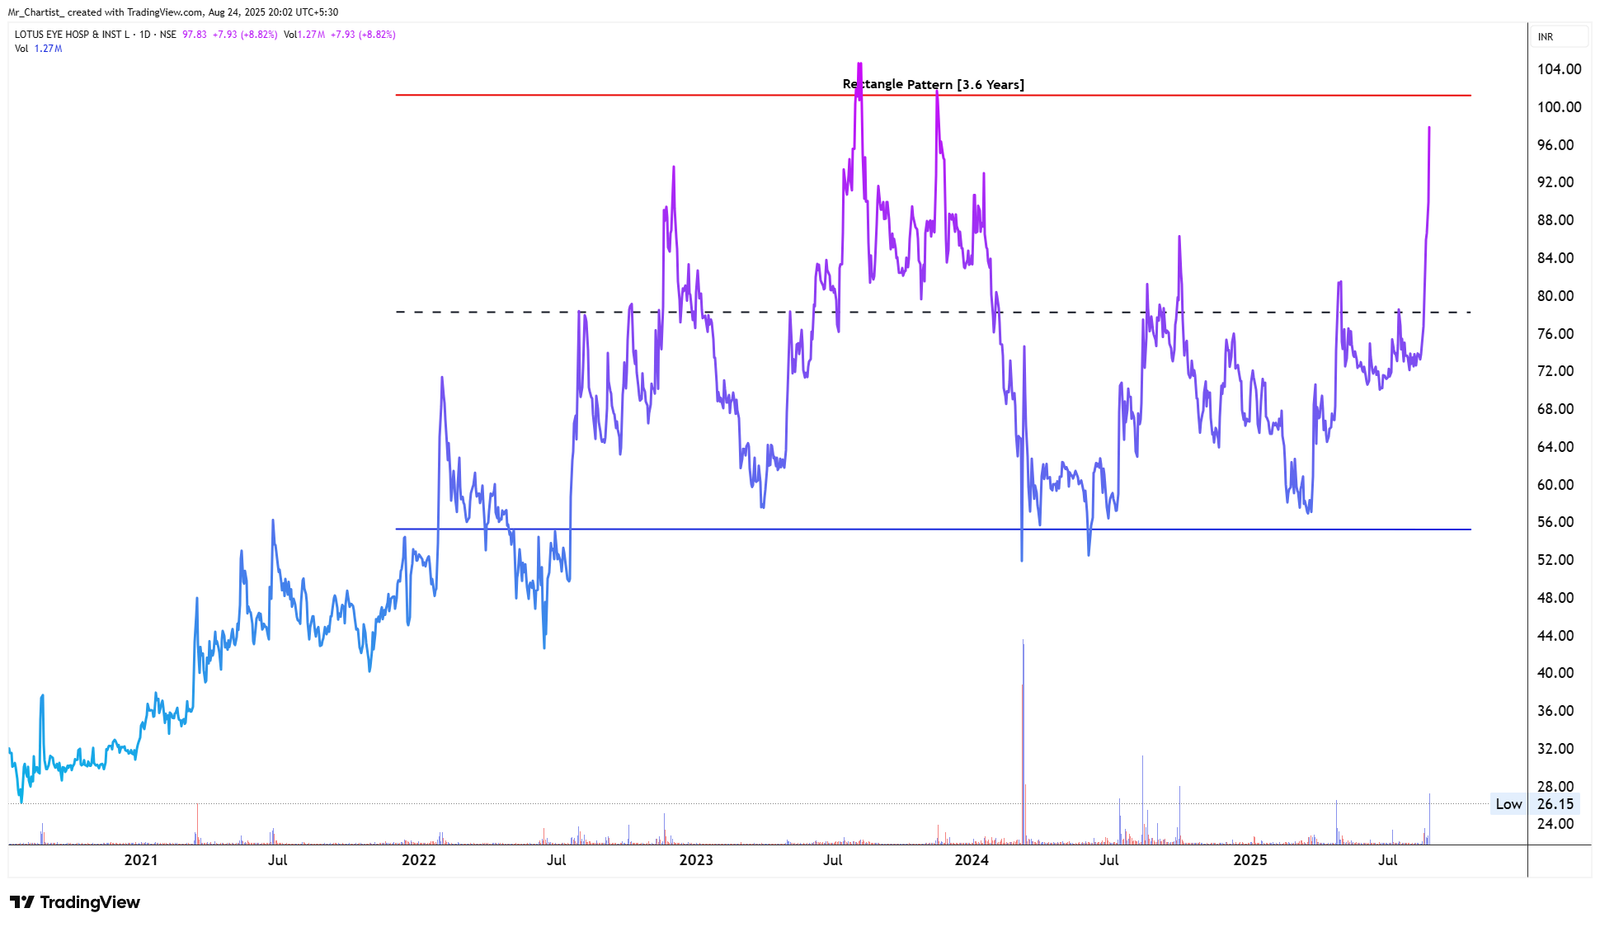
LOTUS EYE HOSPITAL & INSTITUTE LTD
bearish fnoRectangle Pattern
3.6 Years (Daily Chart – Medium-Term Consolidation Base)
Thesis & Analysis
Lotus Eye Hospital has been consolidating within a well-defined rectangle range for approximately 3.6 years, marked by support near ₹56 and resistance near ₹104. This rectangular setup reflects a long phase of accumulation and price compression, with buyers and sellers in equilibrium. Recent price action shows a sharp breakout attempt from the mid-range (₹75–₹80 zone) toward the upper resistance. This momentum-driven move, supported by a surge in volume, suggests the beginning of a breakout move or an attempt to challenge the multi- year ceiling. This pattern is further validated by the multiple clean touches on both support and resistance, confirming the strength and maturity of this rectangle. Price is now approaching a crucial inflection point. Candlestick Behavior: The latest price spike shows a strong bullish candle breaking out of a coiled structure near the ₹75 zone. Previous candles show a long base formation with multiple rejection wicks at lows, suggesting absorption of supply. Momentum has returned with back-to-back bullish candles post July 2025, showing early signs of trend expansion. Volume Analysis: Volume on the recent breakout move has exploded to multi-month highs, pointing to institutional interest. Volume during the accumulation phase remained flat, confirming the stock was under accumulation without too much noise. The volume surge + price breakout combo is a textbook bullish development in rectangle breakouts. 2. Crucial Support and Resistance Levels Support Zones: ₹75–₹80: Immediate support zone formed by mid-range consolidation and previous breakout level. ₹56: Strong historical support – lower end of the rectangle and multi-year demand zone. ₹48–₹50: Backup support in case of false breakout or shakeout; high-volume bar cluster zone. Resistance Zones: ₹103–₹104: Multi-year rectangle top and the next big breakout level. ₹120–₹125: Short-term price extension after rectangle breakout. ₹140+: Long term swing target derived from measured move of the pattern
Price Action
- ■Price action is structurally positive.
- ■Forming higher highs and higher lows.
Volume Profile
- ■Volume is supportive of the price action.
- ■Wait for volume expansion on breakout.
Key Levels
No zones specified
No zones specified
Invalidation Scenario
A weekly close below the support level invalidates this structure.
LOTUS EYE HOSPITAL & INSTITUTE LTD
bearish fnoDouble Bottom Breakout
Daily Chart
Thesis & Analysis
No detailed thesis provided for this setup.
Price Action
- ■Price action is structurally positive.
- ■Forming higher highs and higher lows.
Volume Profile
- ■Volume is supportive of the price action.
- ■Wait for volume expansion on breakout.
Key Levels
No zones specified
No zones specified
Invalidation Scenario
A weekly close below the support level invalidates this structure.
Munjal Auto Industries Ltd
bearish fnoDouble Bottom Breakout
Daily Chart
Thesis & Analysis
No detailed thesis provided for this setup.
Price Action
- ■Price action is structurally positive.
- ■Forming higher highs and higher lows.
Volume Profile
- ■Volume is supportive of the price action.
- ■Wait for volume expansion on breakout.
Key Levels
No zones specified
No zones specified
Invalidation Scenario
A weekly close below the support level invalidates this structure.
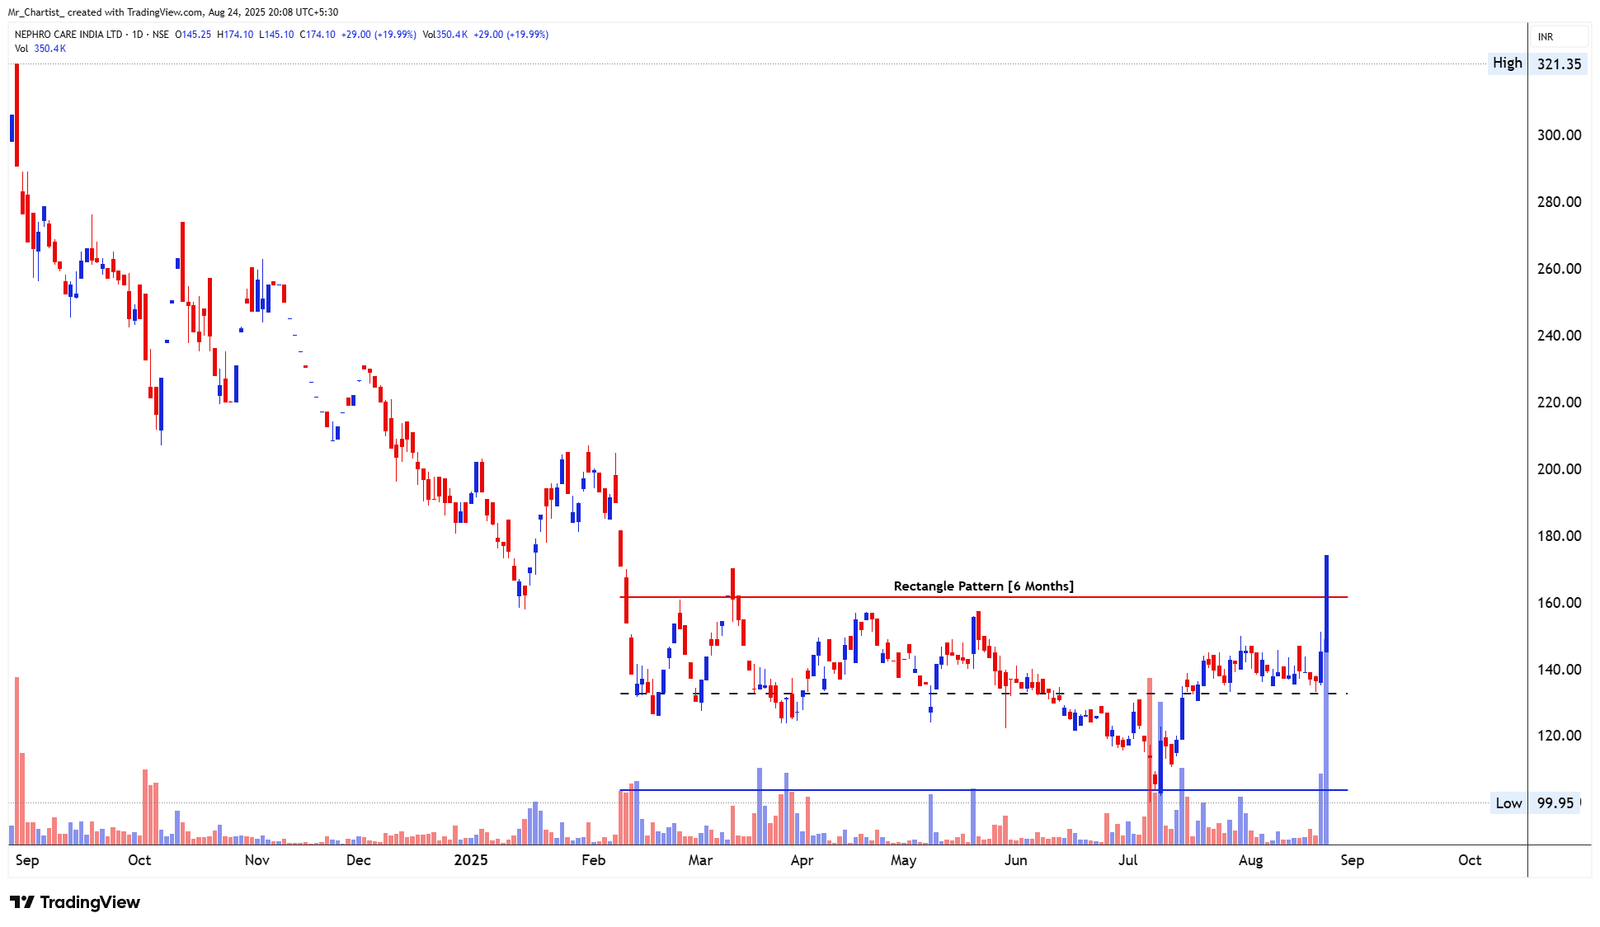
MUNJAL AUTO INDUSTRIES LTD
bearish fnoDouble Bottom Pattern
6 Months (Daily Chart – Short-Term Reversal Setup)
Thesis & Analysis
Munjal Auto has formed a classic double bottom pattern over the last 6 months, indicating a potential bullish reversal from a prolonged downtrend. The two troughs—formed around April and July 2025—rested near the ₹70 level, reflecting demand absorption around that zone. The neckline of this double bottom lies near ₹87, which the price is currently testing. The setup resembles a W-shaped reversal, where buyers are starting to overpower sellers after months of decline and sideways action. A breakout above the neckline (₹87) on strong volume would mark the completion of the pattern, signaling a trend reversal and beginning of a new up leg. Candlestick Behavior: The recent candles are strong bullish bars with large bodies and small wicks, showing follow-through buying. The second bottom (July 2025) was higher in volume and saw faster recovery, implying improving sentiment. A breakout candle above ₹87 would be a critical confirmation bar – ideally with a wide range and high close. Volume Analysis: Volume has increased noticeably in the recent upmove, confirming accumulation before breakout. Volume was relatively muted during the pattern formation, consistent with quiet accumulation phases. The most recent sessions show volume bars rising with price, a bullish validation. 2. Crucial Support and Resistance Levels Support Zones: ₹80–₹82: Immediate short-term support and previous minor resistance zone. ₹70–₹72: Double bottom base and major demand zone. ₹60: Multi-month support; critical invalidation level. Resistance Zones: ₹87: Pattern neckline and immediate breakout level. ₹95–₹98: Resistance zone from previous congestion in January 2025. ₹105–₹110: Post-breakout target zone, derived from pattern height (~₹15– ₹20 measured move).
Price Action
- ■Price action is structurally positive.
- ■Forming higher highs and higher lows.
Volume Profile
- ■Volume is supportive of the price action.
- ■Wait for volume expansion on breakout.
Key Levels
No zones specified
No zones specified
Invalidation Scenario
A weekly close below the support level invalidates this structure.
MUNJAL AUTO INDUSTRIES LTD
bearish fnoDouble Bottom Breakout
Daily Chart
Thesis & Analysis
No detailed thesis provided for this setup.
Price Action
- ■Price action is structurally positive.
- ■Forming higher highs and higher lows.
Volume Profile
- ■Volume is supportive of the price action.
- ■Wait for volume expansion on breakout.
Key Levels
No zones specified
No zones specified
Invalidation Scenario
A weekly close below the support level invalidates this structure.
Nephro Care India Ltd
bearish fnoDouble Bottom Breakout
Daily Chart
Thesis & Analysis
No detailed thesis provided for this setup.
Price Action
- ■Price action is structurally positive.
- ■Forming higher highs and higher lows.
Volume Profile
- ■Volume is supportive of the price action.
- ■Wait for volume expansion on breakout.
Key Levels
No zones specified
No zones specified
Invalidation Scenario
A weekly close below the support level invalidates this structure.
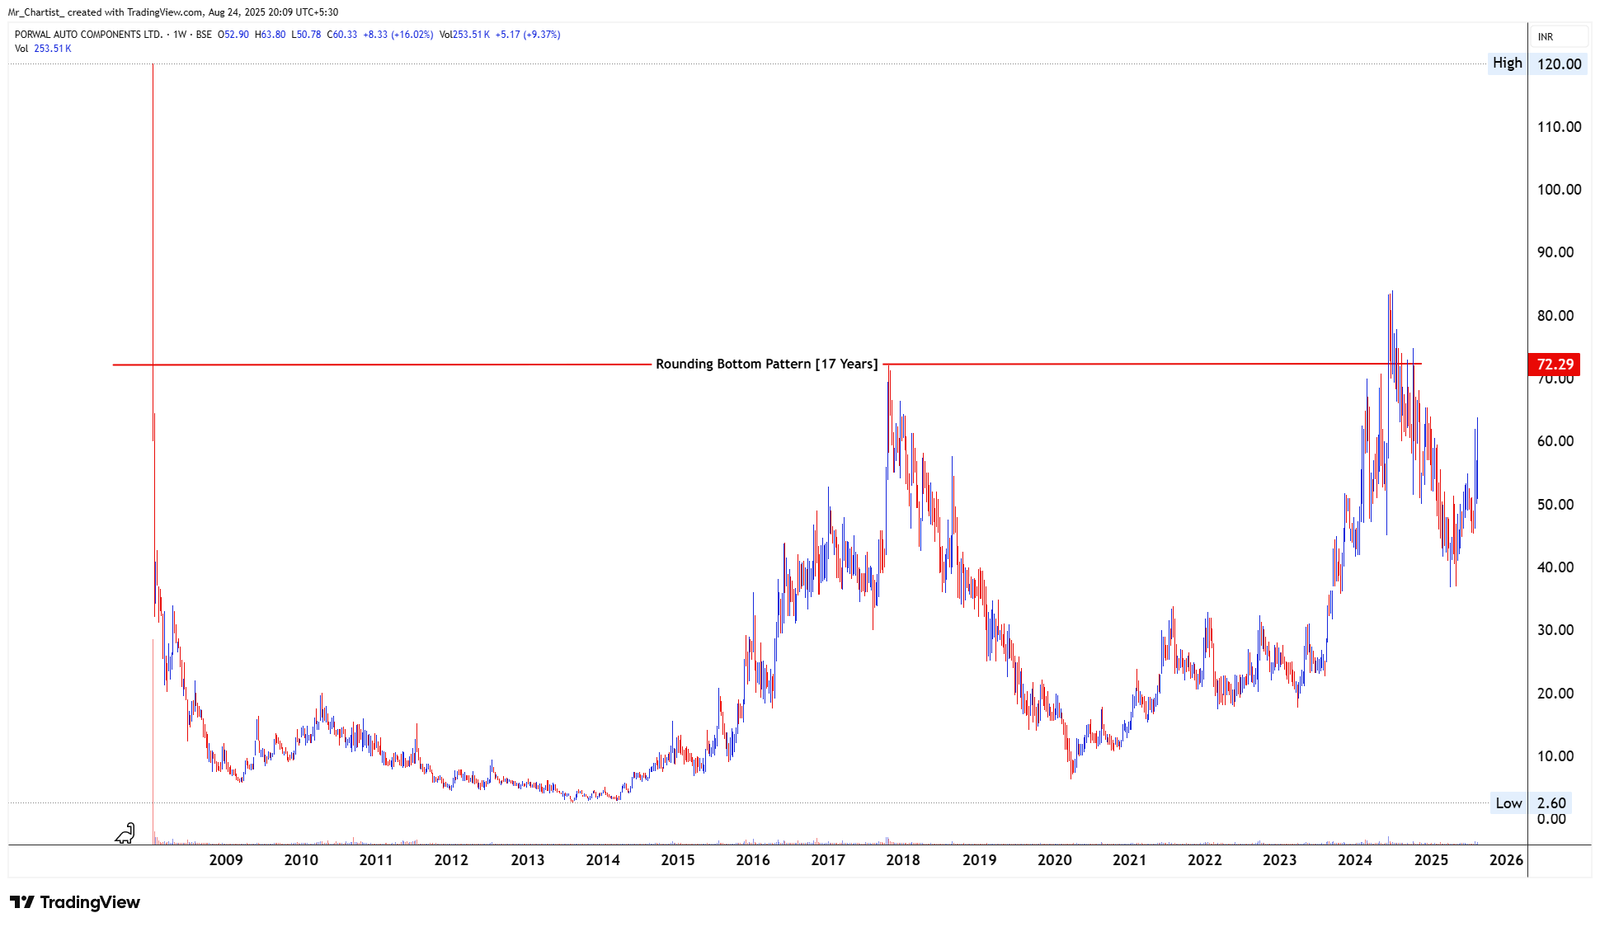
NEPHRO CARE INDIA LTD
bearish fnoRectangle Pattern
6 Months (Daily Chart – Short-Term Base Formation)
Thesis & Analysis
Nephro Care India Ltd has been forming a rectangle consolidation pattern over the last 6 months, with price oscillating between a support of ₹100 and resistance around ₹155. This pattern is typically considered a continuation or reversal base, where the price consolidates after a move before choosing a fresh direction. The chart just witnessed a strong breakout candle above the ₹155 resistance, validating the pattern completion. The breakout was not only strong in price action (nearly +20% up move) but also accompanied by a volume surge, indicating aggressive participation—likely from institutional or smart money. Candlestick Behavior: The breakout candle is a large-bodied bullish candle, closing well above the resistance. Prior candles inside the rectangle were small and tight-bodied, suggesting a volatility contraction phase—often preceding explosive moves. The volume on the breakout day is the highest in the last 6 months, further validating the move. Volume Analysis: Volume surged significantly on the breakout day to 350.4K, confirming strong conviction behind the breakout. Past volume clusters around ₹130–₹140 indicate accumulation zones. Volume during the consolidation was relatively steady, supporting the case of quiet buildup. 2. Crucial Support and Resistance Levels Support Zones: ₹155–₹160: Immediate post-breakout support; this level should now act as a demand zone on dips. ₹135–₹140: Mid-zone of the rectangle and past volume cluster. ₹100: Multi-month strong support and base of the rectangle. Resistance Zones: ₹190–₹200: Initial resistance zone from prior minor swing highs (October 2024). ₹225–₹230: Gap zone from historical fall; a potential supply region. ₹250+: Long-term target zone if momentum sustains.
Price Action
- ■Price action is structurally positive.
- ■Forming higher highs and higher lows.
Volume Profile
- ■Volume is supportive of the price action.
- ■Wait for volume expansion on breakout.
Key Levels
No zones specified
No zones specified
Invalidation Scenario
A weekly close below the support level invalidates this structure.
NEPHRO CARE INDIA LTD
bearish fnoDouble Bottom Breakout
Daily Chart
Thesis & Analysis
No detailed thesis provided for this setup.
Price Action
- ■Price action is structurally positive.
- ■Forming higher highs and higher lows.
Volume Profile
- ■Volume is supportive of the price action.
- ■Wait for volume expansion on breakout.
Key Levels
No zones specified
No zones specified
Invalidation Scenario
A weekly close below the support level invalidates this structure.
Porwal Auto Components Ltd
bearish fnoDouble Bottom Breakout
Daily Chart
Thesis & Analysis
No detailed thesis provided for this setup.
Price Action
- ■Price action is structurally positive.
- ■Forming higher highs and higher lows.
Volume Profile
- ■Volume is supportive of the price action.
- ■Wait for volume expansion on breakout.
Key Levels
No zones specified
No zones specified
Invalidation Scenario
A weekly close below the support level invalidates this structure.
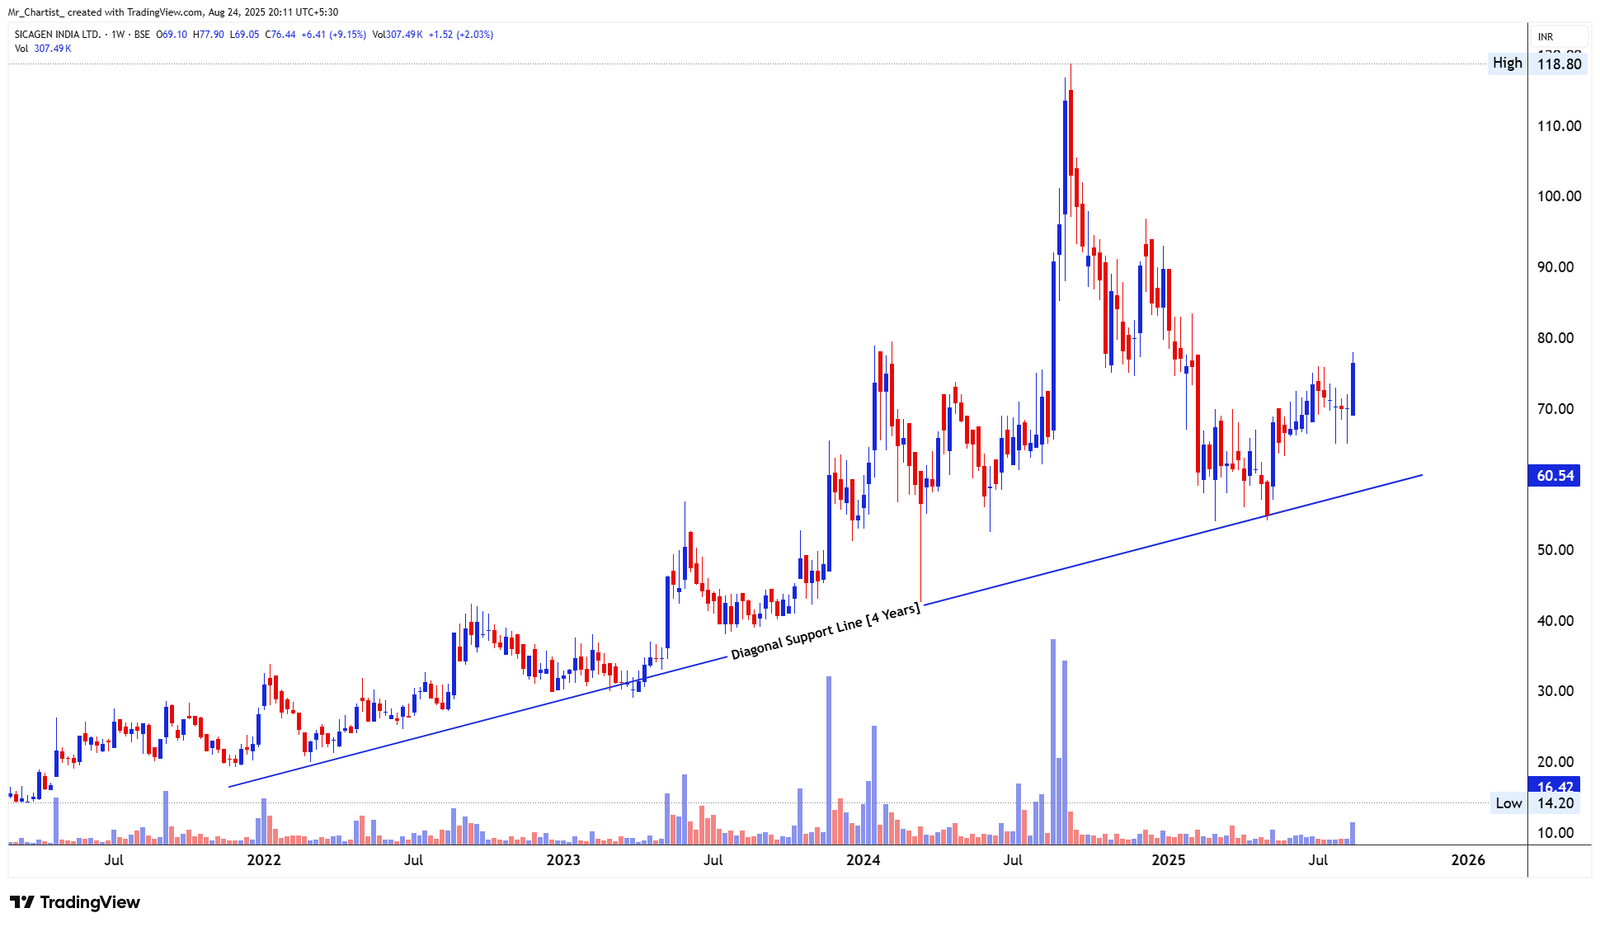
PORWAL AUTO COMPONENTS LTD
bearish fnoRounding Bottom Pattern
17 Years (Weekly Chart – Multi-Decade Reversal Formation)
Thesis & Analysis
Porwal Auto Components Ltd is forming a massive 17-year rounding bottom pattern—a rare and extremely powerful long-term reversal structure. The pattern has matured and price is now hovering just below the breakout point of ₹72.29, a historical resistance level last touched in 2007 and 2018, making it a triple-tested supply zone. This long-duration base suggests years of accumulation and investor disinterest, which is now potentially transitioning into a new secular uptrend. The stock has made a textbook rounded base and recently rallied to retest the neckline level, with momentum steadily building. Candlestick Behavior: Recent candles show strong bullish range bodies, with clean up moves and minimal upper wicks—signaling controlled institutional buying. The last few weeks have shown consistent higher lows, indicating a steady accumulation phase. The current week's large candle with +16% move suggests an anticipatory breakout attempt. Volume Analysis: Volume has picked up sharply in recent months, highest since 2018 breakout attempt. The volume expansion supports the idea of transition from reaccumulation to markup phase. Historical volume during 2008–2016 was minimal; current activity confirms a fresh wave of demand. 2. Crucial Support and Resistance Levels Support Zones: ₹55–₹58: Immediate demand zone from recent breakout retest area. ₹45–₹50: Prior range resistance now acting as base support. ₹30: Multi-year consolidation pivot and key structural level. Resistance Zones: ₹72.29: Major breakout level from the 17-year rounding bottom; historical neckline. ₹85–₹90: Short-term target zone after breakout. ₹120: Multi-decade swing high from IPO rally; long-term resistance zone.
Price Action
- ■Price action is structurally positive.
- ■Forming higher highs and higher lows.
Volume Profile
- ■Volume is supportive of the price action.
- ■Wait for volume expansion on breakout.
Key Levels
No zones specified
No zones specified
Invalidation Scenario
A weekly close below the support level invalidates this structure.
PORWAL AUTO COMPONENTS LTD
bearish fnoDouble Bottom Breakout
Daily Chart
Thesis & Analysis
No detailed thesis provided for this setup.
Price Action
- ■Price action is structurally positive.
- ■Forming higher highs and higher lows.
Volume Profile
- ■Volume is supportive of the price action.
- ■Wait for volume expansion on breakout.
Key Levels
No zones specified
No zones specified
Invalidation Scenario
A weekly close below the support level invalidates this structure.
Sicagen India Ltd
bearish fnoDouble Bottom Breakout
Daily Chart
Thesis & Analysis
No detailed thesis provided for this setup.
Price Action
- ■Price action is structurally positive.
- ■Forming higher highs and higher lows.
Volume Profile
- ■Volume is supportive of the price action.
- ■Wait for volume expansion on breakout.
Key Levels
No zones specified
No zones specified
Invalidation Scenario
A weekly close below the support level invalidates this structure.
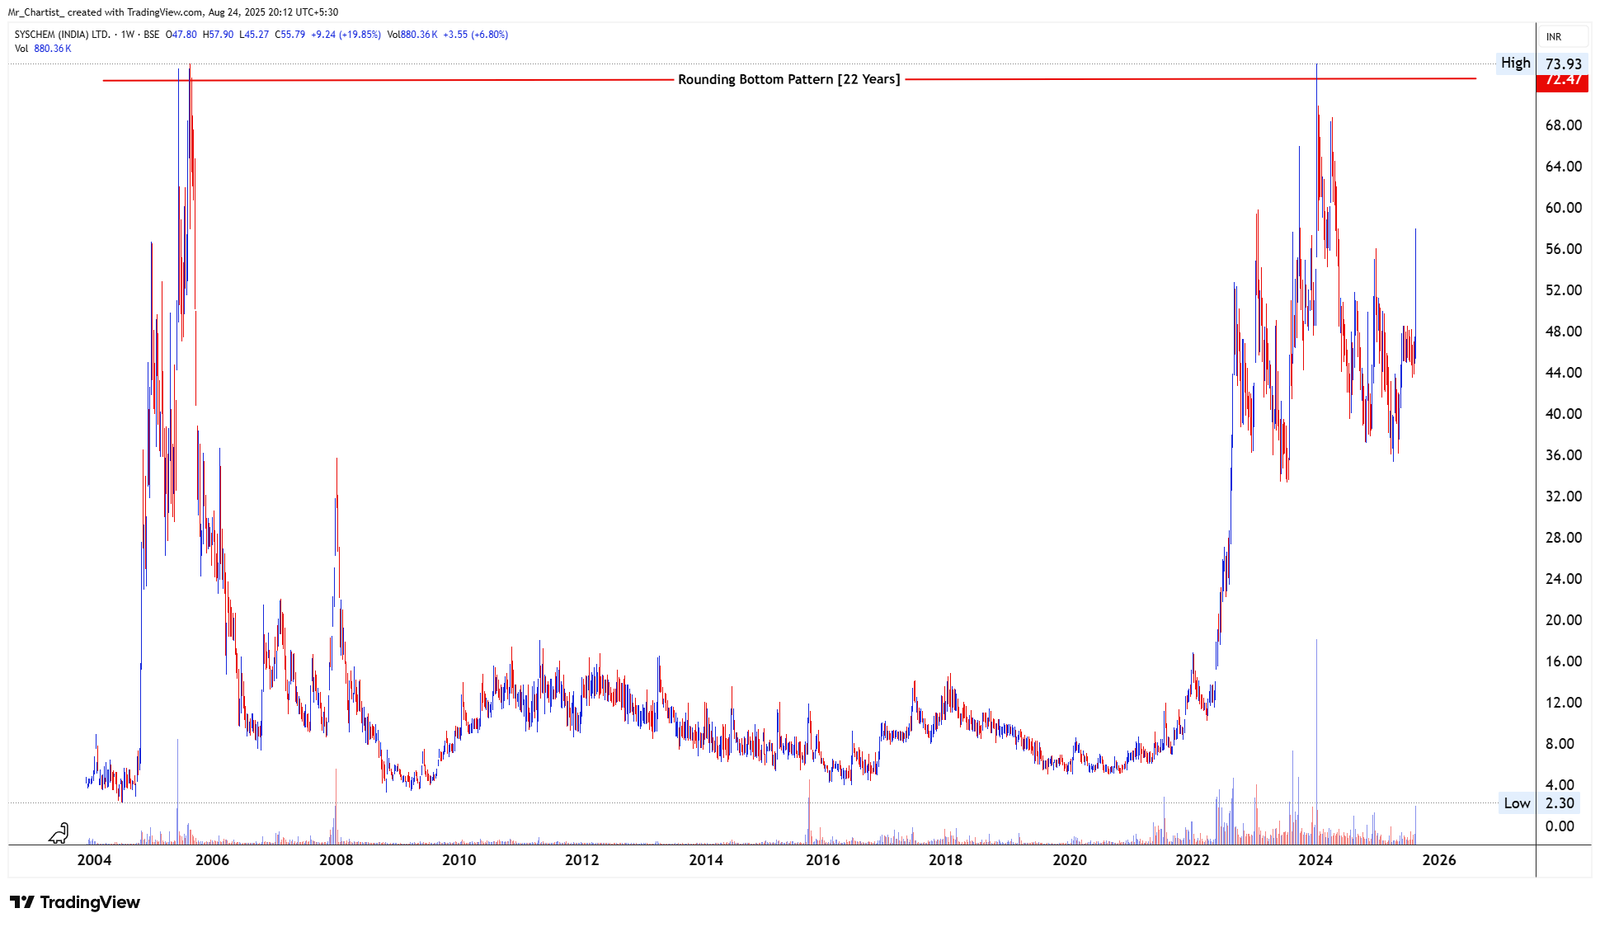
SICAGEN INDIA LTD
bearish fnoAscending Trendline Support
4 Years (Weekly Chart – Long-Term Uptrend with Higher Lows)
Thesis & Analysis
Sicagen India Ltd is currently respecting a long-term diagonal trendline support, which has been intact for nearly 4 years. This trendline has consistently provided strong buying interest at each retest, establishing a steady uptrend structure. The price has formed higher lows and higher highs since early 2021, confirming a long-term bullish bias. The most recent correction (from ₹118.80 to ~₹60) found support again at the rising trendline, and the price has rebounded smartly over the past few weeks. This bounce reinforces the strength of the trendline, making it a significant structural support going forward. Candlestick Behavior: A series of bullish candles recently suggests renewed buying interest post- correction. Recent candles show demand tails (lower wicks) at the trendline, indicating buying pressure at support. A strong green candle has emerged from the support zone, reflecting momentum re-entry by swing traders or position builders. Volume Analysis: Notably, volume expanded during the recent bounce, which confirms the legitimacy of the move. Prior upswings have also seen volume spikes at critical points, showing repeat institutional activity. Volume remains healthy and consistent, supporting the underlying strength of the ongoing uptrend. 2. Crucial Support and Resistance Levels Support Zones: ₹60–₹62: Long-term trendline support and recent demand rebound area. ₹50–₹52: Deeper historical support from 2022 lows, below the trendline. ₹40–₹45: Major base zone (last-resort support level, if trend fails). Resistance Zones: ₹85–₹90: Immediate swing resistance; prior supply zone from recent peaks. ₹100–₹105: Round number resistance and psychological hurdle. ₹118.80: All-time high and long-term breakout level from 2025 peak.
Price Action
- ■Price action is structurally positive.
- ■Forming higher highs and higher lows.
Volume Profile
- ■Volume is supportive of the price action.
- ■Wait for volume expansion on breakout.
Key Levels
No zones specified
No zones specified
Invalidation Scenario
A weekly close below the support level invalidates this structure.
SICAGEN INDIA LTD
bearish fnoDouble Bottom Breakout
Daily Chart
Thesis & Analysis
No detailed thesis provided for this setup.
Price Action
- ■Price action is structurally positive.
- ■Forming higher highs and higher lows.
Volume Profile
- ■Volume is supportive of the price action.
- ■Wait for volume expansion on breakout.
Key Levels
No zones specified
No zones specified
Invalidation Scenario
A weekly close below the support level invalidates this structure.
Syschem (India) Ltd
bearish fnoDouble Bottom Breakout
Daily Chart
Thesis & Analysis
No detailed thesis provided for this setup.
Price Action
- ■Price action is structurally positive.
- ■Forming higher highs and higher lows.
Volume Profile
- ■Volume is supportive of the price action.
- ■Wait for volume expansion on breakout.
Key Levels
No zones specified
No zones specified
Invalidation Scenario
A weekly close below the support level invalidates this structure.
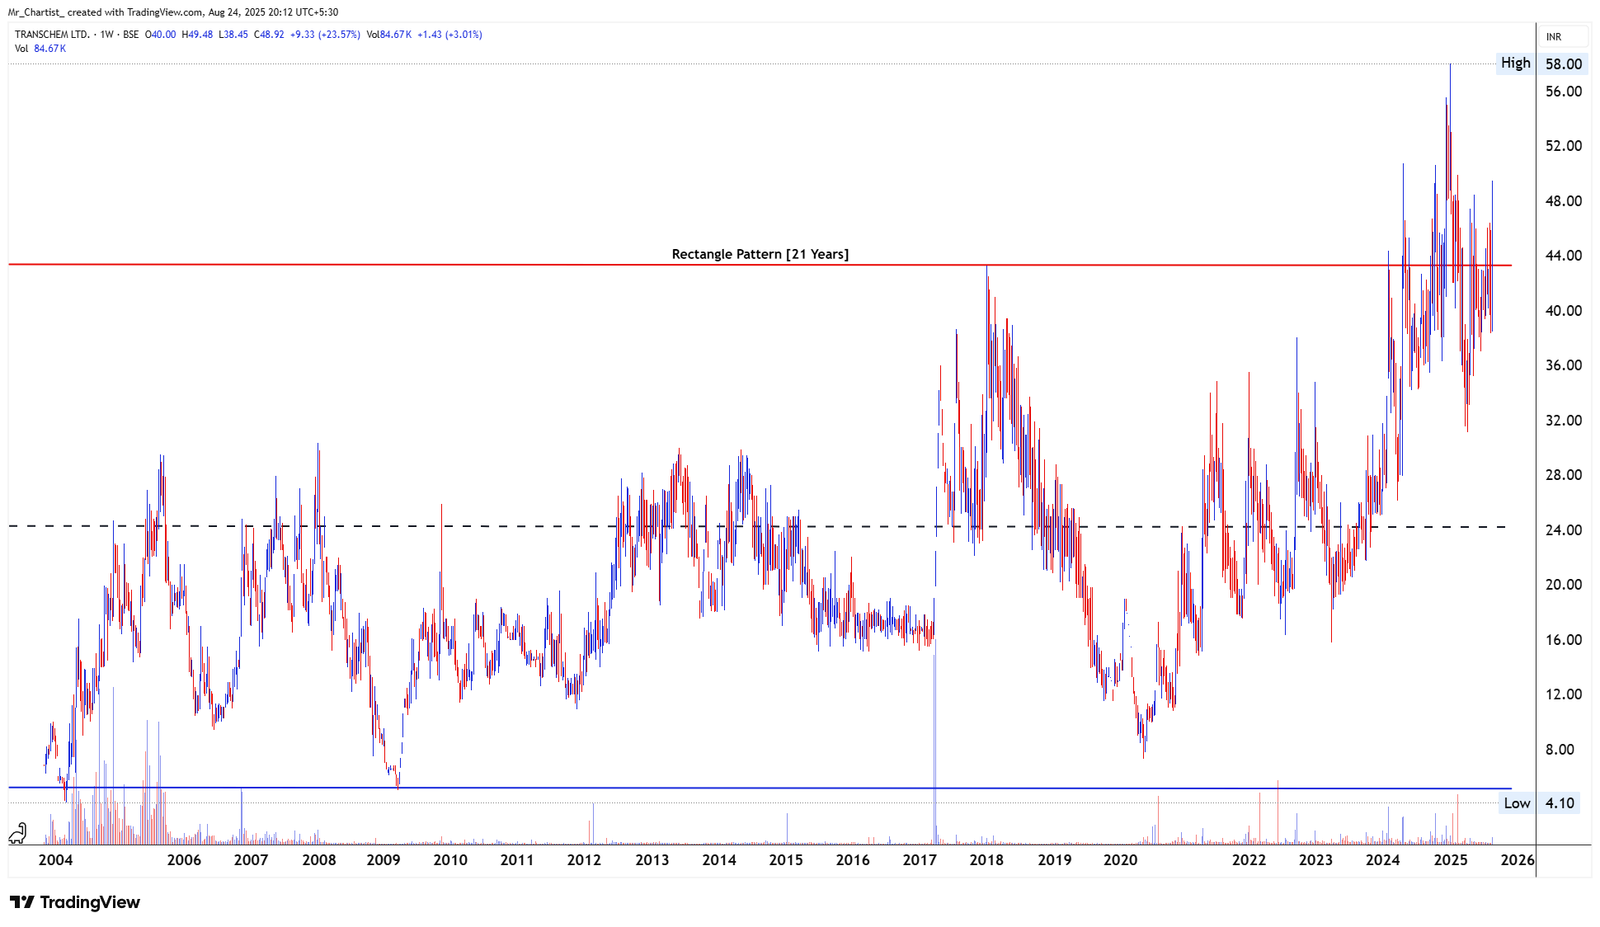
SYSCHEM (INDIA) LTD
bearish fnoRounding Bottom Pattern
22 Years (Ultra-Long-Term – Weekly Chart)
Thesis & Analysis
Syschem (India) Ltd has formed a massive 22-year Rounding Bottom Pattern, one of the most powerful bullish reversal formations, typically indicating a transition from a long downtrend to a sustained uptrend. The chart reflects decades of consolidation and base formation with the resistance neckline now established around ₹73.93, which coincides with multi-decade highs. The recent sharp up-move that began around 2021 marks the right side of the rounding structure, supported by exponential price expansion and volume acceleration. Although the stock has faced multiple rejections near the ₹70–₹74 range, the structure remains intact and suggests a potentially explosive breakout above the neckline in the near future. Candlestick Behavior: Strong upward momentum was seen during the right curve of the rounding bottom (2022 onward). Multiple rejection wicks near ₹70–₹74 suggest supply pressure, but price continues to retest this zone, building pressure. Current bars show healthy higher lows forming a mini base within the larger pattern. Volume Analysis: Significant volume emerged during the initial rally phase (2022), confirming accumulation and institutional entry. Volume spikes near resistance zones indicate ongoing accumulation, not distribution. Continued elevated volume around current levels supports the probability of an upcoming breakout. 2. Crucial Support and Resistance Levels Support Zones: ₹43–₹45: Immediate support range from recent swing lows. ₹36–₹38: Volume shelf and support from base of last up-leg. ₹22–₹25: Historical midpoint in the rounding structure. Resistance Zones: ₹70–₹74: Major breakout zone and pattern neckline. ₹85–₹90: Fib extension resistance post-breakout. ₹100+: Psychological round number and potential long-term target zone.
Price Action
- ■Price action is structurally positive.
- ■Forming higher highs and higher lows.
Volume Profile
- ■Volume is supportive of the price action.
- ■Wait for volume expansion on breakout.
Key Levels
No zones specified
No zones specified
Invalidation Scenario
A weekly close below the support level invalidates this structure.
SYSCHEM (INDIA) LTD
bearish fnoDouble Bottom Breakout
Daily Chart
Thesis & Analysis
No detailed thesis provided for this setup.
Price Action
- ■Price action is structurally positive.
- ■Forming higher highs and higher lows.
Volume Profile
- ■Volume is supportive of the price action.
- ■Wait for volume expansion on breakout.
Key Levels
No zones specified
No zones specified
Invalidation Scenario
A weekly close below the support level invalidates this structure.
Transchem Ltd
bearish fnoDouble Bottom Breakout
Daily Chart
Thesis & Analysis
No detailed thesis provided for this setup.
Price Action
- ■Price action is structurally positive.
- ■Forming higher highs and higher lows.
Volume Profile
- ■Volume is supportive of the price action.
- ■Wait for volume expansion on breakout.
Key Levels
No zones specified
No zones specified
Invalidation Scenario
A weekly close below the support level invalidates this structure.
Chart Image Not Extracted
TRANSCHEM LTD
bearish fnoRectangle Pattern
21 Years (Weekly Chart – Super Long-Term Base)
Thesis & Analysis
Transchem Ltd has been forming a massive Rectangle Pattern for over two decades, oscillating within a well-defined range between approximately ₹4.10 (support) and ₹44.00 (resistance). Such long-term horizontal consolidations typically represent prolonged accumulation phases, often culminating in significant breakout moves once the upper resistance is breached with conviction. In this case, the recent price action shows a decisive breakout above ₹44, suggesting that the multi-decade range is finally being resolved to the upside. Candlestick Behavior: In recent months, bullish candles with long bodies have started appearing post-breakout, indicating strong momentum. Historical volatility within the rectangle has subsided, replaced by more consistent higher lows, a key sign of structural change. The current breakout zone (~₹44–₹46) may act as a retest level before further markup. Volume Analysis: Volume remained muted for years during the sideways phase – classic sign of accumulation. Recent price rally has been accompanied by significant spikes in volume, confirming institutional activity and renewed interest. Volume continues to trend higher post-breakout – a very constructive sign. 2. Crucial Support and Resistance Levels Support Zones: ₹44–₹46: Immediate support zone and former resistance, now a potential breakout retest level. ₹25: Historical midpoint and prior congestion zone within rectangle. ₹12–₹15: Deep support and old bounce zones. Resistance Zones: ₹58–₹60: Immediate short-term resistance (recent high). ₹75–₹80: Fib extension and next leg of upward targets. ₹100+: Round number psychological resistance, post-breakout horizon zone.
Price Action
- ■Price action is structurally positive.
- ■Forming higher highs and higher lows.
Volume Profile
- ■Volume is supportive of the price action.
- ■Wait for volume expansion on breakout.
Key Levels
No zones specified
No zones specified
Invalidation Scenario
A weekly close below the support level invalidates this structure.
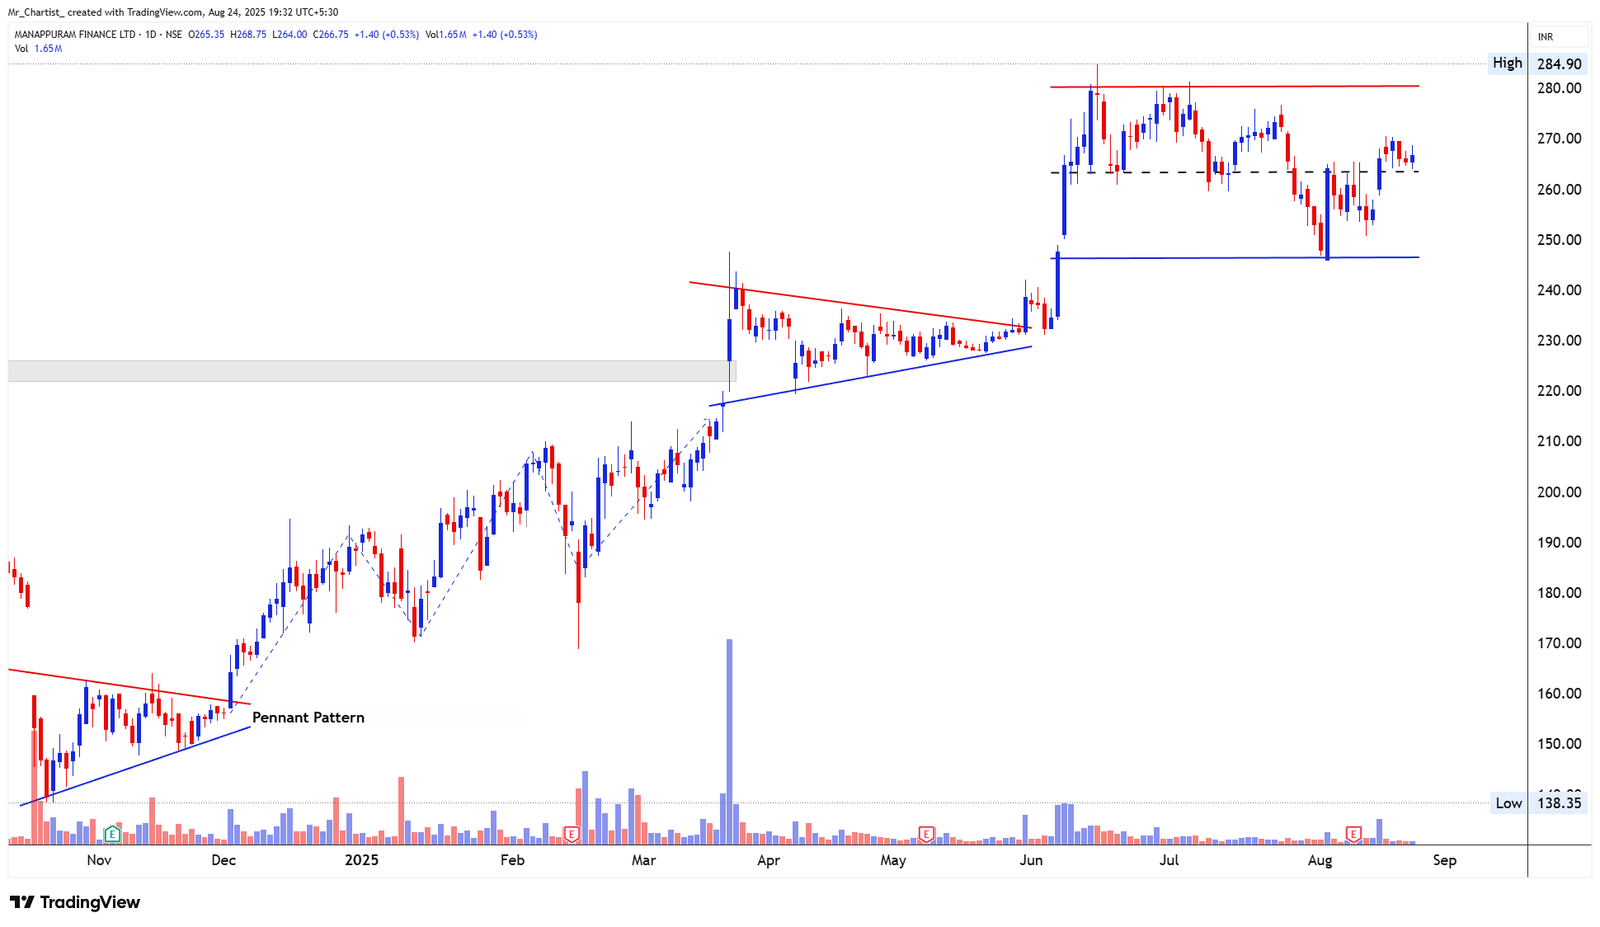
TRANSCHEM LTD
bearish fnoDouble Bottom Breakout
Daily Chart
Thesis & Analysis
No detailed thesis provided for this setup.
Price Action
- ■Price action is structurally positive.
- ■Forming higher highs and higher lows.
Volume Profile
- ■Volume is supportive of the price action.
- ■Wait for volume expansion on breakout.
Key Levels
No zones specified
No zones specified
Invalidation Scenario
A weekly close below the support level invalidates this structure.
Charts to Watch
Setups forming favorable structures
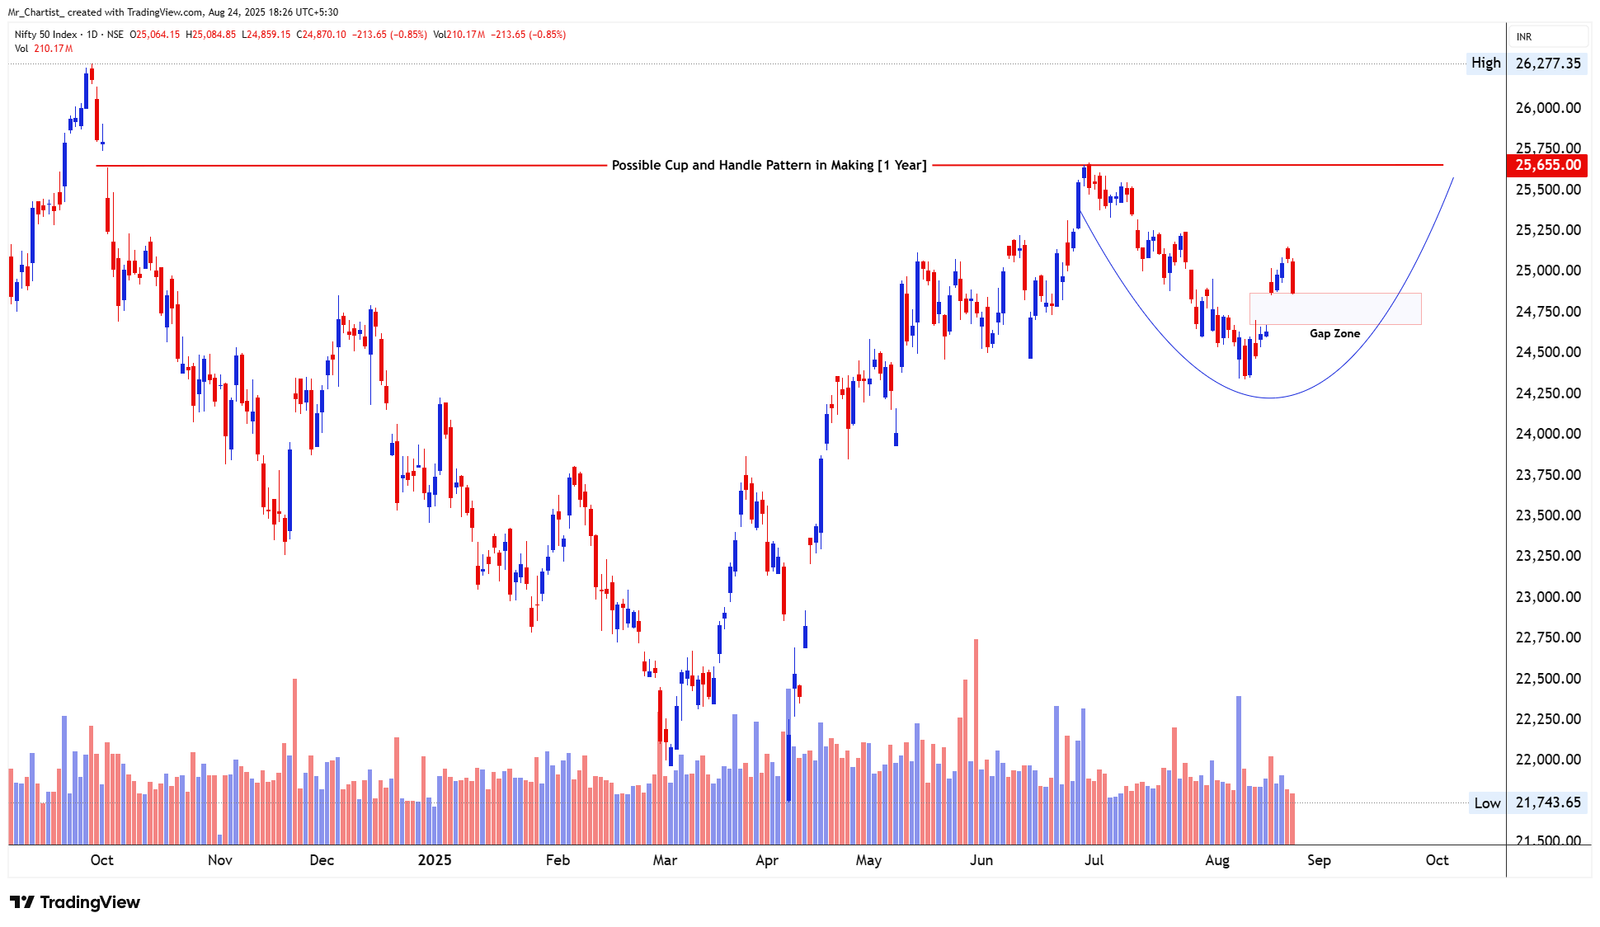
Nifty 50 Index
charts to-watchDouble Bottom Breakout
Daily Chart
Thesis & Analysis
No detailed thesis provided for this setup.
Price Action
- ■Price action is structurally positive.
- ■Forming higher highs and higher lows.
Volume Profile
- ■Volume is supportive of the price action.
- ■Wait for volume expansion on breakout.
Key Levels
No zones specified
No zones specified
Invalidation Scenario
A weekly close below the support level invalidates this structure.
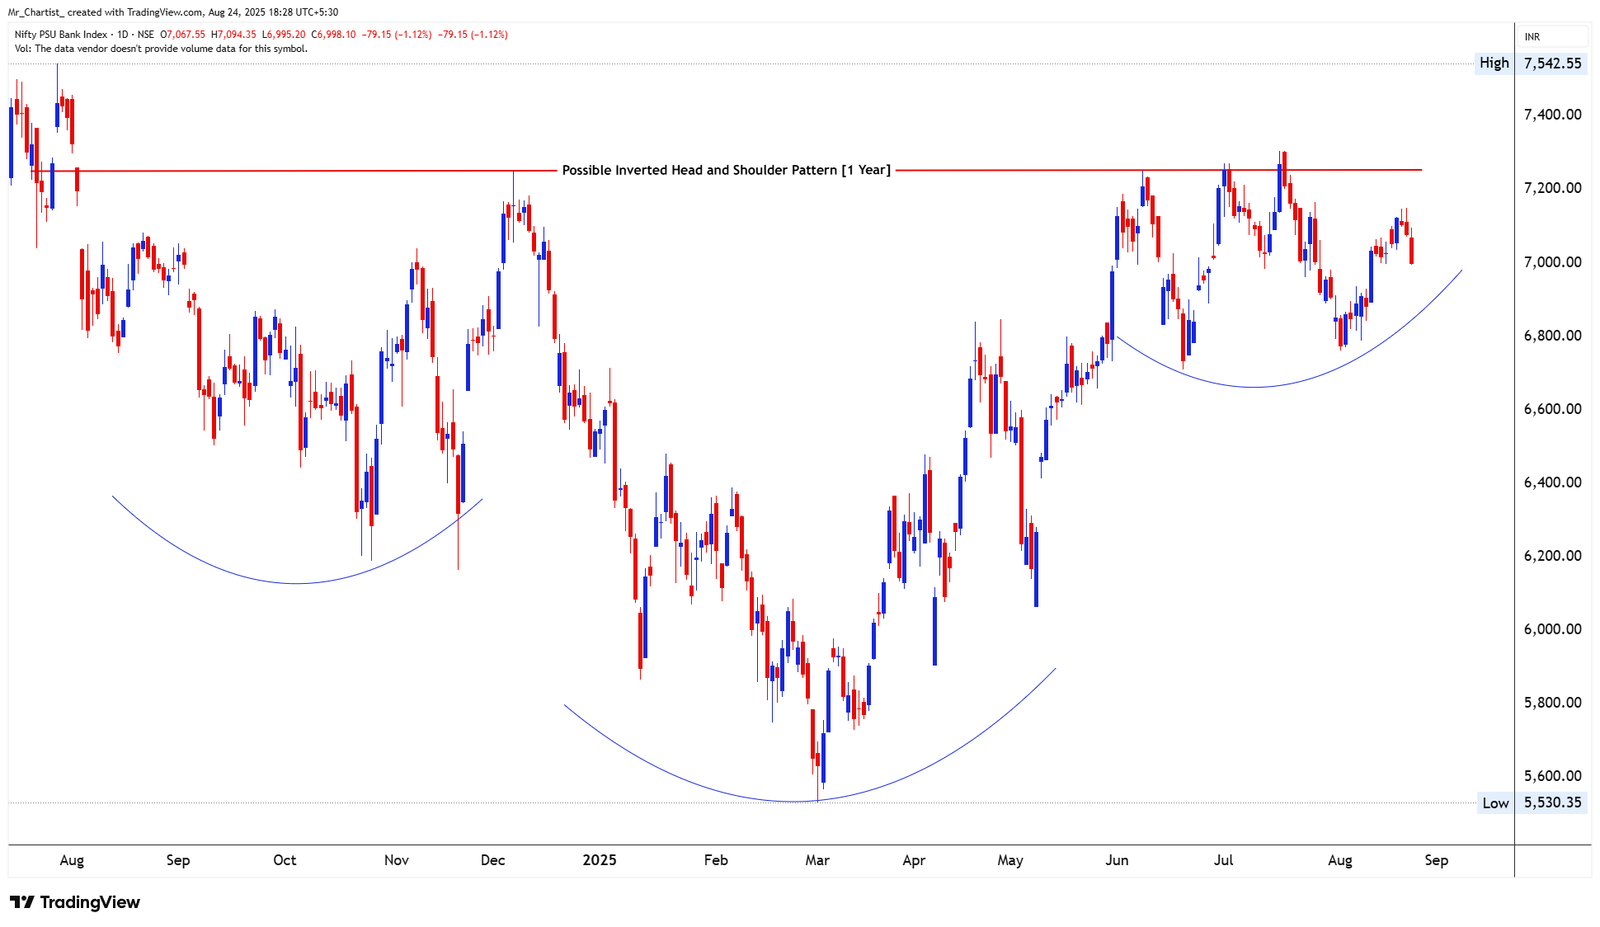
NIFTY 50 INDEX
charts to-watchCup and Handle Formation (Early Stage Handle)
1 Year (Daily Chart – Bullish Continuation Setup)
Thesis & Analysis
Nifty is forming a large Cup and Handle pattern spanning nearly a year, with price currently developing the handle after a broad rounding base. The neckline resistance lies around 25,655, which is the previous swing high and the top of the cup structure. Recent price action shows a gap-up move that was retested and held at the 24,900 level, now acting as a short-term support. This structure is indicative of controlled consolidation within a bullish setup. The handle phase reflects mild selling pressure, forming a falling wedge-like structure within the larger bullish context. A breakout above 25,655 would confirm the pattern and potentially trigger a strong trend continuation toward higher levels. Until then, price remains in a tight range and may oscillate between key zones. A decisive breakdown below 24,250 would negate the handle structure and shift sentiment short-term bearish. Candlestick Behavior: Price action within the handle is showing alternating small-bodied candles. Mild lower wicks near the 24,900 zone suggest demand presence. No strong bullish reversal yet, keeping the structure neutral-to-bullish. Volume Analysis: Gradual volume decline during handle formation—typical of this pattern. Watch for volume surge on breakout above neckline for confirmation. Lack of volume near support suggests passive accumulation. 2. Crucial Support and Resistance Levels Support Zones: 24,900 – Short-term support formed after gap fill. 24,250 – Crucial breakdown zone; losing this weakens the structure. 23,700 – Lower support from prior swing lows. Resistance Zones: 25,655 – Pattern neckline; key breakout level. 26,275 – Post-breakout resistance from previous high. 27,000 – Measured move zone if cup and handle triggers.
Price Action
- ■Price action is structurally positive.
- ■Forming higher highs and higher lows.
Volume Profile
- ■Volume is supportive of the price action.
- ■Wait for volume expansion on breakout.
Key Levels
No zones specified
No zones specified
Invalidation Scenario
A weekly close below the support level invalidates this structure.
NIFTY 50 INDEX
charts to-watchDouble Bottom Breakout
Daily Chart
Thesis & Analysis
No detailed thesis provided for this setup.
Price Action
- ■Price action is structurally positive.
- ■Forming higher highs and higher lows.
Volume Profile
- ■Volume is supportive of the price action.
- ■Wait for volume expansion on breakout.
Key Levels
No zones specified
No zones specified
Invalidation Scenario
A weekly close below the support level invalidates this structure.
Nifty PSU Bank Index
charts to-watchDouble Bottom Breakout
Daily Chart
Thesis & Analysis
No detailed thesis provided for this setup.
Price Action
- ■Price action is structurally positive.
- ■Forming higher highs and higher lows.
Volume Profile
- ■Volume is supportive of the price action.
- ■Wait for volume expansion on breakout.
Key Levels
No zones specified
No zones specified
Invalidation Scenario
A weekly close below the support level invalidates this structure.
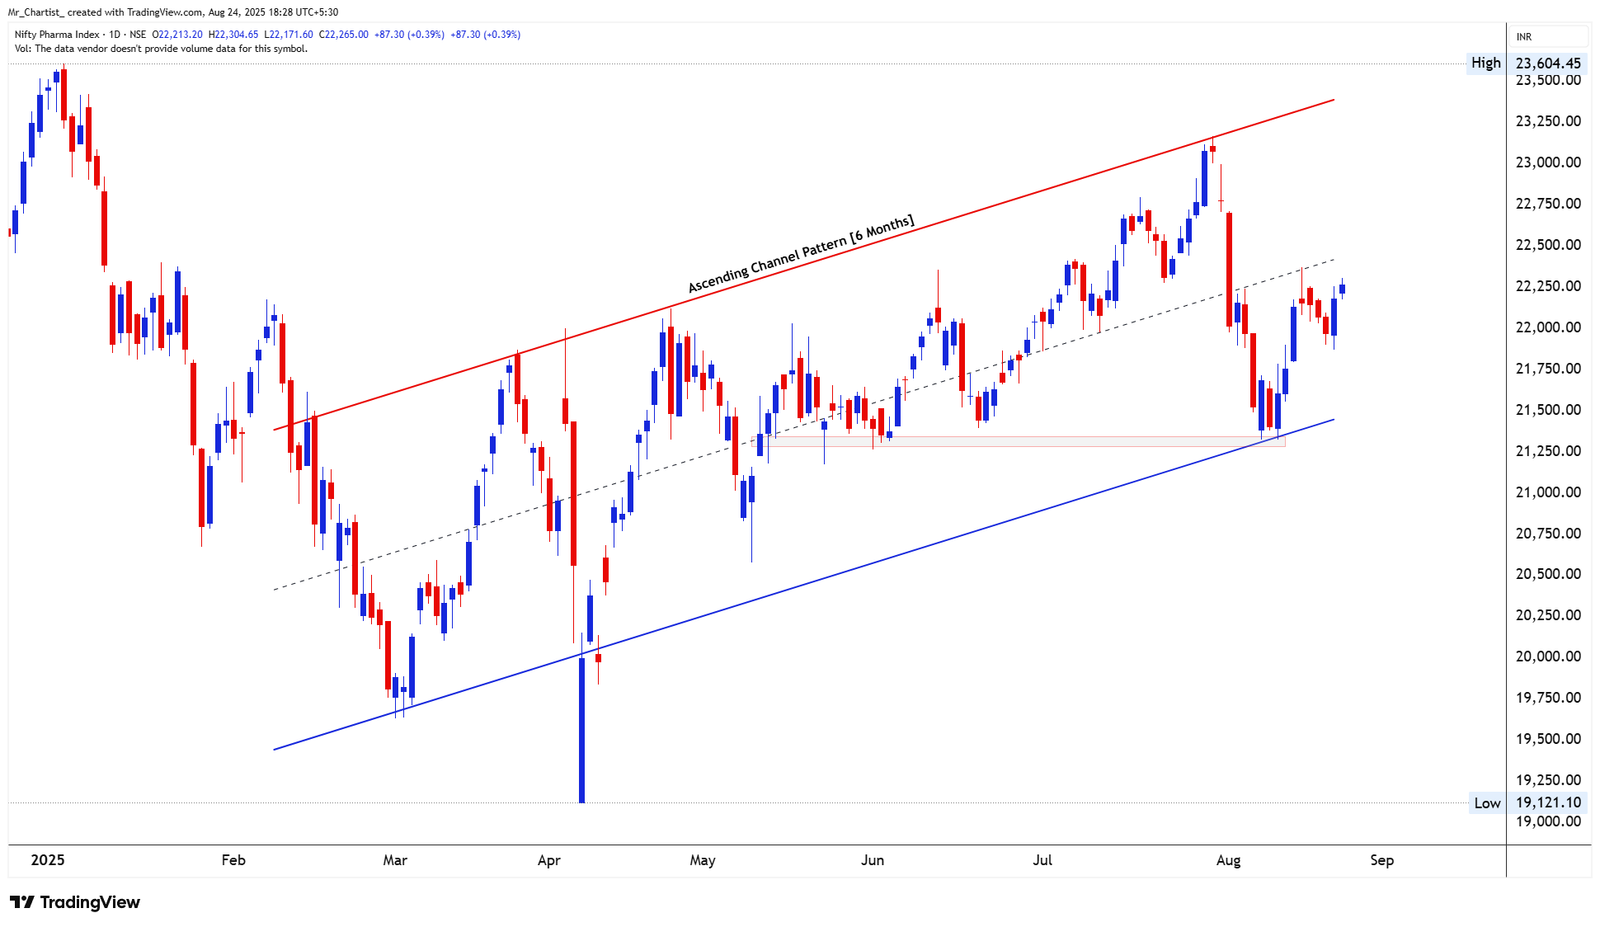
NIFTY PSU BANK INDEX
charts to-watchInverted Head and Shoulder Pattern (Reversal Structure)
1 Year (Daily Chart – Accumulation to Early Bullish Phase)
Thesis & Analysis
Nifty PSU Bank Index appears to be forming a classic Inverted Head and Shoulder pattern over the past 12 months. The left shoulder, head, and right shoulder are well-defined, with the neckline resistance placed near the 7,250–7,300 zone. The right shoulder is currently in development, and price is attempting to stabilize around 6,900–7,000, which is the curved support zone forming the base of the shoulder. This structure typically reflects a transition from bearish to bullish sentiment, where buyers start stepping in after prolonged distribution phases. A breakout above the neckline would mark a potential trend reversal and open the door to medium-term strength. Until then, the index remains range-bound and sensitive to broader market cues. Failure to hold the 6,800–6,900 zone could weaken the right shoulder and delay the pattern's completion. Candlestick Behavior: Alternating candles in the right shoulder indicate indecision and short-term demand. Recent red candles show pullback pressure but are not yet aggressive. No bearish engulfing or breakdown candle formed yet. Volume Analysis: Volume data unavailable, but generally, this pattern requires increasing volume on breakout. Lack of sharp downside wicks suggests no panic selling yet. 2. Crucial Support and Resistance Levels Support Zones: 6,900–7,000 – Current support forming the right shoulder base. 6,800 – Key zone; breakdown here weakens pattern structure. 6,500 – Lower support near prior swing lows. Resistance Zones: 7,250–7,300 – Neckline resistance of the pattern; breakout trigger. 7,542 – Swing high post-breakout target. 7,800+ – Measured move projection on successful breakout.
Price Action
- ■Price action is structurally positive.
- ■Forming higher highs and higher lows.
Volume Profile
- ■Volume is supportive of the price action.
- ■Wait for volume expansion on breakout.
Key Levels
No zones specified
No zones specified
Invalidation Scenario
A weekly close below the support level invalidates this structure.
NIFTY PSU BANK INDEX
charts to-watchDouble Bottom Breakout
Daily Chart
Thesis & Analysis
No detailed thesis provided for this setup.
Price Action
- ■Price action is structurally positive.
- ■Forming higher highs and higher lows.
Volume Profile
- ■Volume is supportive of the price action.
- ■Wait for volume expansion on breakout.
Key Levels
No zones specified
No zones specified
Invalidation Scenario
A weekly close below the support level invalidates this structure.
Nifty Pharma Index
charts to-watchDouble Bottom Breakout
Daily Chart
Thesis & Analysis
No detailed thesis provided for this setup.
Price Action
- ■Price action is structurally positive.
- ■Forming higher highs and higher lows.
Volume Profile
- ■Volume is supportive of the price action.
- ■Wait for volume expansion on breakout.
Key Levels
No zones specified
No zones specified
Invalidation Scenario
A weekly close below the support level invalidates this structure.
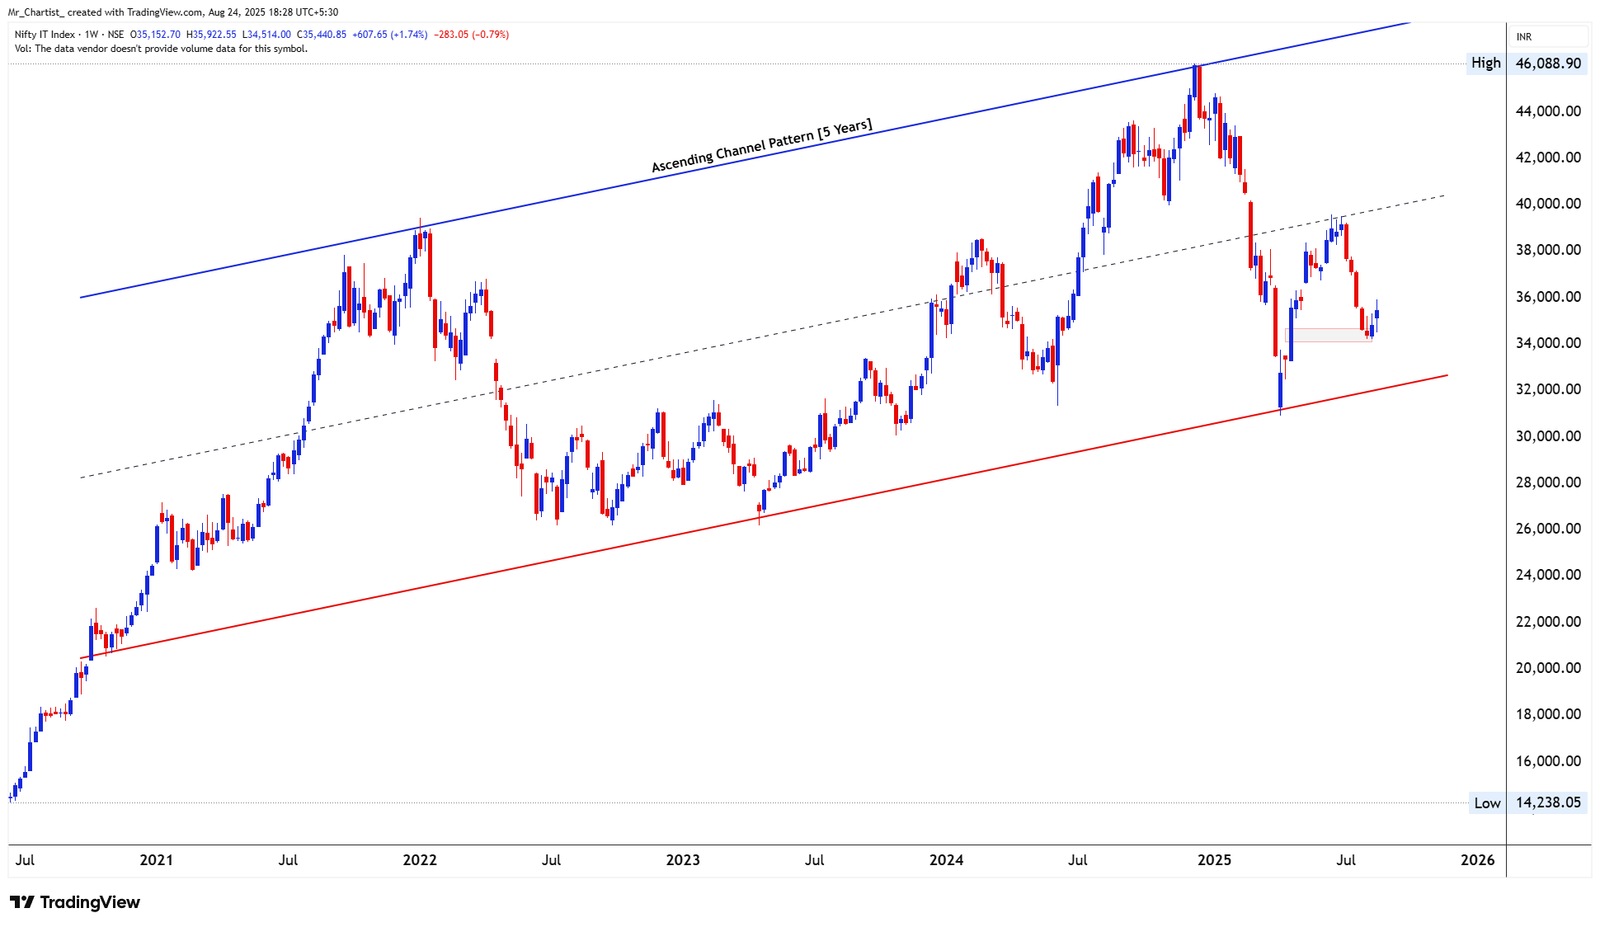
NIFTY PHARMA INDEX
charts to-watchAscending Channel Pattern
6 Months (Daily Chart – Bullish Structure with Recent Correction)
Thesis & Analysis
Nifty Pharma Index is trading within a well-defined ascending channel that has held price action for the past 6 months. The channel shows higher highs and higher lows, reflecting a medium-term bullish structure. Price recently tested the lower boundary of the channel near 21,300–21,400, which aligned with a prior support zone and led to a mild bounce. This suggests buyers are still defending the structure. Currently, price is rebounding from the lower trendline but remains below the mid-channel line, indicating recovery mode but not yet strong momentum. A move back above 22,500–22,700 would confirm strength within the trend and open the path to retest the upper boundary of the channel near 23,300–23,500. Breakdown below the ascending support line (~21,200) would shift sentiment negative and violate the channel’s structure. Candlestick Behavior: Recent candles show small-bodied bullish structures post bounce, with narrow-range recovery candles. No reversal exhaustion patterns, but no strong bullish confirmation yet either. 2. Crucial Support and Resistance Levels Support Zones: 21,300–21,400 – Recent bounce zone; base of ascending channel. 21,200 – Key trendline support; breakdown invalidates structure. 20,600 – Historical demand zone. Resistance Zones: 22,500–22,700 – Mid-channel and congestion area; minor breakout zone. 23,300–23,500 – Upper boundary of ascending channel. 23,600+ – Multi-month high; breakout target beyond channel. 3. Strategic Trade Scenarios 🔸 Primary Setup – Channel Continuation If price sustains above 22,500, Pharma index could climb toward 23,300–23,500, following the upper channel slope. Confirmation improves if price reclaims mid-channel support with bullish candles. 🔹 Alternate Setup – Mid-Channel Rejection If the index fails to cross 22,500–22,700, sideways to corrective movement could extend within the 21,300–22,700 range. ⚠️ Major Breakdown Risk: A close below 21,200 would mark a channel breakdown. This could initiate a steeper correction toward 20,600 or even lower levels if selling accelerates.
Price Action
- ■Price action is structurally positive.
- ■Forming higher highs and higher lows.
Volume Profile
- ■Volume is supportive of the price action.
- ■Wait for volume expansion on breakout.
Key Levels
No zones specified
No zones specified
Invalidation Scenario
A weekly close below the support level invalidates this structure.
Nifty IT Index
charts to-watchDouble Bottom Breakout
Daily Chart
Thesis & Analysis
No detailed thesis provided for this setup.
Price Action
- ■Price action is structurally positive.
- ■Forming higher highs and higher lows.
Volume Profile
- ■Volume is supportive of the price action.
- ■Wait for volume expansion on breakout.
Key Levels
No zones specified
No zones specified
Invalidation Scenario
A weekly close below the support level invalidates this structure.
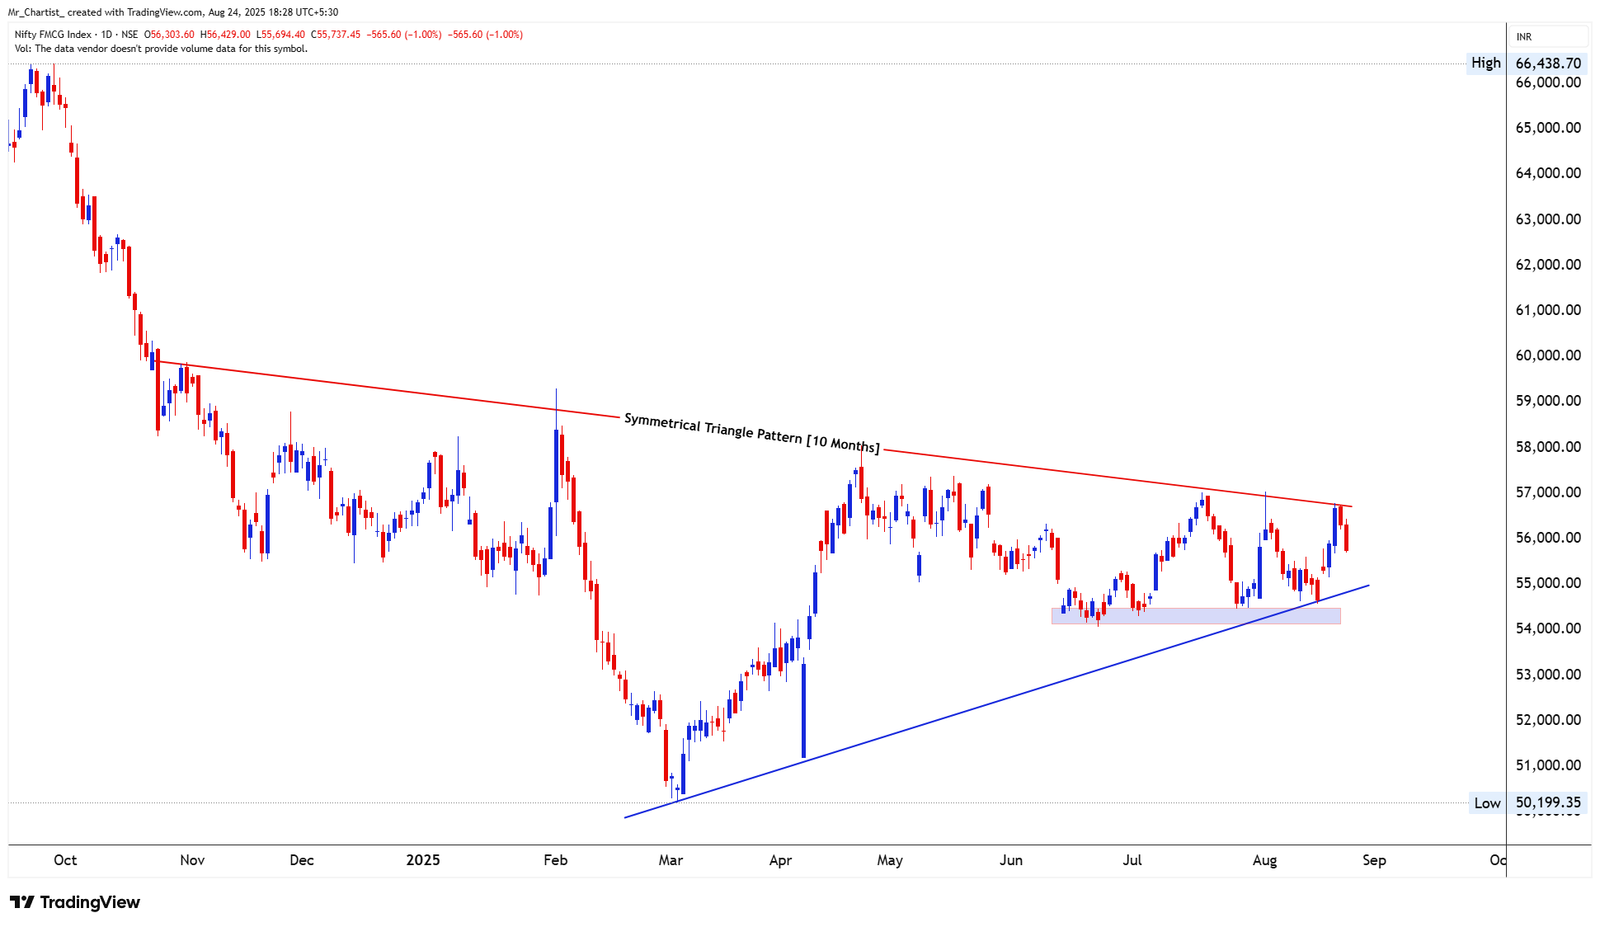
NIFTY IT INDEX
charts to-watchAscending Channel Pattern
5 Years (Weekly Chart – Long-Term Bullish Structure)
Thesis & Analysis
Nifty IT Index continues to respect a broad ascending channel that has held for over 5 years, reflecting a structurally bullish long-term trend. The index recently corrected from the upper mid-channel zone and took support near 34,000–34,500, which also aligns with a horizontal base from past consolidations. Despite the short-term weakness, the long-term trendline support remains much lower around 32,000, providing a buffer for deeper pullbacks. A sustained move back above 36,500–37,000 would suggest recovery within the channel and could trigger a retest of the 40,000–42,000 zone. Breakdown below 34,000 would put pressure on the structure, and a breach below 32,000 would mark a major structural shift. Candlestick Behavior: Recent weekly candles show downside wicks, reflecting demand near 34,000. Current candle is a small-bodied attempt to stabilize after a 5-week slide. No strong bullish reversal yet, but signs of price absorption are visible. 2. Crucial Support and Resistance Levels Support Zones: 34,000–34,500 – Immediate horizontal base and reaction zone. 32,000 – Long-term trendline support; key to channel integrity. 30,000 – Historical support and volume shelf. Resistance Zones: 36,500–37,000 – Short-term recovery hurdle. 40,000–42,000 – Mid-to-upper channel range; congestion zone. 46,000 – Channel top and multi-year resistance. 3. Strategic Trade Scenarios 🔸 Primary Setup – Channel Support Holds If price sustains above 34,000 and climbs past 36,500, the index could resume its climb toward 40,000+ within the ascending channel. 🔹 Alternate Setup – Extended Pullback If the index remains below 36,500, expect extended consolidation between 34,000– 37,000, with the channel intact but short-term sentiment mixed. ⚠️ Major Breakdown Risk: A decisive weekly close below 32,000 would break the ascending channel and may lead to a medium-term structural reversal, with downside toward 30,000–28,000.
Price Action
- ■Price action is structurally positive.
- ■Forming higher highs and higher lows.
Volume Profile
- ■Volume is supportive of the price action.
- ■Wait for volume expansion on breakout.
Key Levels
No zones specified
No zones specified
Invalidation Scenario
A weekly close below the support level invalidates this structure.
Nifty FMCG Index
charts to-watchDouble Bottom Breakout
Daily Chart
Thesis & Analysis
No detailed thesis provided for this setup.
Price Action
- ■Price action is structurally positive.
- ■Forming higher highs and higher lows.
Volume Profile
- ■Volume is supportive of the price action.
- ■Wait for volume expansion on breakout.
Key Levels
No zones specified
No zones specified
Invalidation Scenario
A weekly close below the support level invalidates this structure.
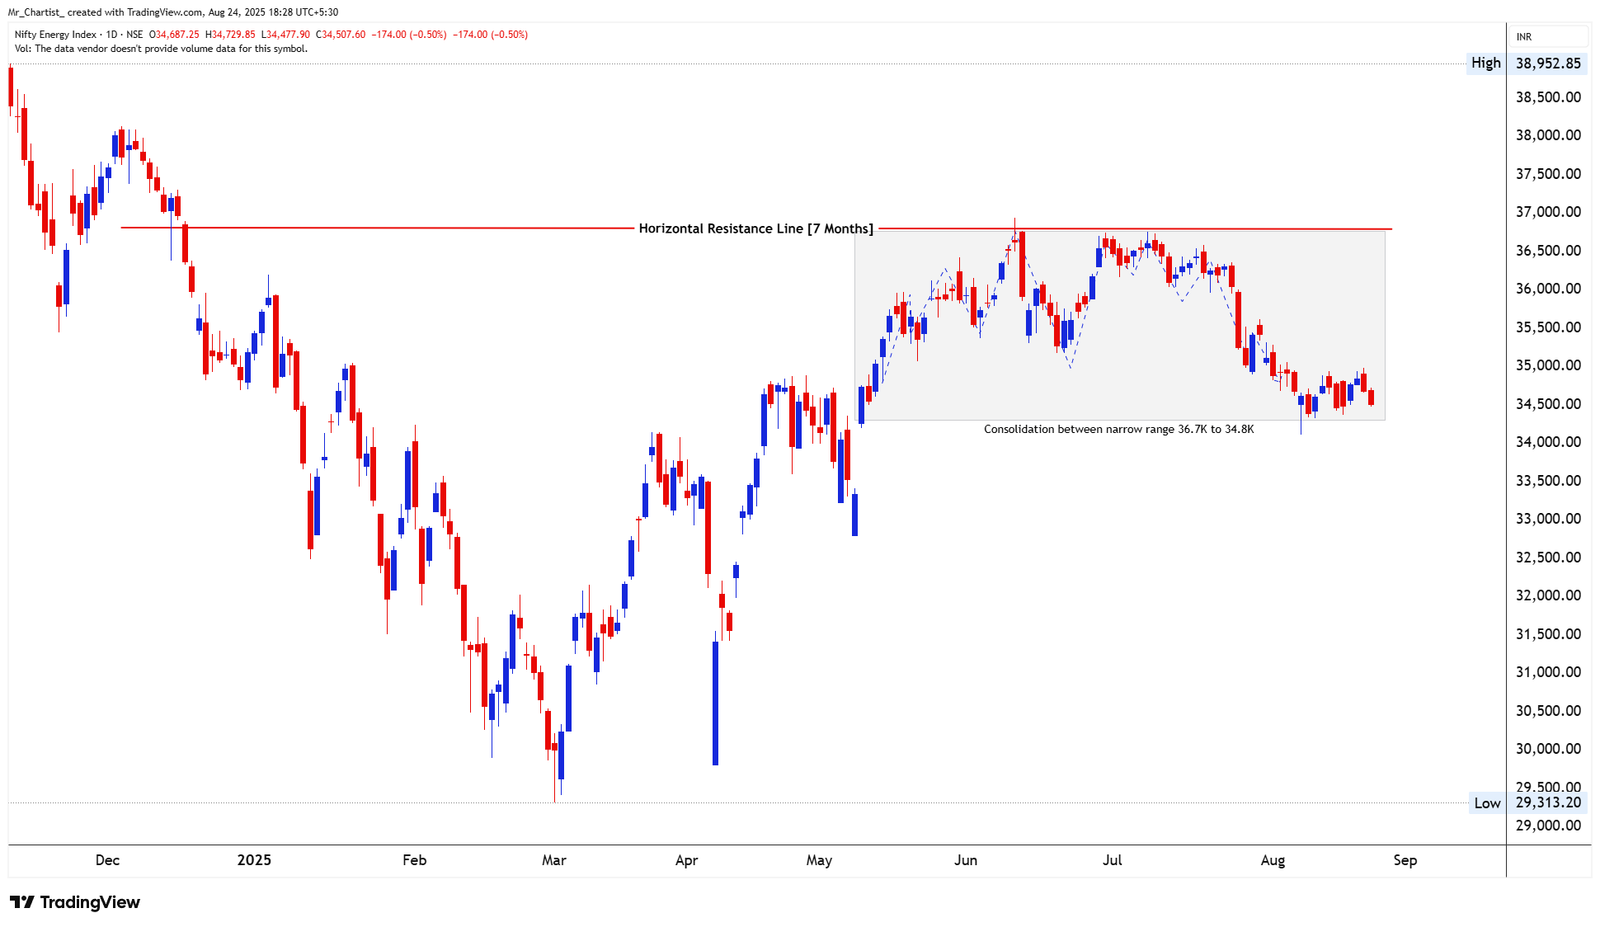
NIFTY FMCG INDEX
charts to-watchSymmetrical Triangle Pattern
10 Months (Daily Chart – Consolidation Phase)
Thesis & Analysis
The Nifty FMCG Index is currently forming a symmetrical triangle, developing over the past 10 months, with a series of lower highs and higher lows. This pattern signals consolidation and price compression before a potential directional breakout. Price recently tested the upper descending trendline near 57,000 but faced rejection, indicating resistance is still intact. The ascending support line from past lows around 54,000–54,500 remains protected and is currently acting as a base. This structure is coiling toward the apex, suggesting a breakout or breakdown is likely in the coming sessions. A breakout above 57,000 would confirm bullish intent, while a breakdown below 54,000 would negate the setup and may trigger a new downtrend. Candlestick Behavior: Recent candles show price rejection from the resistance line. Wick-heavy candles near highs indicate supply pressure at 57,000. Multiple supports held at 54,200–54,500 range in the past. 2. Crucial Support and Resistance Levels Support Zones: 54,200–54,500 – Key ascending support and bounce zone. 54,000 – Breakdown confirmation zone. 52,500 – Lower support and prior demand area. Resistance Zones: 57,000 – Triangle resistance; breakout point. 58,500 – Post-breakout resistance zone. 60,000+ – Prior breakdown zone from broader trend. 3. Strategic Trade Scenarios 🔸 Primary Setup – Breakout Above 57,000 A close above 57,000 would confirm a symmetrical triangle breakout. If supported by strong momentum, upside extension toward 58,500–60,000+ becomes likely. 🔹 Alternate Setup – Range-Bound Consolidation If the index continues to trade between 54,000–57,000, the triangle will remain valid, and price may remain choppy with no clear direction until breakout. ⚠️ Major Breakdown Risk: A decisive move below 54,000 would invalidate the triangle and likely lead to a drop toward 52,500 or lower, triggering short-term bearish sentiment.
Price Action
- ■Price action is structurally positive.
- ■Forming higher highs and higher lows.
Volume Profile
- ■Volume is supportive of the price action.
- ■Wait for volume expansion on breakout.
Key Levels
No zones specified
No zones specified
Invalidation Scenario
A weekly close below the support level invalidates this structure.
Nifty Energy Index
charts to-watchDouble Bottom Breakout
Daily Chart
Thesis & Analysis
No detailed thesis provided for this setup.
Price Action
- ■Price action is structurally positive.
- ■Forming higher highs and higher lows.
Volume Profile
- ■Volume is supportive of the price action.
- ■Wait for volume expansion on breakout.
Key Levels
No zones specified
No zones specified
Invalidation Scenario
A weekly close below the support level invalidates this structure.
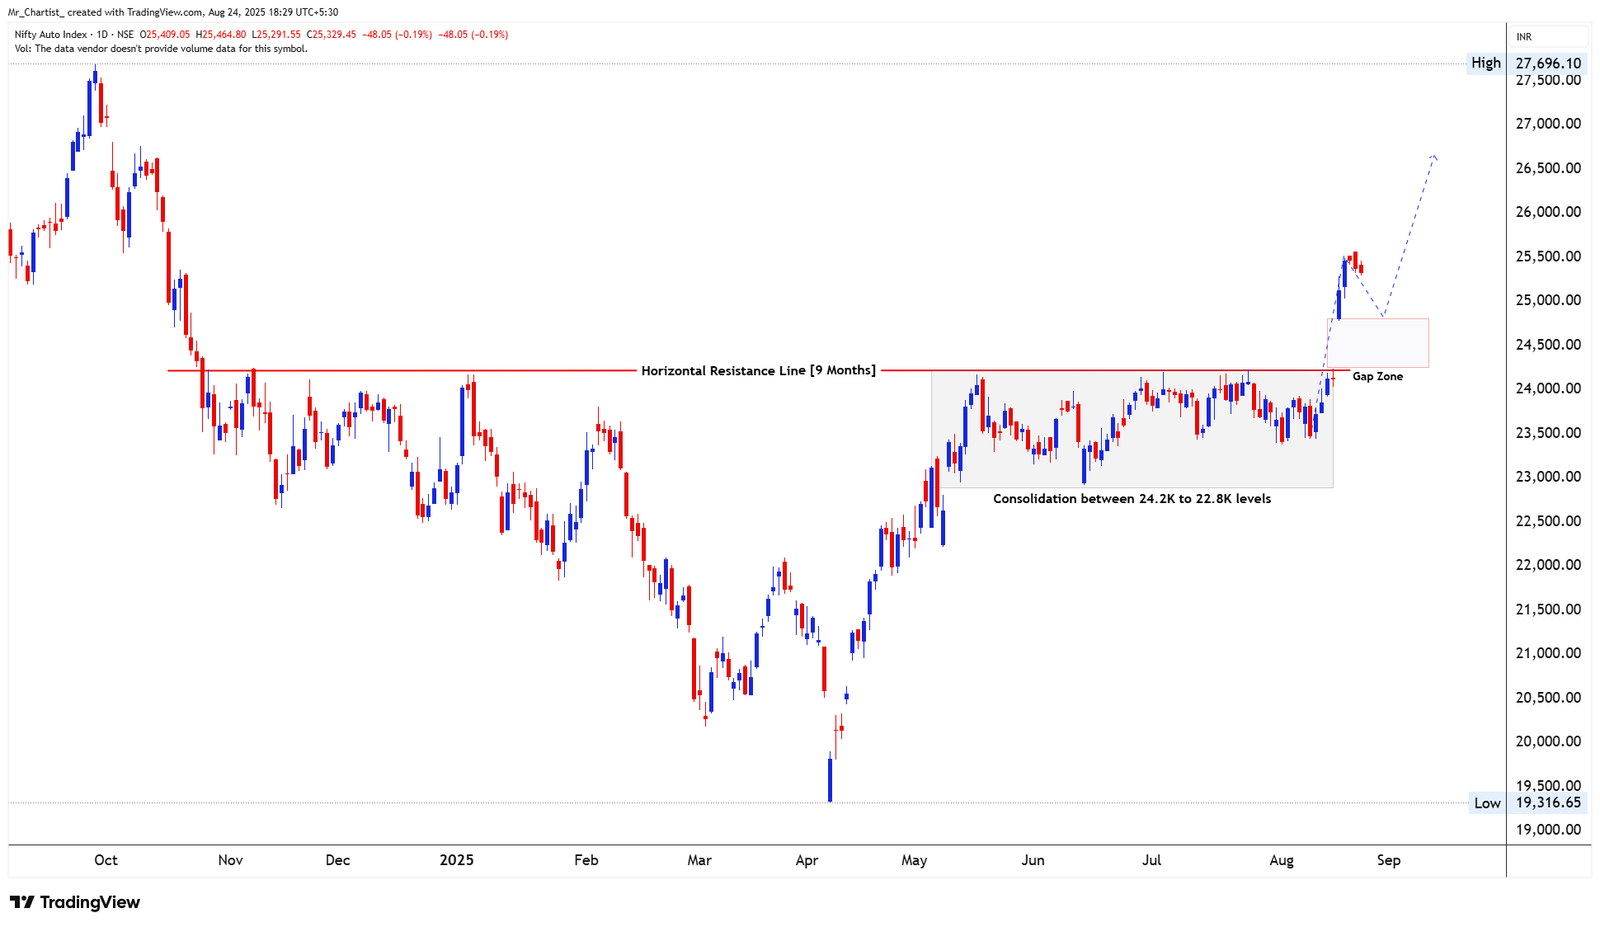
NIFTY ENERGY INDEX
charts to-watchHorizontal Range Consolidation
7 Months (Daily Chart – Neutral Sideways Phase)
Thesis & Analysis
The Nifty Energy Index has been moving within a narrow horizontal consolidation band for the past 7 months, with resistance near 36,700 and support around 34,800. Price action remains capped under the flat resistance line, with repeated rejections indicating supply pressure. On the downside, the support zone at 34,800 has absorbed multiple declines, maintaining the structure. This range-bound action is forming a compression box, and a breakout or breakdown from this band could lead to a directional expansion. Currently, the index is hovering near the lower edge of the range, showing signs of short-term weakness within the broader consolidation. Candlestick Behavior: Small-bodied candles dominate the current region, indicating indecision. Lack of strong bullish follow-through near support hints at weakening demand. No breakout or breakdown candle yet, keeping structure neutral. 2. Crucial Support and Resistance Levels Support Zones: 34,800 – Lower boundary of range; key short-term support. 34,000 – Breakdown trigger level; loss here may invite further weakness. 32,500 – Historical demand zone from earlier rally base. Resistance Zones: 36,700 – Horizontal range top; breakout trigger. 37,200–37,500 – Immediate post-breakout hurdle. 38,000+ – Extension target if momentum picks up. 3. Strategic Trade Scenarios 🔸 Primary Setup – Breakout Above 36,700 A sustained breakout above 36,700 would end the 7-month range and signal bullish intent. Upside could stretch toward 37,500–38,000+, especially if volume supports the move. 🔹 Alternate Setup – Sideways Continuation If price remains between 34,800–36,700, the range remains intact. Expect mean- reverting moves until a breakout or breakdown offers clarity. ⚠️ Major Breakdown Risk: If price closes below 34,000, it would breach the range floor decisively, turning sentiment bearish. In this case, decline toward 32,500 is likely.
Price Action
- ■Price action is structurally positive.
- ■Forming higher highs and higher lows.
Volume Profile
- ■Volume is supportive of the price action.
- ■Wait for volume expansion on breakout.
Key Levels
No zones specified
No zones specified
Invalidation Scenario
A weekly close below the support level invalidates this structure.
Nifty Auto Index
charts to-watchDouble Bottom Breakout
Daily Chart
Thesis & Analysis
No detailed thesis provided for this setup.
Price Action
- ■Price action is structurally positive.
- ■Forming higher highs and higher lows.
Volume Profile
- ■Volume is supportive of the price action.
- ■Wait for volume expansion on breakout.
Key Levels
No zones specified
No zones specified
Invalidation Scenario
A weekly close below the support level invalidates this structure.
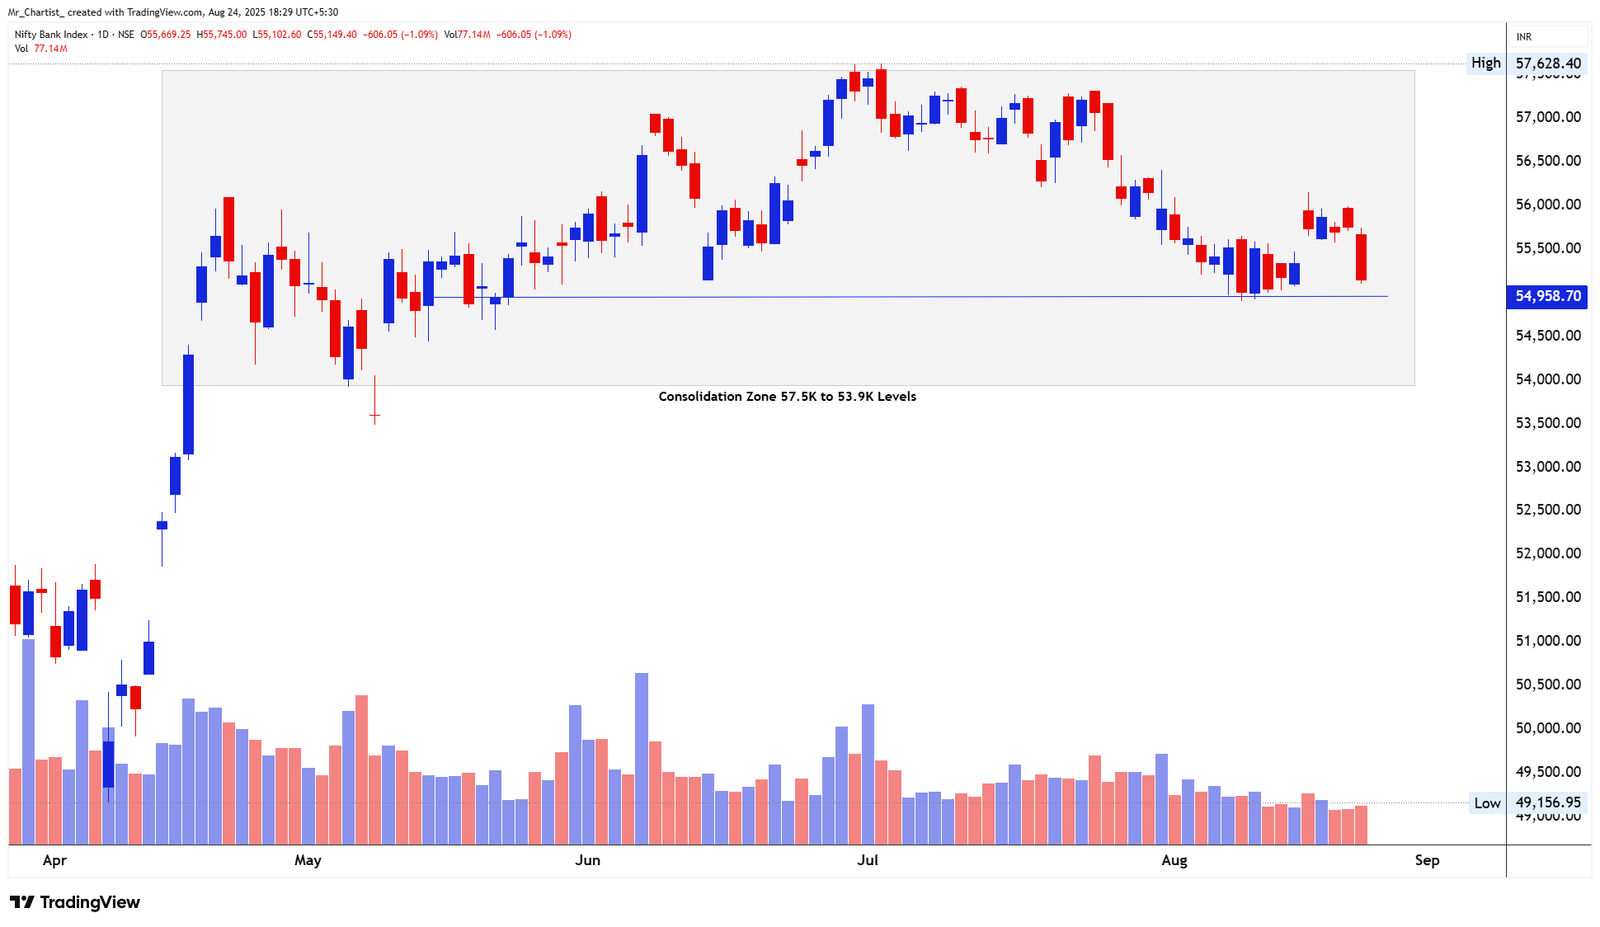
NIFTY AUTO INDEX
charts to-watchHorizontal Breakout with Gap Zone Retest
9 Months (Daily Chart – Consolidation Breakout)
Thesis & Analysis
The Nifty Auto Index has successfully broken out of a 9-month horizontal consolidation zone, with the breakout level around 24,200. Prior to the breakout, price was range-bound between 22,800–24,200, creating a prolonged base structure. Post-breakout, the index witnessed a strong upward thrust and left behind a gap zone between 24,500–24,800, which is now likely to act as a support base on any retest. Currently, price is experiencing a mild pullback after the rally, and a controlled retest of the gap zone would be a healthy technical development. If this support holds, the move could resume toward 26,500+ levels. Candlestick Behavior: Strong bullish candles led the breakout, followed by smaller retracement candles. No reversal patterns seen yet; mild dip after momentum burst. Wick rejections near 25,500 hint at temporary supply but not strong resistance yet. 2. Crucial Support and Resistance Levels Support Zones: 24,500–24,800 – Gap zone and immediate retest area. 24,200 – Former breakout point and strong structural support. 23,500 – Mid-consolidation pivot from previous base. Resistance Zones: 25,800–26,000 – Short-term resistance band. 26,500 – Measured breakout extension zone. 27,000+ – Psychological and historical congestion area. 3. Strategic Trade Scenarios 🔸 Primary Setup – Retest and Rally from Gap Zone If price dips into the 24,500–24,800 range and holds, a fresh leg upward toward 26,000–26,500 could unfold. A bullish engulfing or breakout candle from this zone would strengthen the case. 🔹 Alternate Setup – Failed Gap Hold and Reversion If price fails to hold above 24,500, a deeper pullback toward 24,200 or even 23,500 could materialize, converting the breakout into a false move. ⚠️ Major Breakdown Risk: A sustained close below 24,200 would invalidate the breakout and signal breakdown risk back into the prior range, turning structure bearish.
Price Action
- ■Price action is structurally positive.
- ■Forming higher highs and higher lows.
Volume Profile
- ■Volume is supportive of the price action.
- ■Wait for volume expansion on breakout.
Key Levels
No zones specified
No zones specified
Invalidation Scenario
A weekly close below the support level invalidates this structure.
Nifty Bank Index
charts to-watchDouble Bottom Breakout
Daily Chart
Thesis & Analysis
No detailed thesis provided for this setup.
Price Action
- ■Price action is structurally positive.
- ■Forming higher highs and higher lows.
Volume Profile
- ■Volume is supportive of the price action.
- ■Wait for volume expansion on breakout.
Key Levels
No zones specified
No zones specified
Invalidation Scenario
A weekly close below the support level invalidates this structure.
Chart Image Not Extracted
NIFTY BANK INDEX
charts to-watchHorizontal Consolidation Range
5 Months (Daily Chart – Sideways Structure)
Thesis & Analysis
Nifty Bank Index has remained locked in a consolidation band between 57,500 and 53,900 for over five months. Despite several attempts, neither bulls nor bears have been able to assert dominance, keeping the index in a tight congestion zone. Price is now once again testing the lower boundary of the range near 54,950, where multiple previous supports have held. A decisive close below this level could signal a breakdown and trigger further weakness. On the upside, the 57,500 mark continues to act as a ceiling, rejecting several breakout attempts. Until a clear directional move emerges, range-bound trading is likely to continue. Candlestick Behavior: Current candles show consistent selling near the bottom of the range. Today’s red candle is notable, testing key support on increased volume. Price has not yet broken down, but structure is fragile. Volume Analysis: Recent increase in red volume bars near support indicates distribution pressure. Bullish rebounds from lower band in past have been accompanied by moderate volume. Breakdown confirmation would require sustained volume above recent average (~75M+). 2. Crucial Support and Resistance Levels Support Zones: 54,950 – Immediate support; bottom of the consolidation range. 53,900 – Breakdown trigger zone; breach may accelerate downside. 52,000 – Historical demand and potential support zone post-breakdown. Resistance Zones: 56,500 – Mid-range resistance level. 57,500 – Range ceiling and key breakout trigger. 58,500+ – Momentum zone if breakout sustains above range.
Price Action
- ■Price action is structurally positive.
- ■Forming higher highs and higher lows.
Volume Profile
- ■Volume is supportive of the price action.
- ■Wait for volume expansion on breakout.
Key Levels
No zones specified
No zones specified
Invalidation Scenario
A weekly close below the support level invalidates this structure.
Chart Image Not Extracted
NIFTY BANK INDEX
charts to-watchDouble Bottom Breakout
Daily Chart
Thesis & Analysis
No detailed thesis provided for this setup.
Price Action
- ■Price action is structurally positive.
- ■Forming higher highs and higher lows.
Volume Profile
- ■Volume is supportive of the price action.
- ■Wait for volume expansion on breakout.
Key Levels
No zones specified
No zones specified
Invalidation Scenario
A weekly close below the support level invalidates this structure.
SEBI Registered Research Analyst — INH000015297 (INVESTOLOGY). Investment in securities market are subject to market risks. Read all related documents carefully before investing. The content provided is for educational purposes only and should not be considered as financial advice. Past performance is not indicative of future results.