Chart Types — Complete Guide
From candlesticks to Heikin Ashi — choosing the right visualization for every analysis.
Mr. Chartist Workflow
Read with a trading desk mindset.
Every TradingView article now follows a practical pattern: understand the tool, map it to a charting workflow, apply it on Indian market instruments, and turn it into a repeatable workspace habit.
6
Sections
5m
Read
chart
Level
Open a clean chart and locate the exact TradingView area covered in "Chart Types — Complete Guide".
Apply it on one liquid NSE stock, one index, and one weekly timeframe so the concept is not learned in isolation.
Save the layout, write one note about what improved your decision-making, and remove anything that adds noise.
TradingView offers an industry-leading arsenal of 21 distinct chart types. While 17 of these are available entirely for free, advanced institutional order-flow charts like Volume Footprint and TPO are reserved for Premium and Expert users.
A chart is not just a picture of price; it is a lens. Choosing the right visualization determines what information is amplified and what market noise is filtered out. In this guide, we break down the four major categories of TradingView charts—Standard, Line, Japanese, and Order Flow—and explain exactly when professional traders use each.
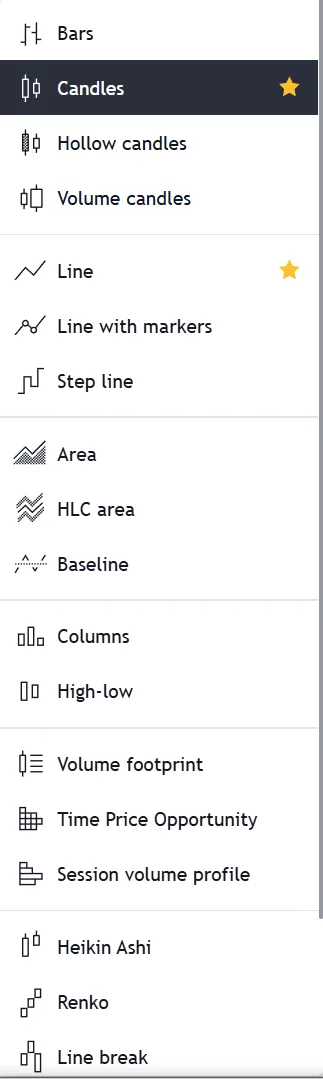
1. The 21 Chart Types Universe
TradingView's charting library is categorized into two fundamental data models: Time-Based charts and Price-Based charts.
Time-Based charts (like Candlesticks and Bars) print a new data point at a fixed time interval, regardless of whether the price moved. Price-Based charts (like Renko and Point & Figure) ignore time completely, printing a new data point only when the asset moves a specific distance.
Understanding this distinction is the first step in moving beyond basic technical analysis and into advanced market geometry.

Alt+H
2. The Foundation: Candlesticks & Bars
Japanese Candlesticks are the undisputed global standard for modern trading. They pack the maximum amount of information—Open, High, Low, and Close (OHLC)—into an intuitively readable format that immediately conveys the session's battle between buyers and sellers.
Hollow Candles offer a slight variation: they use solid vs. hollow bodies to differentiate between sessions where the close was higher than the open, versus sessions where the close was higher than the previous day's close. This nuanced difference helps traders identify weak rallies.
Traditional Bars contain the exact same OHLC data as candlesticks but emphasize the closing price (the right tick) over the body. Institutional traders often prefer Bars because they strip away the emotional bias created by large colored candlestick bodies.
Japanese Candlesticks
- Industry standard for modern technical analysis.
- Essential for reading price action patterns (Doji, Engulfing).
- Clearly shows the 'wicks' representing price rejection.
Hollow Candles
- Differentiates absolute vs relative closing strength.
- Solid green = closed higher than open, but lower than yesterday.
- Hollow green = closed higher than open AND yesterday.
Traditional Bars
- Left tick = Open; Right tick = Close.
- Removes the visual 'weight' of large candlestick bodies.
- Preferred by classical chartists (e.g., Wyckoff practitioners).
For 95% of active day trading in the Indian Equities and F&O markets, standard Japanese Candlesticks should remain your primary chart type.
3. Macro Trends: Line, Area & Baseline
When analyzing massive historic trends on a Weekly or Monthly timeframe, Candlesticks can actually provide too much information, causing 'analysis paralysis' from intraday volatility wicks.
Line and Area charts solve this by plotting only the closing prices. Because closing prices are the most important data point of the day (representing the final consensus of market participants), Line charts offer the purest visualization of the underlying macro trend.
Baseline charts take this a step further by allowing you to define a specific anchor price (e.g., the pre-COVID high). The chart will color the area green when trading above the baseline, and red when trading below it, providing instant visual context of relative performance.
Snapshot & Takeaways
Professional Tip
Switch to a Line chart when you are struggling to find clean Support & Resistance zones. Candlestick wicks often obscure clean structural levels that are obvious on a Line chart.
4. Noise Reduction: Japanese & Price-Based Charts
This category contains advanced chart types designed specifically to filter out 'market noise'—meaningless sideways chop that triggers false breakouts.
Heikin Ashi (Japanese for 'average bar') modifies traditional candlesticks by averaging the current and prior session's data. The result is a profoundly smooth chart where strong uptrends are painted as a continuous series of green candles with no lower wicks, making it incredibly easy to ride a trend without getting shaken out.
Renko, Kagi, and Point & Figure charts go a step further: they completely eliminate Time from the X-axis. A new Renko 'brick' is only drawn when the price moves a predefined amount (e.g., 10 points). If the price chops sideways for 5 hours within a 9-point range, the Renko chart will not draw anything, effectively deleting the chop from your screen.
Heikin Ashi (Averaged)
- Time-based, but mathematically smoothed.
- Excellent for trend-following and swing trading.
- WARNING: Do not use for precise entry/exit levels.
Renko (Bricks)
- Purely price-based. Ignores time entirely.
- New brick forms only when a fixed point threshold is met.
- Completely eliminates sideways consolidation noise.
5. Institutional Grade: Volume Footprint & TPO
The highest echelon of TradingView chart types is reserved for Premium and Expert users. These charts integrate Order Flow and Volume Distribution directly into the price structure, revealing the 'why' behind the price movement.
A Volume Footprint chart physically cracks open a candlestick to show you exactly how many contracts were bought at the Ask (aggressive buyers) vs sold at the Bid (aggressive sellers) at every single price tick inside that candle. This allows scalpers to spot 'imbalances' and trapped traders in real-time.
Time Price Opportunity (TPO), also known as Market Profile, generates a statistical bell curve of where price spent the most time during a session. It highlights the Point of Control (POC) and Value Areas—critical zones where institutional players are accumulating or distributing inventory.
| Features | TradingView | Traditional Brokers |
|---|---|---|
| Volume Footprint | Premium / Expert | Shows Bid/Ask delta inside the candle |
| TPO (Market Profile) | Premium / Expert | Shows time distribution across price levels |
| Session Volume Profile | Premium / Expert | Shows volume distribution histogram per session |
Critical Warning
Volume Footprint, TPO, and Session Volume Profile charts require a Premium or Expert plan.
Critical Warning
Order flow charts require Real-Time tick data to function accurately. Ensure you have purchased the relevant NSE/BSE data feeds if trading Indian markets.
6. Workflow Optimization: Starring Favorites
Just like timeframes, you don't need to constantly open the Chart Type dropdown menu. You can pin your most frequently used chart types directly to your top toolbar for one-click access.
Simply open the Chart Type selector, hover over your preferred styles (e.g., Candles, Line, Heikin Ashi), and click the Star (★) icon next to them.
The ultimate workflow: Use Candlesticks for entry triggers, Line charts for macro support/resistance, and Heikin Ashi for managing active swing trades.
Unlock TradingView Pro
Gain unrestricted access to multiple charts, custom timeframes, and unlimited technical indicators to perfect your edge.
Frequently Asked Questions
Common questions about this topic
TradingView supports 21 distinct chart types. This includes 17 free standard types (Candlesticks, Line, Heikin Ashi, Renko, etc.) and 4 advanced order-flow types (Volume Footprint, TPO, Session Volume Profile, Volume Candles) reserved for Premium and Expert plans.
Official TradingView Resources
Curated links from TradingView's Help Center & Blog
Strategy produces unrealistic results on non-standard chart types (Heikin Ashi, Renko, etc.)
On TradingView, strategies can be applied to any type of chart, including non-standard ones like Heikin Ashi (HA), Renko, Kagi, Point and Figure and R...
The color of bars or candlesticks is incorrect
You may have applied an indicator that paints the bars on the chart. Try hiding indicators on the chart to see if that's the case.If some bars are aut...
The Renko chart is not displayed or is displayed incorrectly
For the Renko chart to display correctly, it is important to select the appropriate box size. If the Renko chart is not displayed, most likely you hav...
The Renko chart shows incorrect values and/or is constantly being recalculated
How are Renko bricks calculated?On historical bars:TradingView and data suppliers cannot make available the complete historical tick data required to ...
Heikin Ashi meets Bar Replay: backtest smarter with smoother trends
Read fresh TradingView updates: Heikin Ashi meets Bar Replay: backtest smarter with smoother trends. Discover more in our blog and stay connected with the latest platform news.
Hollow Candles in one click
Read fresh TradingView updates: Hollow Candles in one click. Discover more in our blog and stay connected with the latest platform news.
New Candlestick Patterns, Now All in One Place
Read fresh TradingView updates: New Candlestick Patterns, Now All in One Place. Discover more in our blog and stay connected with the latest platform news.
New chart type added: Columns
Read fresh TradingView updates: New chart type added: Columns. Discover more in our blog and stay connected with the latest platform news.
Related Articles
Continue your learning journey
Symbol Search & Timeframes
Finding any asset instantly and mastering multi-timeframe analysis.
ModuleIndicators, Metrics & Strategies
Your complete technical analysis toolkit — from moving averages to Pine Script.
ModuleCompare Feature & Overlay Analysis
Relative strength, correlation analysis, and pairs trading using the Compare tool.
ModuleTop Menu & Account Basics
Navigating the control panel — profile settings, home, help center, and dark mode.

Written By
Rohit Singh
Mr. Chartist
With 14+ years of experience in Indian financial markets, Rohit Singh (Mr. Chartist) is a SEBI Registered Research Analyst, Amazon #1 bestselling author, and the founder of Investology — a premium trading ecosystem trusted by a 1.5 Lakh+ strong community across India.
TradingView is a registered trademark of TradingView, Inc. All screenshots, logos, and platform imagery are the property of TradingView, Inc. and are used here for educational purposes only under fair use. This content is not affiliated with, endorsed, or sponsored by TradingView.
(c) 2026 TradingView, Inc. All rights reserved. - www.tradingview.com