Symbol Search & Timeframes
Finding any asset instantly and mastering multi-timeframe analysis.
Mr. Chartist Workflow
Read with a trading desk mindset.
Every TradingView article now follows a practical pattern: understand the tool, map it to a charting workflow, apply it on Indian market instruments, and turn it into a repeatable workspace habit.
6
Sections
4m
Read
chart
Level
Open a clean chart and locate the exact TradingView area covered in "Symbol Search & Timeframes".
Apply it on one liquid NSE stock, one index, and one weekly timeframe so the concept is not learned in isolation.
Save the layout, write one note about what improved your decision-making, and remove anything that adds noise.
Navigating over 3,539,722 financial instruments across 70+ stock exchanges and 70+ crypto exchanges requires a search engine built specifically for speed. TradingView's Symbol Search and Timeframe management systems are designed to minimize the friction between thinking of a trade and executing the analysis.
Whether you are an intraday scalper requiring second-by-second data or a macro investor analyzing decades of history, mastering these two core functions is the foundation of a professional charting workflow. In this guide, we dive deep into advanced search syntax, Indian market specifics, custom intervals, and multi-timeframe optimization techniques used by institutional traders.
1. Symbol Search & The Universal Command Center
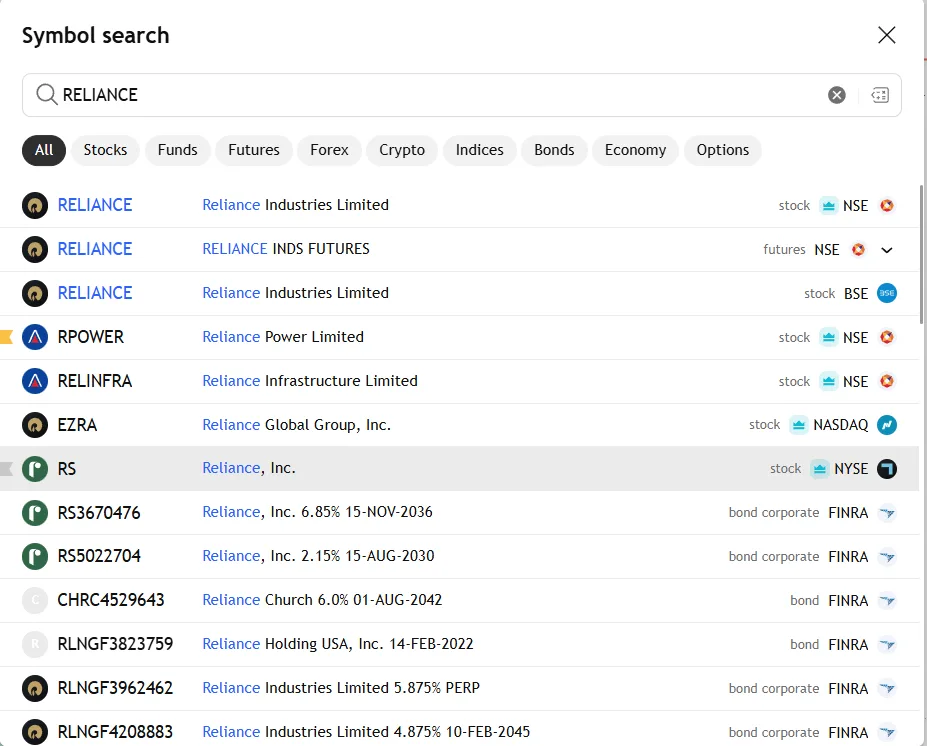
TradingView's Symbol Search is not just a ticker lookup — it's a comprehensive, fuzzy-logic search engine. You don't need to know the exact symbol; typing the company name (e.g., 'Reliance'), the sector, or the asset class will instantly yield highly relevant results. By default, you can open the search simply by typing any letter while viewing a chart.
The search interface is categorized into specific Asset Tabs (Stocks, Funds, Futures, Forex, Crypto, Indices, Bonds, and Economy). This categorization is crucial when dealing with symbols that share the same ticker across different markets (e.g., 'TATA' vs 'TATAMOTORS').
Beyond standard tickers, the Global Command Search (accessible via Ctrl+K / Cmd+K) transforms the search bar into a universal platform launcher. You can search for specific settings, indicators, drawing tools, or community ideas without ever touching the mouse.
Fuzzy Logic & Descriptions
- Matches against company descriptions, not just tickers.
- Recognizes aliases and historical names.
- Filters results instantly as you type.
Asset Class Filtering
- Isolate searches to specific markets (e.g., Crypto only).
- Economy tab for macro data (GDP, inflation rates).
- Funds tab specifically for ETFs and Mutual Funds.
Mathematical Spread Charts
- Type 'NSE:TCS / NSE:NIFTY' to plot a relative strength ratio.
- Use +, -, *, / to create custom synthetic assets.
- Essential for pair trading and arbitrage analysis.
Global Command Search
- Press Ctrl+K (Windows) or Cmd+K (Mac).
- Search for 'Dark Mode', 'RSI', or 'Log Scale'.
- Eliminates menu diving entirely.
Just type: Start typing any letter on the chart to open Symbol Search · Ctrl+K: Global Command Search
2. Precision Routing: NSE, BSE & MCX Data
For Indian traders, understanding Exchange Prefixes is critical to avoiding analysis errors. Because the same company may be listed on multiple exchanges globally, you should habitually prefix your searches with the exchange code. For instance, typing `NSE:RELIANCE` guarantees you are looking at the National Stock Exchange listing, whereas just `RELIANCE` might bring up a US-listed ADR or a similarly named international stock.
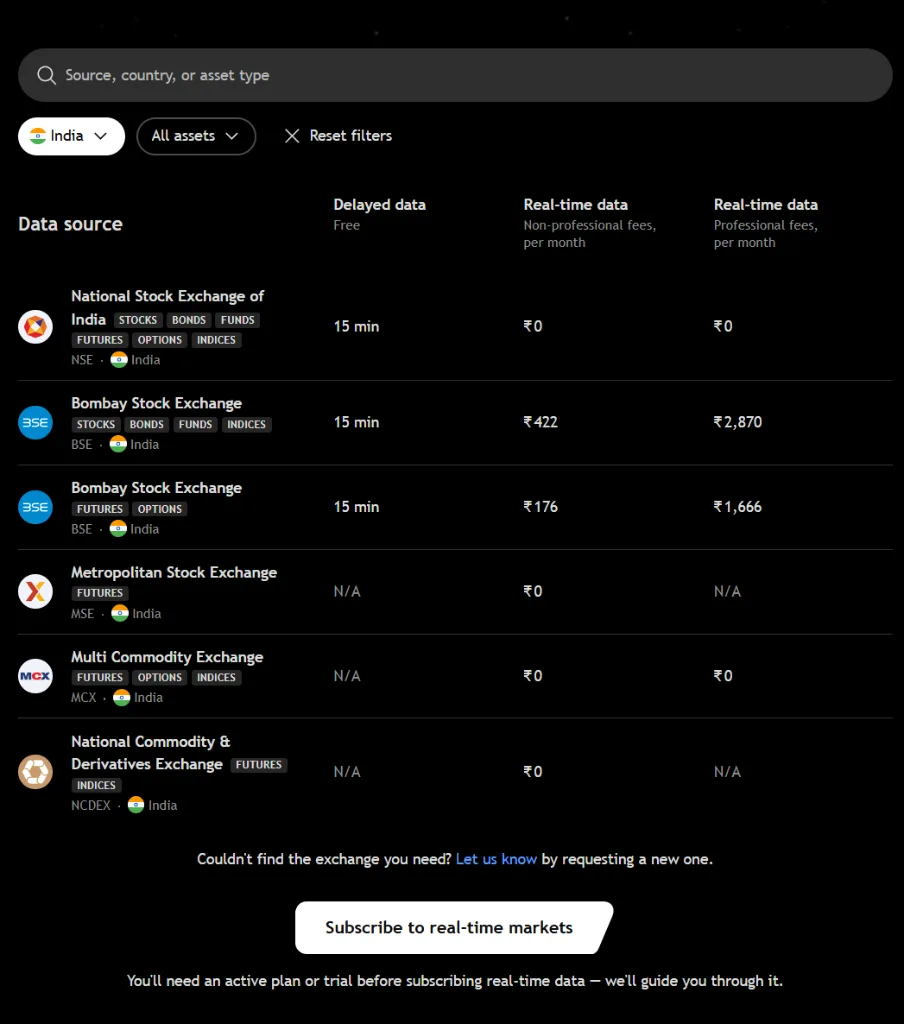
TradingView provides comprehensive coverage of the Indian markets, including NSE (Equities, Indices, F&O), BSE (Equities, SMEs), and MCX (Commodities like Gold, Crude, Natural Gas).
It is vital to understand the difference between Delayed and Real-Time data. By default, some exchange data (depending on current exchange policies) may be delayed by 15 minutes for non-subscribers. If your chart shows an orange 'D' icon next to the symbol name, you are viewing delayed data. To get tick-by-tick real-time updates, you must purchase the specific exchange data add-on from your TradingView account settings.
NSE (National Stock Exchange)
- Prefix: 'NSE:'
- Example: 'NSE:INFY' (Infosys)
- Coverage: Equities, Futures & Options, Indices.
BSE (Bombay Stock Exchange)
- Prefix: 'BSE:'
- Example: 'BSE:RELIANCE'
- Coverage: Equities, Indices, SME Segment.
MCX (Multi Commodity Exchange)
- Prefix: 'MCX:'
- Example: 'MCX:GOLD1!' (Current Gold Futures)
- Coverage: Bullion, Energy, Base Metals.
Real-Time Market Data
- Look for the green pulsing dot (Live) vs orange 'D' (Delayed).
- Available as inexpensive add-ons in Account Settings.
- Requires filling out a Non-Professional exchange agreement.
Change interval
15 minutes
Always use exchange prefixes (NSE:, BSE:, MCX:) to guarantee data accuracy. Precision in analysis begins with precision in data selection.
Critical Warning
NSE real-time data is available on the free plan with a slight delay. For true real-time data, an exchange data subscription is required.
Critical Warning
Never day-trade if you see the orange 'D' icon next to the ticker symbol. Ensure you have subscribed to the real-time data feeds for NSE and MCX through your account portal.
3. Time Intervals & The Master Dropdown
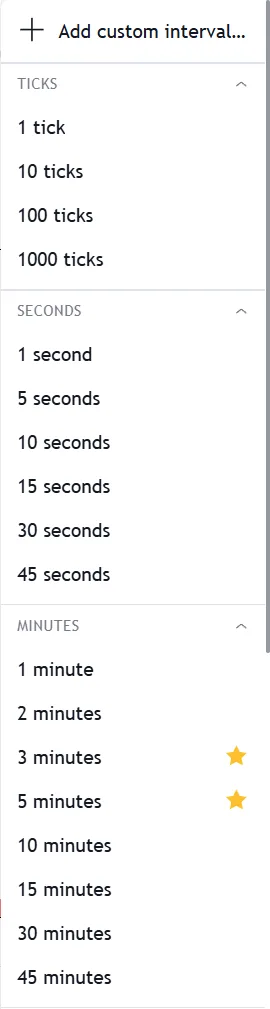
In TradingView, the 'Time Frame' or 'Interval' dictates the aggregation of price data into a single candle or bar. The Master Dropdown menu (accessible via the top toolbar or by pressing comma `,`) categorizes intervals logically into Ticks, Seconds, Minutes, Hours, Days, and Ranges.
The standard Free plan provides access to the essential intervals used by 90% of traders (1m, 5m, 15m, 1H, 4H, Daily, Weekly, Monthly). Paid plans unlock extreme granularity, such as tick-by-tick charts for order flow analysis, and custom structural intervals.
The most critical feature of the timeframe menu is the 'Favorites' system. By hovering over any interval in the dropdown and clicking the Star (★) icon, that specific timeframe is permanently pinned to your top toolbar. Professional traders use this to switch between their core timeframes instantly.
| Features | TradingView | Traditional Brokers |
|---|---|---|
| Standard Intervals (1m to Monthly) | Available on Free Plan | Available |
| Custom Intervals (e.g., 7m, 3-day) | Essential Plan & Above | Rarely supported |
| Second-based Charts (1s, 5s, 15s) | Premium & Ultimate Plans | Specialized platforms only |
| Tick-based Charts (1 to 1000 ticks) | Ultimate Plan Only | Requires expensive institutional software |
| Range Bars (Price-based, no time) | Plus Plan & Above | Limited support |
Professional Tip
Indian F&O Traders: Star the 3m, 5m, 15m, 1H, and 1D timeframes. This specific combination covers scalping (3m/5m), intraday structure (15m), daily trend bias (1H), and macro context (1D).
4. The Speed Layer: Quick Input & Custom Intervals
TradingView's most powerful speed hack is the Quick-Change interval system. You do not need to click the timeframe dropdown. If you want a 15-minute chart, simply type the number '15' directly on your keyboard while viewing the chart, and press Enter.
This system supports alphanumeric suffixes for higher timeframes. Typing '1D' loads the Daily chart. Typing '1W' loads the Weekly chart. Typing '30S' loads the 30-second chart (on Premium plans).
If you are on an Essential plan or higher, this same input method creates Custom Intervals. Typing '45' creates a custom 45-minute chart. Typing '2D' creates a 2-Day chart. These custom intervals allow you to filter out noise and align your charts perfectly with unique trading strategies.
Change interval
15 minutes
Quick Input Syntax
- Type '5' → 5-minute chart
- Type '1D' → Daily chart
- Type '1W' → Weekly chart
- Type '1M' → Monthly chart
Custom Interval Logic
- Requires Essential plan or higher.
- Can combine any integer with an interval type.
- Examples: '123' (123 min), '3D' (3 Days).
Change interval
15 minutes
5. Professional Multi-Timeframe Analysis (MTA)
Multi-Timeframe Analysis (MTA) is the practice of analyzing the same asset across different intervals simultaneously to ensure alignment between macro trends and micro entries. TradingView facilitates MTA through Multi-Chart Layouts and Advanced Visibility settings.
Drawing Visibility: One of the biggest challenges in MTA is chart clutter. If you draw a thick macro support line on the Weekly chart, it will look overwhelmingly large on a 1-minute chart. By right-clicking any drawing and selecting 'Settings → Visibility', you can specifically define which timeframes that drawing appears on. Professional traders typically restrict daily/weekly levels from appearing on sub-15-minute charts.
Indicator Resolution (MTF Indicators): Many built-in and community indicators support Multi-Timeframe Resolution. Inside the indicator settings, you can change the 'Timeframe' dropdown. This allows you to, for example, plot a Daily 200 Moving Average onto a 15-minute chart, providing a high-timeframe dynamic support level while you trade the intraday price action.
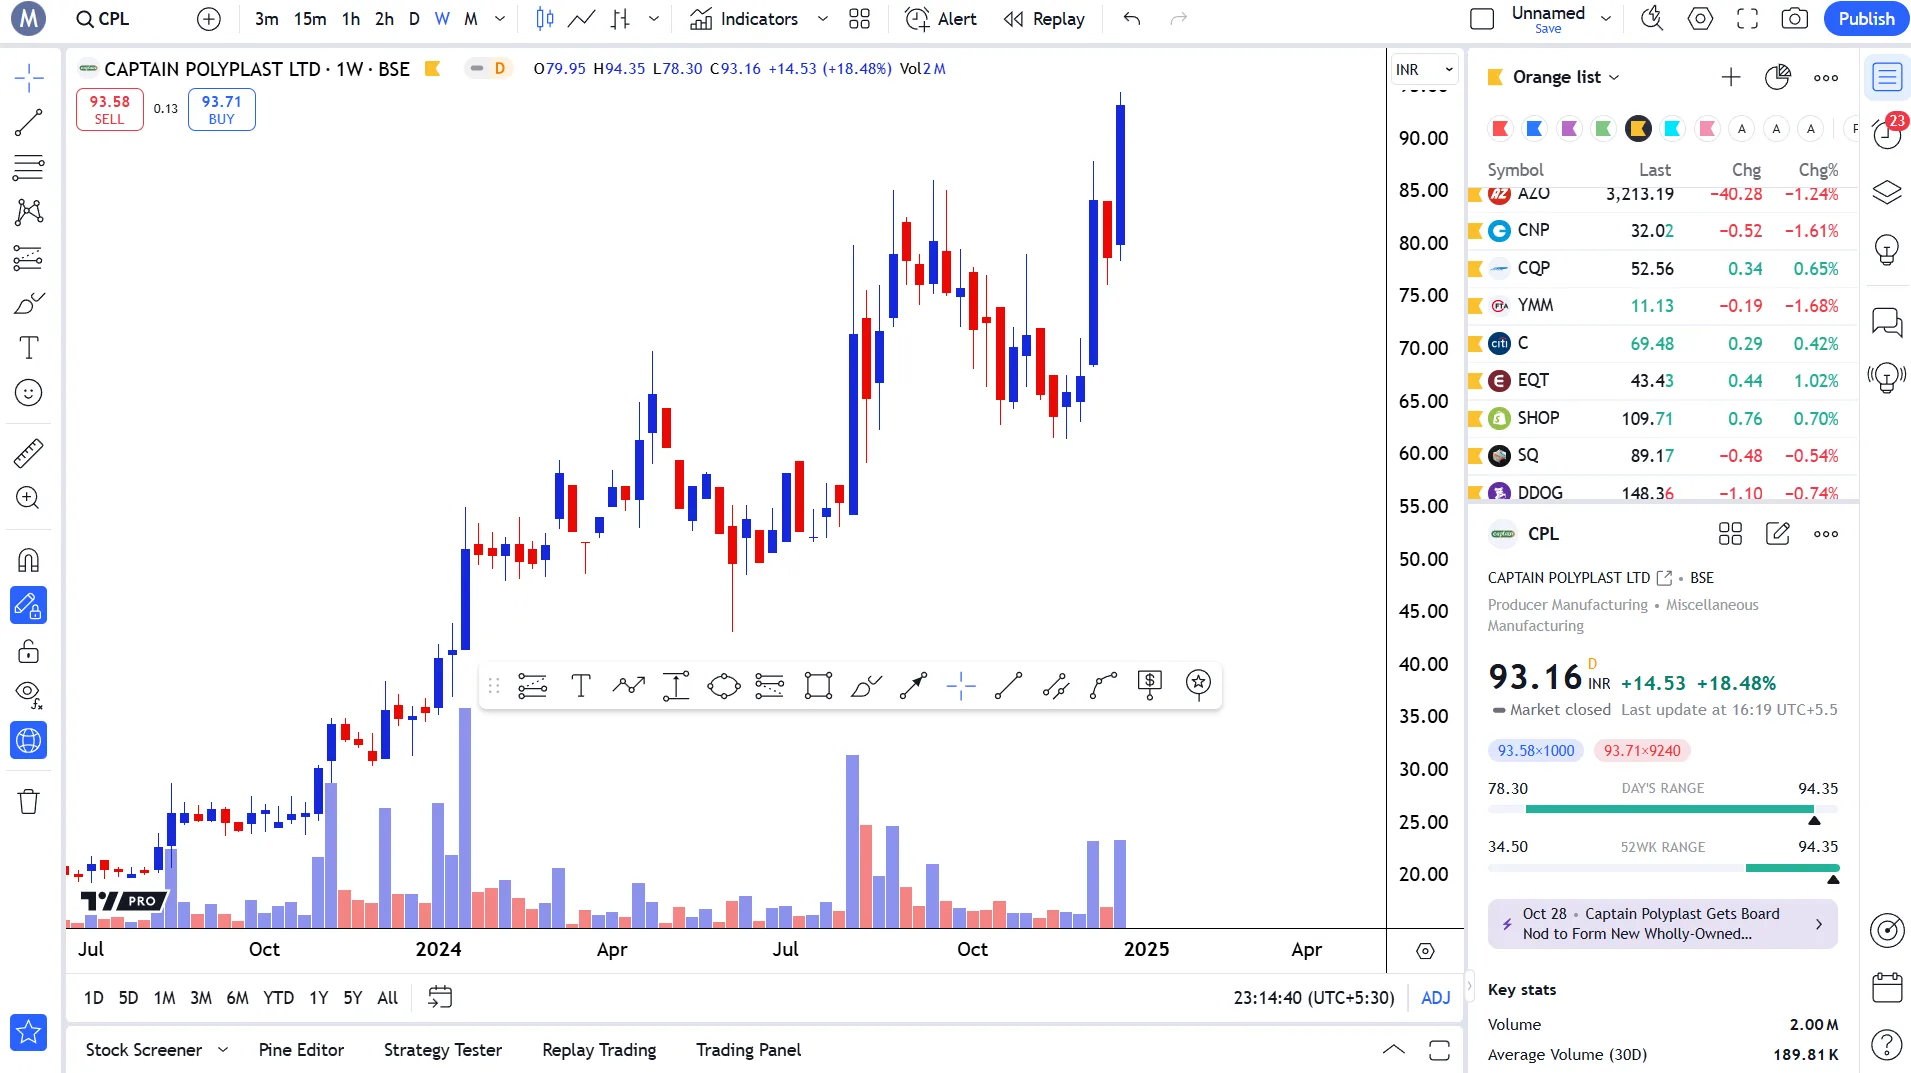
Chart clarity is an edge. Use Visibility settings to filter out macro drawings from your micro execution charts, ensuring you only see what is relevant to the current timeframe.
Snapshot & Takeaways
6. Bottom Date Ranges — The Macro Navigator
At the very bottom of the Supercharts interface sits the Date Range navigator. This often-overlooked bar contains presets like 1D, 5D, 1M, YTD, 1Y, and All. These are not timeframes (candle intervals) — they are Zoom Ranges.
Clicking 'YTD' (Year-To-Date) will instantly zoom out to show the entire year's price action, automatically calculating and applying the most appropriate candle interval (usually Daily) to fit the data perfectly on screen.
The Calendar Icon (Go To Date) located in this bar is essential for backtesting and historical review. Clicking it allows you to jump directly to a specific historical date (e.g., 'Take me to the exact day of the COVID crash in March 2020') without endlessly scrolling backward through the chart.

Intraday & Swing Ranges
- 1D / 5D: Zooms to the current day or week (auto-sets to minute intervals).
- 1M / 3M / 6M: Zooms to recent months (auto-sets to hourly/daily intervals).
Macro & Go-To Ranges
- YTD: Year to date, essential for checking annual performance.
- All: Shows the entire trading history of the asset.
- Calendar Icon: Jump instantly to any exact historical date.
Unlock TradingView Pro
Gain unrestricted access to multiple charts, custom timeframes, and unlimited technical indicators to perfect your edge.
Frequently Asked Questions
Common questions about this topic
The most precise way is to use the exchange prefix. Type 'NSE:RELIANCE' for the National Stock Exchange listing, or 'BSE:RELIANCE' for the Bombay Stock Exchange listing. You can also simply type the company name, and TradingView's fuzzy search will show you all related listings across different exchanges. Ensure you click the correct one with the Indian flag icon.
Official TradingView Resources
Curated links from TradingView's Help Center & Blog
Median block interval
What is "Median block interval"?The median time in seconds between consecutive blocks, defined as the central value of the interval distribution over ...
Lines become non-parallel when switching interval
Drawings that are parallel when applied to an interval, might be non-parallel on another one — this is expected.For example, we added 2 parallel lines...
Drawings are passing through different points on another interval
Drawings may be displayed differently on various time intervals of the same symbol. One of the reasons for that is that lower time frame contains more...
How to set drawing visibility on different intervals
Open the drawing object settings, select Visibility tab and enable intervals where the drawing will be displayed....
Alerts Are Now Available for Second Resolutions
Read fresh TradingView updates: Alerts Are Now Available for Second Resolutions. Discover more in our blog and stay connected with the latest platform news.
Bar Replay Now Supports Second-Based Resolutions
Read fresh TradingView updates: Bar Replay Now Supports Second-Based Resolutions. Discover more in our blog and stay connected with the latest platform news.
Bar Replay Now Supports Switching Timeframes While Replaying
Read fresh TradingView updates: Bar Replay Now Supports Switching Timeframes While Replaying. Discover more in our blog and stay connected with the latest platform news.
Countdown is now available on any time interval!
Read fresh TradingView updates: Countdown is now available on any time interval!. Discover more in our blog and stay connected with the latest platform news.
Related Articles
Continue your learning journey
Top Menu & Account Basics
Navigating the control panel — profile settings, home, help center, and dark mode.
ModuleChart Types — Complete Guide
From candlesticks to Heikin Ashi — choosing the right visualization for every analysis.
ModuleCompare Feature & Overlay Analysis
Relative strength, correlation analysis, and pairs trading using the Compare tool.
ModuleIndicators, Metrics & Strategies
Your complete technical analysis toolkit — from moving averages to Pine Script.
ModuleDesktop App & Pro Workspaces
Multi-monitor setups, tab linking, crosshair sync, and desktop-exclusive performance features.

Written By
Rohit Singh
Mr. Chartist
With 14+ years of experience in Indian financial markets, Rohit Singh (Mr. Chartist) is a SEBI Registered Research Analyst, Amazon #1 bestselling author, and the founder of Investology — a premium trading ecosystem trusted by a 1.5 Lakh+ strong community across India.
TradingView is a registered trademark of TradingView, Inc. All screenshots, logos, and platform imagery are the property of TradingView, Inc. and are used here for educational purposes only under fair use. This content is not affiliated with, endorsed, or sponsored by TradingView.
(c) 2026 TradingView, Inc. All rights reserved. - www.tradingview.com