Top Menu & Account Basics
Navigating the control panel — profile settings, home, help center, and dark mode.
Mr. Chartist Workflow
Read with a trading desk mindset.
Every TradingView article now follows a practical pattern: understand the tool, map it to a charting workflow, apply it on Indian market instruments, and turn it into a repeatable workspace habit.
10
Sections
4m
Read
chart
Level
Open a clean chart and locate the exact TradingView area covered in "Top Menu & Account Basics".
Apply it on one liquid NSE stock, one index, and one weekly timeframe so the concept is not learned in isolation.
Save the layout, write one note about what improved your decision-making, and remove anything that adds noise.
The Top Menu in TradingView is your mission-critical command bar — a dense, horizontally-arranged toolbar that sits at the very top of the Supercharts interface. Every action you perform repeatedly — switching symbols, changing timeframes, adding indicators, setting alerts, managing layouts — originates from this single bar.
Mastering the Top Menu is non-negotiable for serious chartists. It is the cockpit of a platform used by 100M+ traders across 180+ countries, and understanding every button, dropdown, and hidden shortcut here will dramatically accelerate your workflow. This guide breaks down every element from left to right, including the Account Menu, so you never have to guess where a feature lives.
1. Anatomy of the Top Menu — Left to Right
The TradingView Top Menu is divided into two logical zones: the Left Zone (chart-related controls — symbol, timeframe, chart type, indicators, alerts) and the Right Zone (workspace-level controls — layouts, settings, snapshots, and account menu). Understanding this spatial layout builds muscle memory that compounds over time.
Every element on this toolbar is context-sensitive — the options you see will adapt based on your current subscription plan, connected broker, and active chart state. Free plan users will see certain buttons greyed out or labeled with a crown icon (👑), indicating a paid feature.
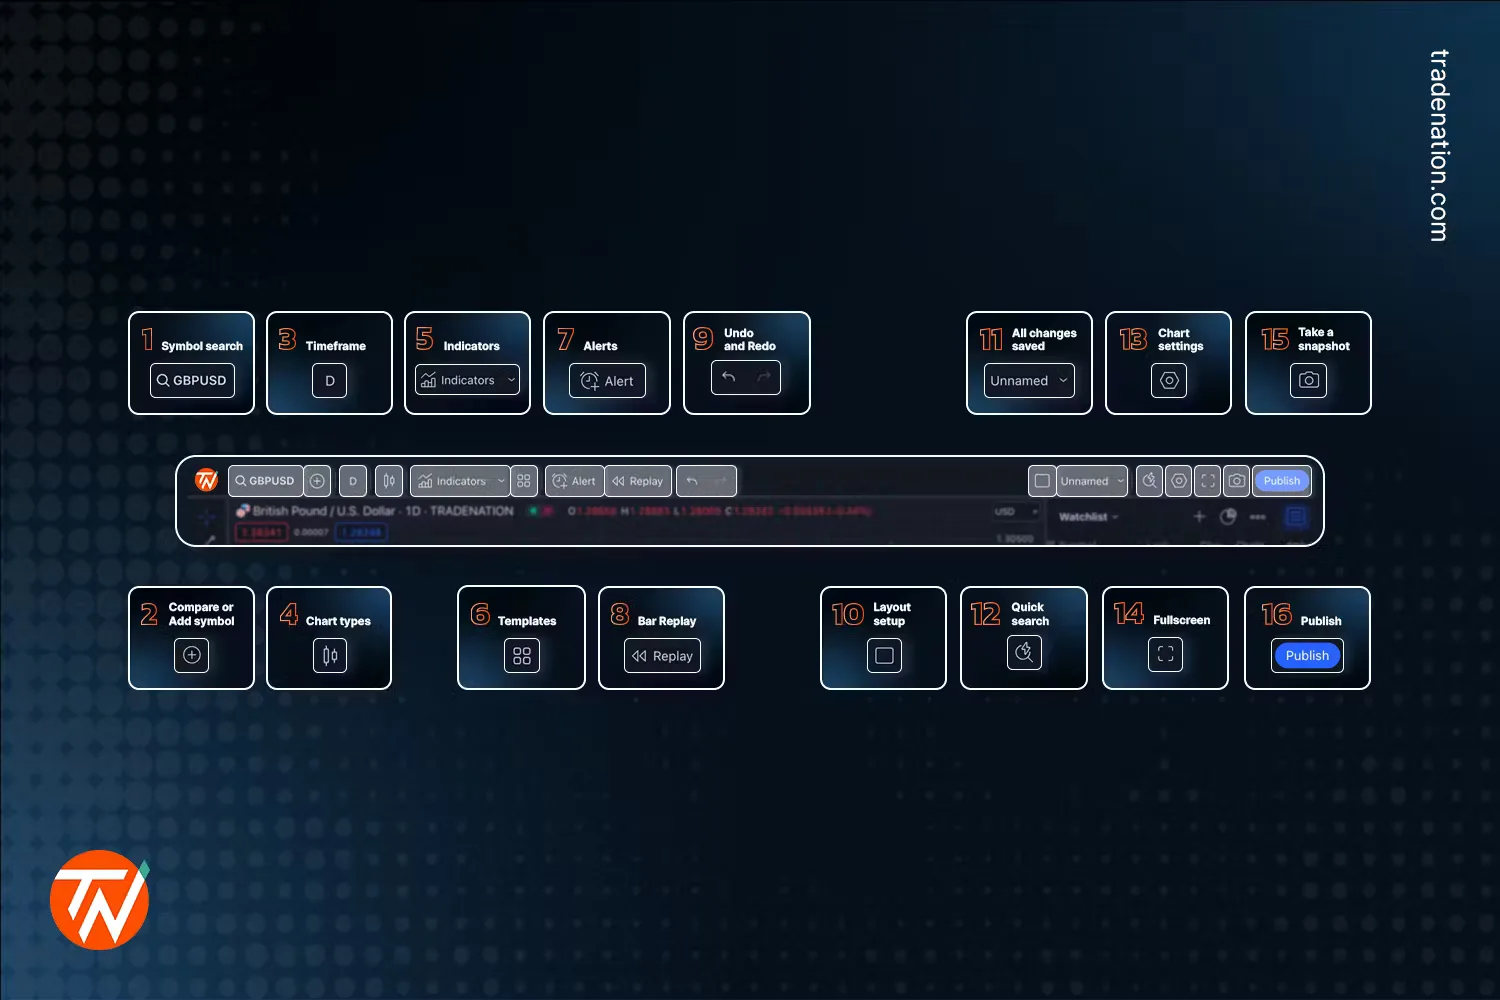
Left Zone — Chart Controls
- Symbol Search (ticker display + magnifying glass)
- Timeframe Selector (1m to 1M + custom intervals)
- Chart Type Switcher (21 types from Candles to TPO)
- Indicators & Strategies button (400+ built-in)
- Compare / Add Symbol (+) overlay button
Right Zone — Workspace Controls
- Alert Manager (bell icon — cloud-based alerts)
- Bar Replay toggle (historical simulation)
- Layout Selector (multi-chart grid configurations)
- Chart Settings (gear icon — deep customization)
- Snapshot / Screenshot / Save / Account Menu
The Top Menu is not just a toolbar — it's your trading cockpit. Every professional trader navigates it by muscle memory, rarely touching the mouse after the first week.
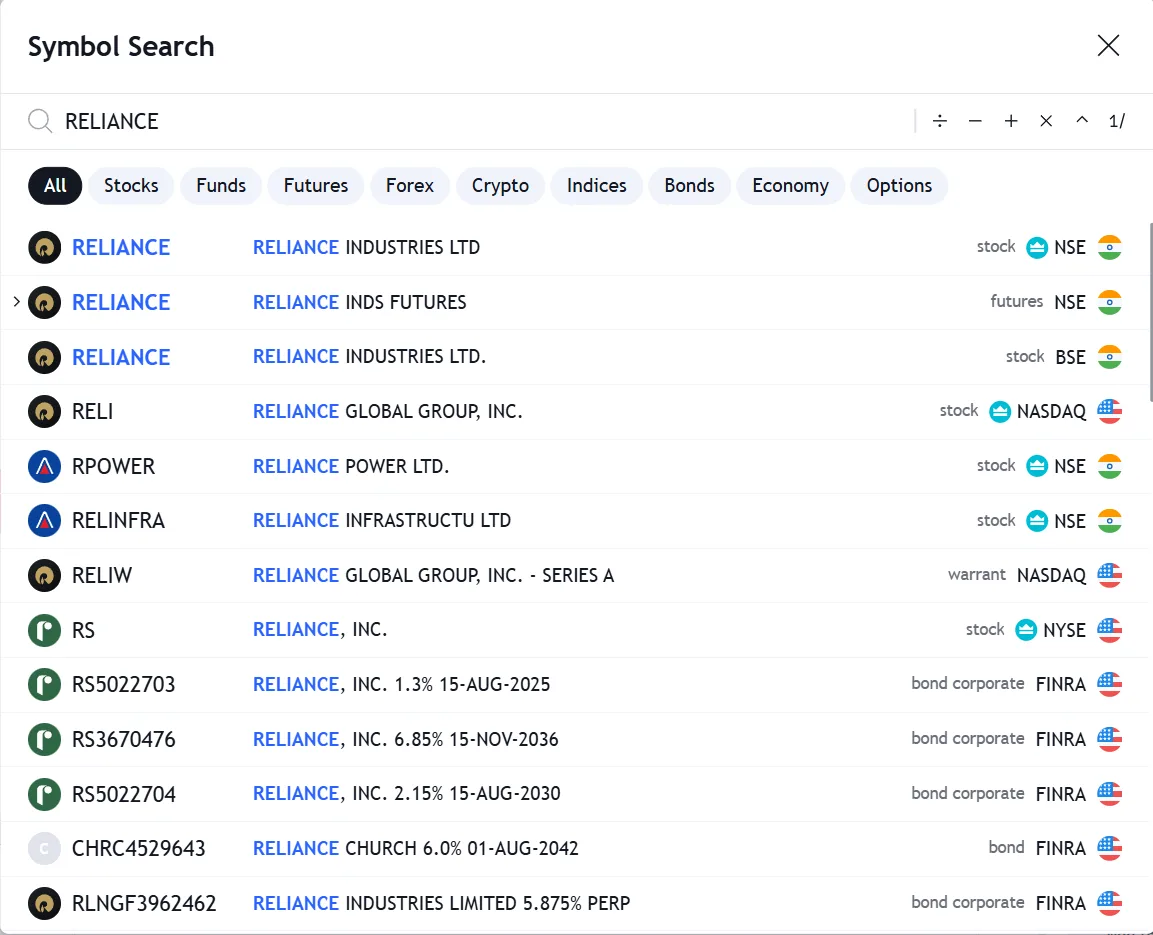
2. Symbol Search — The Fastest Way to Navigate
The leftmost element on the Top Menu is your current symbol (e.g., NSE:RELIANCE or NSE:NIFTY). Clicking it — or simply typing anywhere on the chart — instantly opens the Symbol Search overlay, giving you access to 3,539,722 instruments across 70+ stock exchanges and 70+ crypto exchanges.
The search is intelligent: it accepts company names ('Reliance'), ticker symbols ('RELIANCE'), exchange-prefixed queries ('NSE:TCS', 'BSE:SENSEX'), and even mathematical expressions ('NSE:TCS/NSE:NIFTY' for ratio charts). The dropdown shows matching results with exchange flags, asset class icons, and real-time price data.
For Indian market participants, always use the NSE: or BSE: prefix to ensure you're charting the correct exchange listing. NSE is the default for most liquid Indian stocks, while MCX: is used for commodity futures like Gold and Crude Oil.
Snapshot & Takeaways
Professional Tip
Build a habit of using Ctrl+K (Global Command Search) instead of clicking buttons. It's TradingView's equivalent of Spotlight on macOS or the Windows Run dialog — you can find any symbol, open any indicator, switch timeframes, access settings, apply chart templates, and perform virtually any action by typing what you need. This single shortcut can replace 80% of your mouse clicks.
Quick Search: Start typing anywhere on chart · Ctrl+K: Global Command Search · / : Open Indicators · Type number: Switch timeframe
3. Timeframe & Chart Type Selectors
Next to the symbol display, you'll find the Timeframe dropdown showing your current interval (e.g., '1D', '4H', '15'). TradingView supports timeframes from 1-second (Premium+) to Monthly, plus custom intervals like 7-minute or 3-day on paid plans. The 21 chart types are accessible from the adjacent dropdown — from standard Candlesticks and Line charts to advanced Volume Footprint and TPO (Premium/Expert only).
The timeframe selector has a 'Favorites' feature — double-click any timeframe to star it, and it will appear as a quick-access button directly on the toolbar. Most professional traders pin 5-minute, 15-minute, 1-hour, Daily, and Weekly to their favorites bar for instant switching without opening the dropdown.
The Chart Type selector lets you fundamentally change how price data is visualized. While Japanese Candlesticks remain the most popular choice (showing Open, High, Low, Close), switching to Heikin Ashi for trend identification or Renko for noise elimination on higher timeframes can reveal patterns invisible on standard candles.
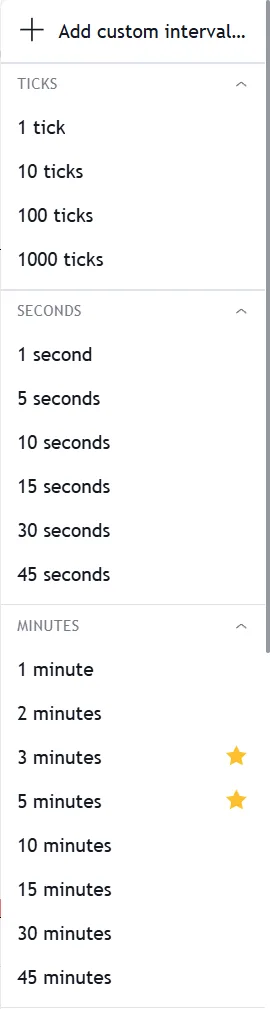
Timeframe Access by Plan
- Free: Standard intervals (1m, 5m, 15m, 1H, 4H, D, W, M)
- Essential+: Custom timeframes (7m, 3D, etc.) unlocked
- Premium+: Second-based intervals (1s, 5s, 15s, 30s)
- Ultimate: Tick-based intervals for ultra-high-frequency analysis
Chart Types by Category
- Standard (Free): Candles, Bars, Hollow, Line, Area, Baseline, Columns + more
- Japanese (Free): Heikin Ashi, Renko, Kagi, Point & Figure, Line Break
- Volume (Premium+): Volume Footprint, Volume Candles
- Profile (Premium+): TPO, Session Volume Profile
Professional Tip
Pin your 5 most-used timeframes to the favorites bar by double-clicking them in the dropdown. This creates instant one-click access on the toolbar — a massive workflow optimization for multi-timeframe analysis across intraday (5m, 15m), swing (1H, D), and positional (W) trading.
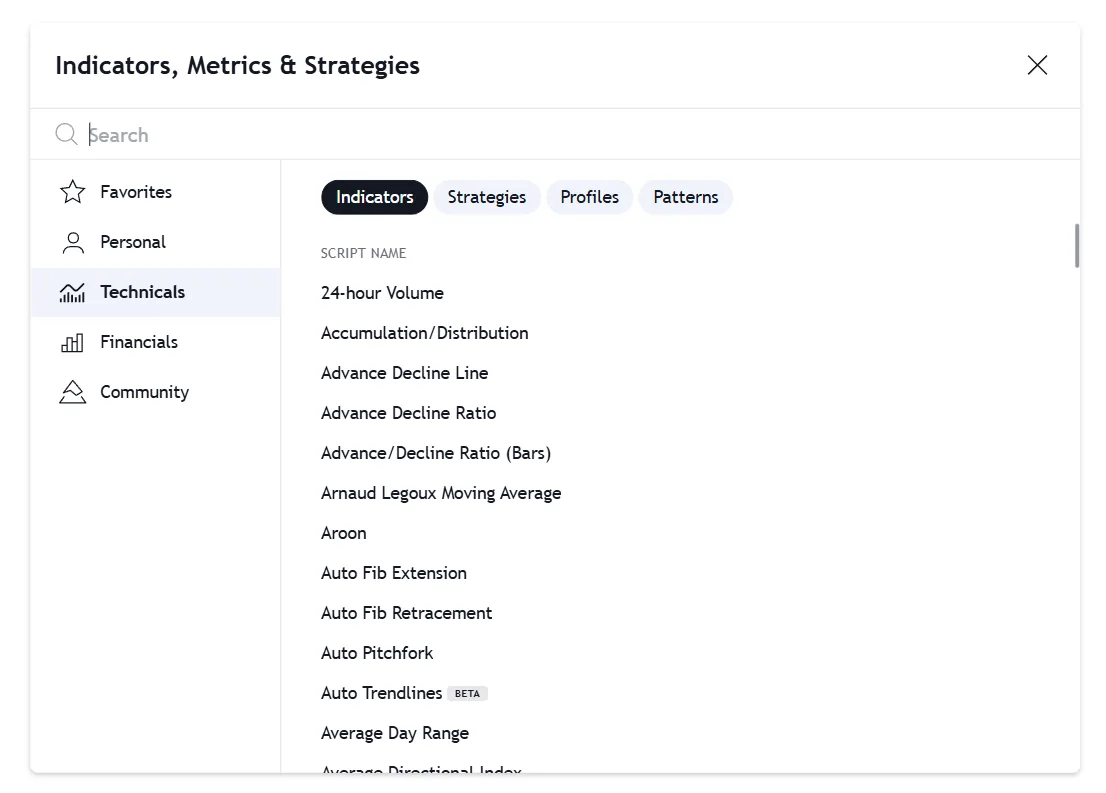
4. Indicators, Strategies & Compare
The 'Indicators, Metrics & Strategies' button (labeled 'Indicators' or showing an 'fx' icon) opens TradingView's massive library — 400+ built-in technical indicators and access to 100,000+ community-created Pine Script® tools. This is where you add Moving Averages, RSI, MACD, Bollinger Bands, Volume Profile, and virtually any analytical overlay.
The search within this dialog is highly advanced: you can filter by type (Indicators, Strategies, or Financials), browse by category (Trend, Oscillators, Volume, etc.), search by name, or even browse 'Editor's Picks' and 'Most Popular'. Community scripts are clearly labeled with their author, rating, and whether they're open-source or invite-only.
The Compare (+) button sits right next to Indicators. It lets you overlay one or more additional symbols on your current chart — essential for relative strength analysis, sector rotation identification, and correlation studies. You can add the overlay on the 'Same % Scale' for percentage-based comparison or on a 'New Price Scale' for absolute price levels.
Indicators per Chart by Plan
- Free: 2 indicators per chart
- Essential: 5 indicators per chart
- Premium: 25 indicators per chart
- Ultimate: 50 indicators per chart
Compare Feature Use Cases
- Overlay Nifty 50 on individual stock charts for relative strength
- Compare NSE:BANKNIFTY/NSE:NIFTY for sector rotation signals
- Overlay Gold (MCX:GOLD1!) with USD/INR for correlation analysis
- Create ratio charts by typing 'NSE:TCS/NSE:CNXIT' in symbol search
Critical Warning
Free plan users are limited to just 2 indicators per chart. If you frequently use RSI + MACD + a Moving Average, you'll exceed the limit immediately. The Essential plan (5 indicators) is the minimum recommended tier for active technical analysis.
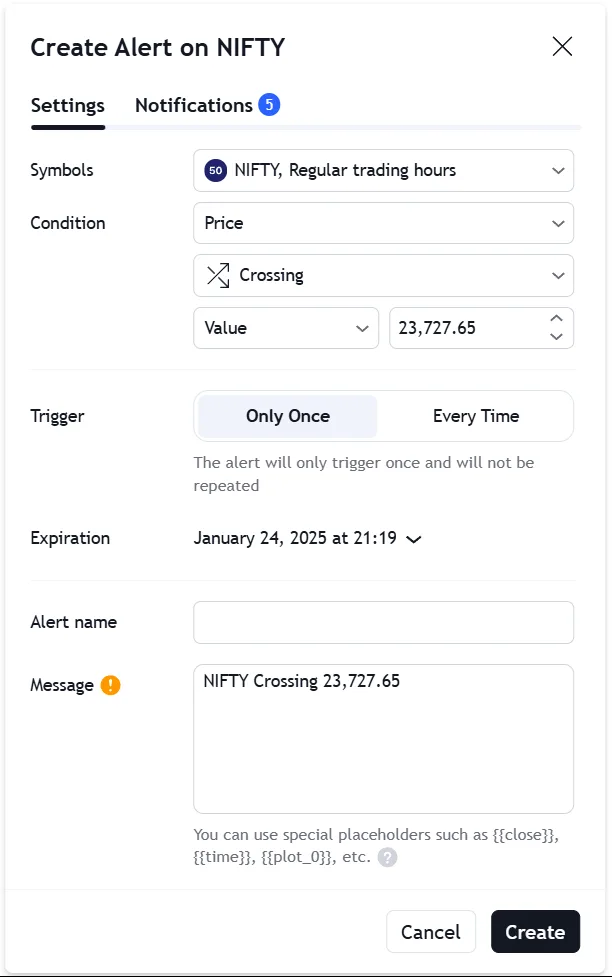
5. Alerts & Bar Replay — Active Trading Tools
The Alert bell icon (🔔) on the top menu is your gateway to TradingView's cloud-based alert system — one of the most powerful on any charting platform. Alerts run on TradingView's servers 24/7, meaning they trigger even when your computer is off, your browser is closed, or your phone is in your pocket. You get 13 built-in alert conditions covering price levels, indicator crossovers, drawing object touches, and custom Pine Script logic.
Bar Replay is the adjacent toggle — it lets you rewind the chart to any historical date and replay price action bar by bar, as if you were watching the market live. This is invaluable for backtesting strategies, practicing pattern recognition, and studying how past setups evolved. You can even apply indicators and draw on the chart during replay.
For Indian market traders, set alerts on key levels like Nifty's support/resistance zones, Bank Nifty's weekly option strike prices, or volume breakouts on individual stocks. The webhook delivery option lets you connect alerts to automated trading systems, Telegram bots, or Google Sheets for logging.
Alert Delivery Methods
- Browser popup notification (instant, visual)
- Email alerts with full chart context
- Mobile push notification (iOS/Android app)
- Webhook (URL) — for automated trading bots
- SMS alerts (available in select regions)
Bar Replay Capabilities
- 9 playback speeds from ultra-slow to real-time
- Step-by-step mode for precise bar-by-bar analysis
- Full indicator support during replay sessions
- Drawing tools active — mark up charts in real-time
- Available on Essential+ plans (not on Free)
Snapshot & Takeaways
6. Layout Manager & Chart Settings
The Layout Selector (grid icon) on the right side of the toolbar controls how many charts you see simultaneously in your workspace. Free users get a single chart; paid plans unlock multi-chart layouts (2, 4, 8, or up to 16 charts per tab on Ultimate). Within multi-chart layouts, you can sync symbols, timeframes, and crosshairs across all panes.
The Chart Settings gear icon (⚙️) opens TradingView's deep customization panel — the most comprehensive chart configuration system in the industry. It's organized into tabs: Symbol (candle colors, session types, extended hours), Status Line (OHLC display, indicator labels), Scales & Lines (price axis, time axis, grid), Appearance (background, crosshair, watermark), and Trading (connected broker settings).
The Save/Layout Management dropdown lets you name, duplicate, and switch between different chart layouts. Professional traders maintain separate layouts for different workflows — one for intraday scalping (multiple small timeframe charts), one for swing analysis (daily/weekly with indicators), and one for macro overview (indices, commodities, forex).
Charts per Tab by Plan
- Free: 1 chart per tab (single view)
- Essential: 2 charts per tab
- Plus: 4 charts per tab
- Premium: 8 charts per tab
- Ultimate: 16 charts per tab (16-grid!)
Chart Settings Deep Dive
- Symbol Tab: Candle colors, borders, wicks, session type (regular/extended hours)
- Status Line: Toggle logo, OHLC values, indicator titles, volume display
- Scales: Price axis format, time zone, grid lines, date format
- Appearance: Background (solid/gradient), crosshair style, watermark
- Trading: Broker connection, order display, P&L visibility
Professional Tip
Create and save at least 3 chart layouts: (1) Intraday Setup — 4 charts showing 1m, 5m, 15m, and 1H of the same symbol with synced crosshairs. (2) Swing Setup — Daily chart with key indicators (RSI, MACD, Volumes) in a single focused view. (3) Market Radar — 8-chart grid showing Nifty, Bank Nifty, US indices, Gold, Crude, USD/INR, India VIX, and your top watchlist stock.
Professional Tip
Enable 'Extended Trading Hours' in Chart Settings → Symbol tab if you trade US stocks via Indian brokers. Pre-market and after-hours data reveals institutional positioning that regular session charts completely miss.
7. Snapshots, Screenshots & Quick Actions
The camera icon on the Top Menu captures a high-resolution snapshot of your current chart — perfect for sharing analysis on social media, sending to trading groups, or archiving setups for your trading journal. TradingView generates a unique URL for each snapshot that can be shared publicly or kept private.
Adjacent to the snapshot button, you'll find the Undo/Redo controls and the full-screen toggle. The Undo history is deep — it tracks every drawing, indicator addition, and setting change, letting you reverse mistakes instantly. Full-screen mode (F11 or the maximize button) eliminates browser chrome for a distraction-free charting experience.
The Save button (Ctrl+S) explicitly saves your current chart layout to the cloud. While TradingView auto-saves frequently, manually saving before switching layouts or closing the browser is a good habit — especially if you've spent time on complex drawing setups or template configurations.
Snapshot & Takeaways
Alt+S: Snapshot · Ctrl+S: Save Layout · Ctrl+Z/Y: Undo/Redo · F11: Full-screen
9. Dark Mode, Desktop App & Pro Workflow Tips
Dark Mode isn't just an aesthetic preference — it's a health and performance tool. Extended charting sessions under bright white backgrounds cause measurable eye strain and fatigue. TradingView's dark theme uses a carefully calibrated dark slate (#131722) that maximizes contrast for candlestick colors while minimizing blue light emission. Toggle it from the Account Menu or system theme settings on the Desktop App.
The 'Get Desktop App' link in the Account Menu opens TradingView's standalone application — available for Windows, macOS, Linux. The Desktop App is categorically superior to the browser version for serious traders: it offers native multi-monitor support with workspace restore, symbol syncing between tabs, synchronized crosshairs across displays, lower RAM usage, and zero browser shortcut conflicts.
For Indian market professionals managing multiple screens — one for Nifty futures, one for BankNifty options chain, one for global indices — the Desktop App's native workspace management is transformative. You set up your 3-monitor layout once, and it perfectly restores every morning when markets open.
| Features | TradingView | Traditional Brokers |
|---|---|---|
| RAM Usage | Dramatically lower (dedicated process) | High (browser per-tab overhead) |
| Multi-Monitor | Native workspace save & restore | Manual tab dragging between windows |
| Tab/Symbol Linking | Sync symbols & intervals across all tabs | Single window only |
| Crosshair Sync | Synchronized across all displays | No cross-window sync |
| Keyboard Shortcuts | Deep OS-level integration, no conflicts | Browser shortcuts override (Ctrl+W, F5) |
| Background Operation | Always running, never throttled | Browser throttles inactive tabs |
Professional Tip
Always enable Dark Mode for extended charting sessions — it significantly reduces eye strain and makes color-coded candlesticks more visually distinct against the dark background. Your eyes will thank you after 8-hour trading days.
Professional Tip
If you trade on 2+ monitors, install the Desktop App immediately. The browser version cannot match the native multi-monitor workspace restore, crosshair synchronization, and keyboard shortcut reliability that the Desktop App provides. It's the single biggest quality-of-life upgrade for active traders.
10. Essential Keyboard Shortcuts — The Speed Layer
The fastest traders rarely touch the Top Menu with their mouse — they use keyboard shortcuts for everything. TradingView's shortcut system is one of the most comprehensive of any web application, covering symbol search, timeframe switching, drawing tools, indicator management, and layout controls.
Think of keyboard shortcuts as the 'speed layer' built on top of the Top Menu. Every button on the toolbar has an equivalent keyboard shortcut, and mastering even 10-15 of them will cut your chart interaction time by 50% or more. Access the full shortcut reference from the Account Menu → 'Keyboard Shortcuts' or by pressing '?' on the chart.
Navigation Shortcuts
- Type any text: Open symbol search instantly
- Ctrl+K / Cmd+K: Global Command Search (universal launcher)
- Type number (15, 60): Switch to that minute timeframe
- D / W / M: Switch to Daily / Weekly / Monthly
- / (forward slash): Open Indicators dialog directly
Chart Action Shortcuts
- Alt+S: Take instant chart snapshot
- Ctrl+S: Save current layout to cloud
- Ctrl+Z / Ctrl+Y: Undo / Redo any chart action
- Alt+R: Reset chart to default view
- Ctrl+, (comma): Open Chart Settings directly
Drawing Tool Shortcuts
- Alt+T: Trendline tool
- Alt+H: Horizontal line / level
- Alt+F: Fibonacci Retracement
- Alt+V: Vertical line
- Ctrl+Alt+H: Hide/Show all drawings
View & Window Shortcuts
- F11: Toggle full-screen mode
- Shift+Tab: Cycle through multi-chart panes
- Alt+G: Go to specific date on chart
- Ctrl+← / →: Scroll chart left/right
- Ctrl+Mouse wheel: Zoom in/out on chart
The traders who dominate markets aren't necessarily smarter — they're faster. Keyboard shortcuts are the compound interest of trading efficiency.
Unlock TradingView Pro
Gain unrestricted access to multiple charts, custom timeframes, and unlimited technical indicators to perfect your edge.
Frequently Asked Questions
Common questions about this topic
Simply start typing anywhere on the chart — TradingView instantly opens the Quick Search overlay. You can search by company name ('Reliance'), ticker symbol ('RELIANCE'), or exchange prefix ('NSE:RELIANCE', 'BSE:TCS'). Press Ctrl+K to open Global Command Search, which finds any symbol, indicator, or setting. Results show matching stocks, futures, forex pairs, and crypto across all 70+ supported exchanges with real-time pricing.
Official TradingView Resources
Curated links from TradingView's Help Center & Blog
I can't find a symbol in the symbol search box
Please make sure that you don't have the exchange or symbol type filter enabled (check the top bar of the symbol search window)....
TradingView Symbol Search: tips for finding assets
CONTENTS:What are symbolsHow to access Symbol SearchSymbol Search on SuperchartsWhat are symbolsSymbols, or tickers, are abbreviations for financial i...
Research & development per employee
Research & development per employee is a financial metric that measures the amount of investment a company makes in research and development activitie...
Quick search on TradingView: find anything super fast
If you’re just getting started with Supercharts, it can be a little overwhelming. To help you save your time and make your analysis more efficient, we...
We Now Have Indicators to Search for Candlestick Patterns
Read fresh TradingView updates: We Now Have Indicators to Search for Candlestick Patterns. Discover more in our blog and stay connected with the latest platform news.
New screeners: make the most of stocks, crypto coins, and ETF research
Read fresh TradingView updates: New screeners: make the most of stocks, crypto coins, and ETF research. Discover more in our blog and stay connected with the latest platform news.
New ways to search
Read fresh TradingView updates: New ways to search. Discover more in our blog and stay connected with the latest platform news.
A new dialog for a quick search across the platform
Read fresh TradingView updates: A new dialog for a quick search across the platform. Discover more in our blog and stay connected with the latest platform news.
Related Articles
Continue your learning journey
Understanding the Chart Window
Deconstructing the 9 key components of your primary analytical workspace.
ModuleSymbol Search & Timeframes
Finding any asset instantly and mastering multi-timeframe analysis.
ModuleLayout Setup, Save & Quick Search
Multi-chart layouts, sync options, saving configurations, and keyboard shortcuts.
ModuleChart Settings Deep Dive
Symbol customization, status line, scales, canvas, and visual configuration.
ModuleDesktop App & Pro Workspaces
Multi-monitor setups, tab linking, crosshair sync, and desktop-exclusive performance features.

Written By
Rohit Singh
Mr. Chartist
With 14+ years of experience in Indian financial markets, Rohit Singh (Mr. Chartist) is a SEBI Registered Research Analyst, Amazon #1 bestselling author, and the founder of Investology — a premium trading ecosystem trusted by a 1.5 Lakh+ strong community across India.
TradingView is a registered trademark of TradingView, Inc. All screenshots, logos, and platform imagery are the property of TradingView, Inc. and are used here for educational purposes only under fair use. This content is not affiliated with, endorsed, or sponsored by TradingView.
(c) 2026 TradingView, Inc. All rights reserved. - www.tradingview.com