Understanding the Chart Window
Deconstructing the 9 key components of your primary analytical workspace.
Mr. Chartist Workflow
Read with a trading desk mindset.
Every TradingView article now follows a practical pattern: understand the tool, map it to a charting workflow, apply it on Indian market instruments, and turn it into a repeatable workspace habit.
9
Sections
5m
Read
chart
Level
Open a clean chart and locate the exact TradingView area covered in "Understanding the Chart Window".
Apply it on one liquid NSE stock, one index, and one weekly timeframe so the concept is not learned in isolation.
Save the layout, write one note about what improved your decision-making, and remove anything that adds noise.
The chart window is the command center of your TradingView experience. Every feature — from drawing tools to real-time data overlays — converges on this single, powerful canvas.
Understanding the 9 key components of the chart window transforms you from a casual observer into a precision analyst. Let's break down each element.
The 9 Components of the Chart Window
The TradingView chart window is divided into distinct functional zones, each designed for a specific aspect of your analysis workflow. Mastering the spatial layout means you can navigate at the speed of thought.
Especially for beginners, the chart window might initially seem like a complex maze. But with proper guidance, each component becomes intuitive and essential.
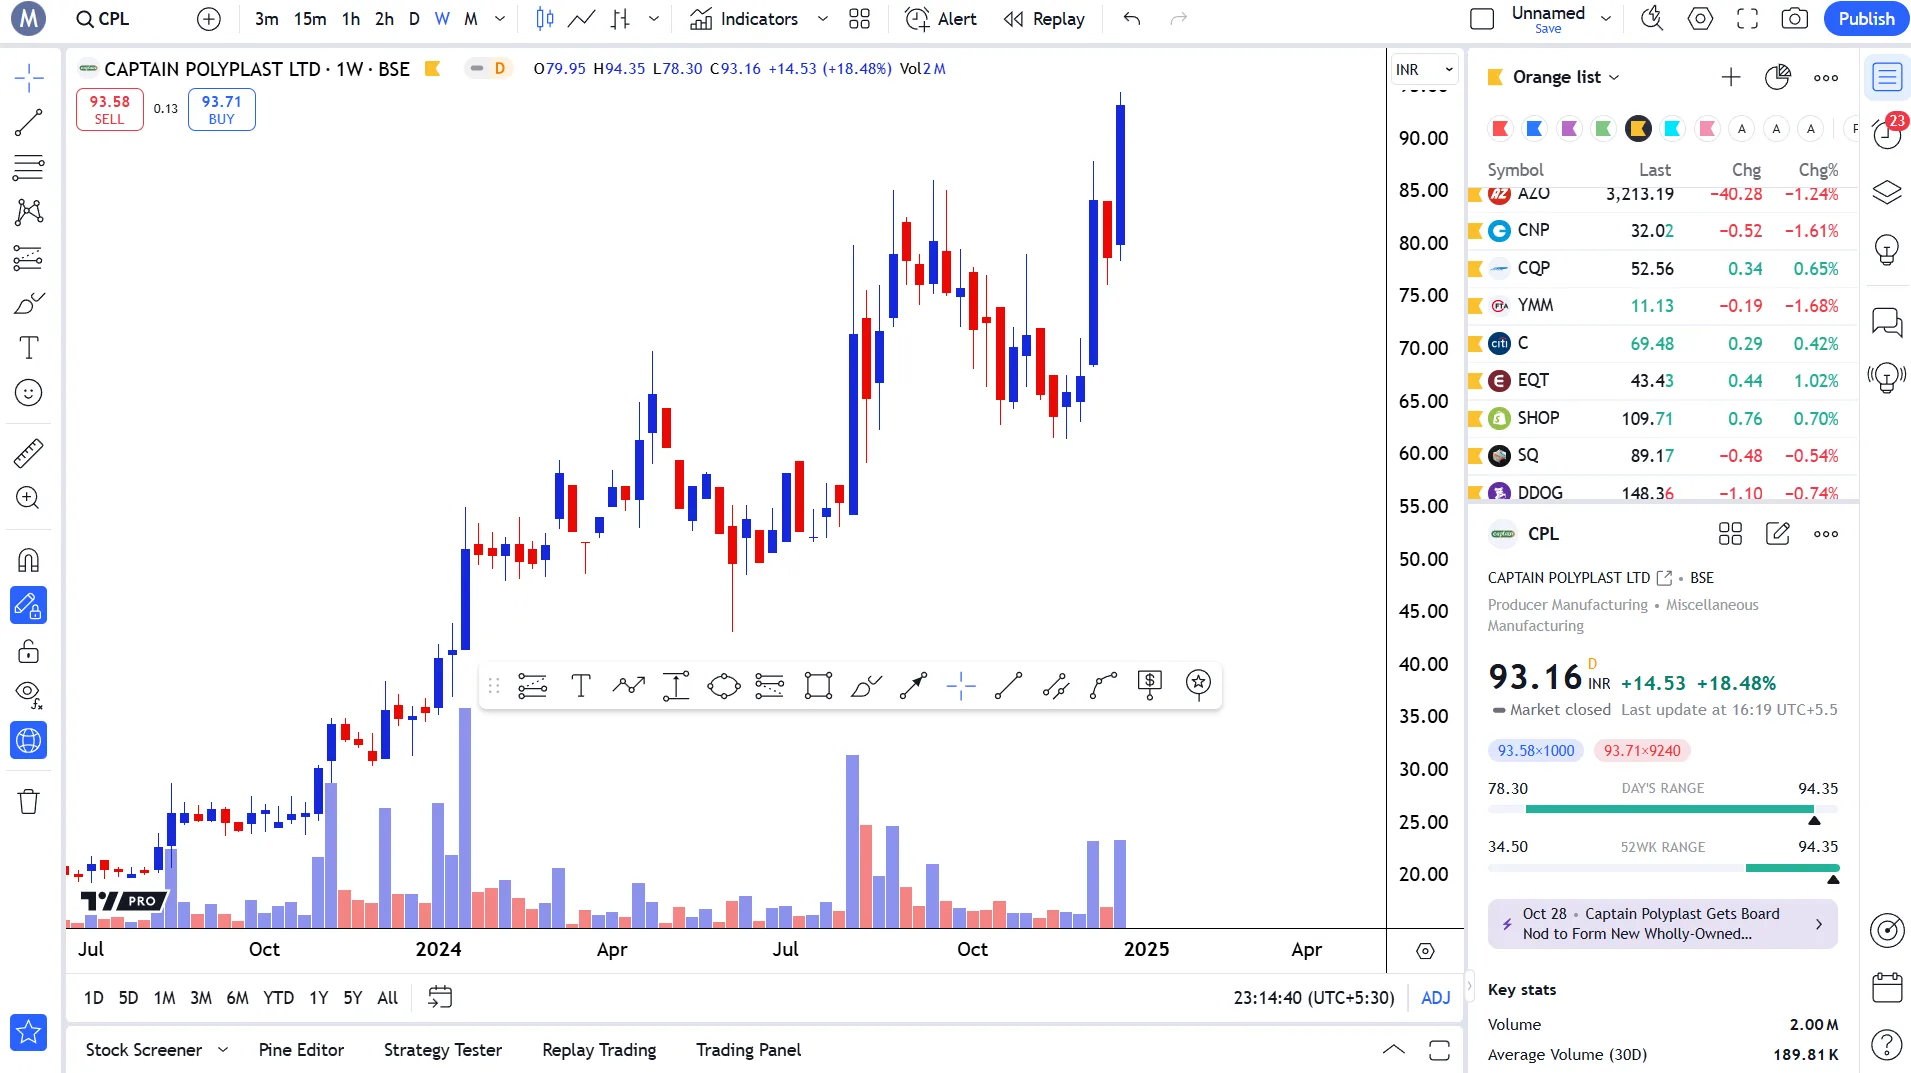
The TradingView Supercharts interface — your professional-grade analytical canvas.
Top Menu
- Symbol search, timeframe selection
- Chart type picker, indicator launcher
- Access to all 21 chart types
Chart Area
- Price visualization canvas
- Apply indicators, drawings, and overlays
- Right-click context menu for settings
Left Side Menu
- 110+ drawing tools
- Fibonacci, Gann, Elliott Wave
- Cursor modes and measurement tools
Right Side Menu
- Watchlist, Alerts, News
- Options chain, screeners
- Community ideas and chats
Bottom Menu
- Pine Script Editor
- Strategy Tester and Replay
- Trading Panel and Paper Trading
A clean, well-organized chart reduces cognitive load and allows you to focus purely on price action and market structure.
Snapshot & Takeaways
Professional Tip
Press Ctrl+K (or Cmd+K on Mac) to open Quick Search - the fastest way to navigate to any setting, indicator, or drawing tool without touching your mouse.
2. Chart Area — The Canvas
The chart area is where price movements are displayed visually. It is a highly optimized WebGL/HTML5 canvas allowing you to manipulate tens of thousands of data points with zero lag.
This is the territory where your entire analysis lives. You can drag and drop indicators from the top menu, apply custom scripts, and physically draw your hypotheses using the left menu tools.
2.1 High-Performance Rendering
- Hardware-accelerated WebGL rendering for infinite scrolling.
- Smooth zooming and panning across decades of price data.
- Maintains ultra-crisp vector graphics on Retina displays.
2.2 Dynamic Scaling
- Double-click the price axis to instantly auto-fit the chart.
- Click and drag any axis to compress or stretch data manually.
- Shortcut: Press Alt+R to immediately reset the chart scale.
2.3 Context Menus & Shortcuts
- Right-click anywhere to manage alerts, colors, and layers.
- Hold Shift while clicking to summon the measurement tool.
- Simultaneously measure date range and percentage change.
MOTHERSON Options
4. Drawing Tools (Floating Bar)
The floating bar provides a dynamic, optional toolbar that docks your most frequently used tools for one-click access anywhere on the screen.
For power users, menu diving is inefficient. The favorites toolbar acts as your custom palette, ensuring your unique style of analysis is always within mouse reach.
4.1 One-Click Access
- Hover over any tool in the menus and click the star.
- Instantly adds the tool to your floating palette.
- Eliminates the need to constantly open side menus.
4.2 Smart Docking
- Drag the floating bar anywhere on the canvas.
- It remembers its position across all your layouts.
- Keep it near the bottom right to avoid obscuring price action.
5. Watchlist and Quote Area
The watchlist area is your personal radar. It allows for the live tracking of specific assets with real-time streaming data directly from the exchanges.
Free users can track up to 30 symbols, while premium users unlock advanced lists and color-coded flagging systems to organize trade setups.
5.1 Organization & Flags
- Use the 'Red List' or 'Blue List' flags to categorize symbols.
- Sort by setup priority (e.g., Red for active trades).
- Create custom sections and headers.
5.2 Advanced Data View
- Enable 'Advanced View' for deep financial quotes.
- See extended hours data and volume metrics directly.
- Track 52-week highs, lows, and percentage changes.
Chart Customization & Themes
You have complete control over the aesthetic and functional presentation of the chart. Whether you prefer a stark white background for publishing reports or a midnight dark mode for late-night analysis, the engine supports it.
Customization extends to customizing candle colors, grid line opacity, crosshair styles, and margin padding.
Dark & Light Themes
- Access Dark Mode via the main TradingView menu.
- Desktop versions can automatically follow your OS theme.
- Reduces eye strain during late-night analysis.
Complete Canvas Control
- Modify Symbol settings like candle borders and wicks.
- Customize Status Line elements and visibility.
- Adjust grid line opacity and background gradients.
MOTHERSON Options
Crosshairs & Navigation
- Choose between Cross, Dot, Arrow, or Eraser mode.
- Ensure 'Cross' is enabled to render intersecting guide lines.
- Snap tools to exact prices using the Magnet modifier.
Critical Warning
Ensure your color theme is saved by logging in. Anonymous users will lose their customized chart aesthetics when their browser cache clears.
Unlock TradingView Pro
Gain unrestricted access to multiple charts, custom timeframes, and unlimited technical indicators to perfect your edge.
Frequently Asked Questions
Common questions about this topic
Right-click anywhere on the chart and select 'Settings' (or press Ctrl+Shift+,) to access the full customization panel. You can change candle colors, background themes (dark/light), grid lines, crosshair styles, and status line elements. Use the left panel's star icon to add your most-used drawing tools to the floating favorites bar. Your customizations sync across all devices automatically.
Official TradingView Resources
Curated links from TradingView's Help Center & Blog
How do I turn on the dark theme?
For iOS and Android devices Please complete the following steps:Open the Menu screen from the bottom toolbar;Tap on the gear-wheel button in the top r...
How do I switch the app to Dark or Light color theme
TradingView Desktop follows your system's theme by default. This includes changing the app theme immediately when the system theme has changed, with f...
Why my color theme isn't getting saved?
Default theme is defined by the browser’s theme. It is saved when you log in and log out and is also kept in the settings for your next visit to our p...
I can't see the crosshair line
You are likely not seeing the crosshair line because you have selected a cursor type that doesn’t support it. So far, only “Cross” and “Dot” cursor ty...
Signposts in the Chart Window
Read fresh TradingView updates: Signposts in the Chart Window. Discover more in our blog and stay connected with the latest platform news.
Related Articles
Continue your learning journey

Written By
Rohit Singh
Mr. Chartist
With 14+ years of experience in Indian financial markets, Rohit Singh (Mr. Chartist) is a SEBI Registered Research Analyst, Amazon #1 bestselling author, and the founder of Investology — a premium trading ecosystem trusted by a 1.5 Lakh+ strong community across India.
TradingView is a registered trademark of TradingView, Inc. All screenshots, logos, and platform imagery are the property of TradingView, Inc. and are used here for educational purposes only under fair use. This content is not affiliated with, endorsed, or sponsored by TradingView.
(c) 2026 TradingView, Inc. All rights reserved. - www.tradingview.com