

The complete trading
ecosystem.
Every product here started as a problem that cost me money. Specific failures in how Indian retail traders research, scan, execute and review, each answered by one purpose-built tool.
- 01Learn
- 02Research
- 03Scan
- 04Trade
- 05Review
- Products
- 10
- Live today
- 5
- Stocks watched
- 3000+
- Sectors mapped
- 24
Every tool starts with a real problem.
Each one closes a specific hole in the workflow — a missed setup, a wrong strike or a loss you cannot explain a week later. Pick the problem you actually have.
- 01Most trade ideas arrive without the decision behind them.Investology
- 02Monday opens and there is no plan.Weekly ChartBook
- 03You are trading against flow you cannot see.FII/DII Data
- 04A candle tells one part of the story. The chart tells the rest.Trading Books
- 05Nobody reads a 300-page prospectus before the window shuts.IPO Decode
- 06Three thousand listed names, and you watch forty.Scanner Pro
- 07The chart looks ready. The balance sheet does not.FundaDesk
- 08The strike gets picked by feel.OptionsDesk
- 09The same mistake repeats because it was never written down.TradeBook
- 10The certification is treated as a gate, not an education.NISM Exams
Investology
Most trade ideas arrive without the decision behind them.
A name and a price, forwarded on. No structure, no invalidation, no disclosed position — nothing you could argue with before you act on it, or check against afterwards when it fails.
Investology publishes under SEBI registration INH000015297, and every note carries the whole decision: the analyst, the date, the structure, the entry, the stop, the invalidation and the disclosure. You can judge the read, not just follow it.
- The reasoning, not just the level
- Invalidation stated up front
- Disclosure on every published setup
- 3000+ NSE and BSE names tracked
Weekly ChartBook
Monday opens and there is no plan.
Most watchlists get built after the move has started, from whatever the timeline happened to surface over the weekend.
The ChartBook lands before the week does — chart-based setups across equity and F&O with levels marked and invalidation stated. 280+ editions since 2018, each one public in the archive.
- Published weekly since 2018
- Equity and F&O setups
- Levels and invalidation marked
- English and Gujarati editions
FII/DII Data
You are trading against flow you cannot see.
Institutions move size before retail sees the print. By the time a move is obvious on the chart, the accumulation is already finished.
The terminal tracks FII and DII flows with daily, weekly and monthly matrices, F&O positioning and sector-wise FPI allocation, so shifts in allocation are visible while they happen rather than in hindsight.
- Daily, weekly and monthly flow matrices
- F&O positioning
- Sector-wise FPI allocation
- Flow heatmaps
Trading Books
A candle tells one part of the story. The chart tells the rest.
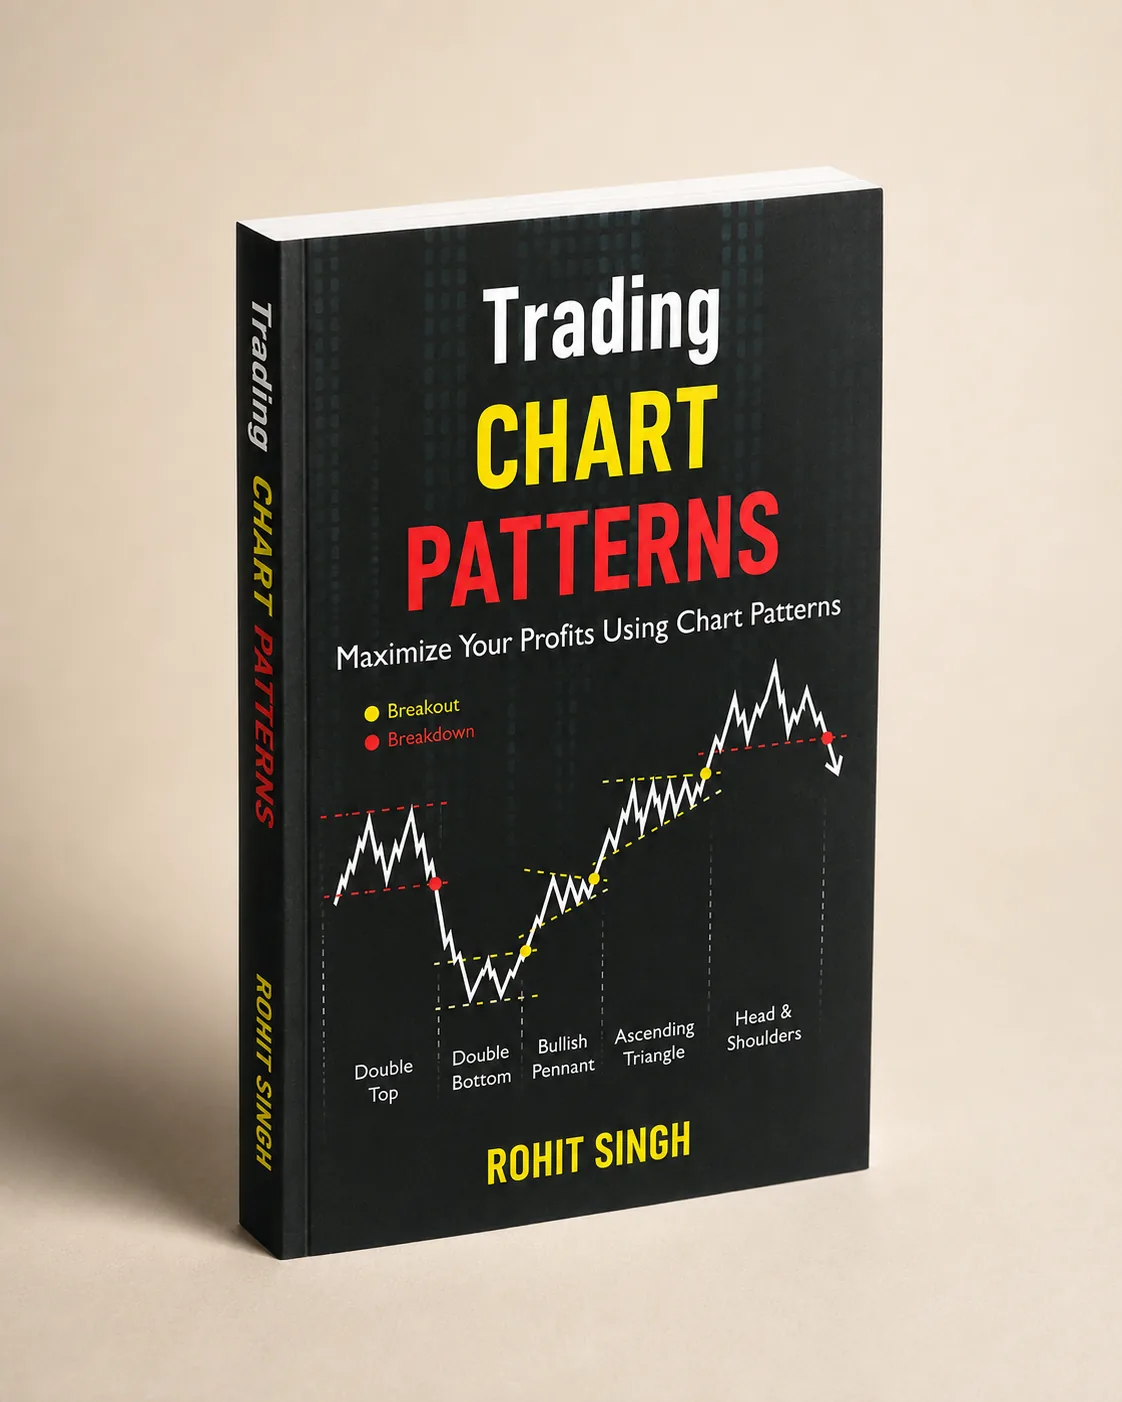
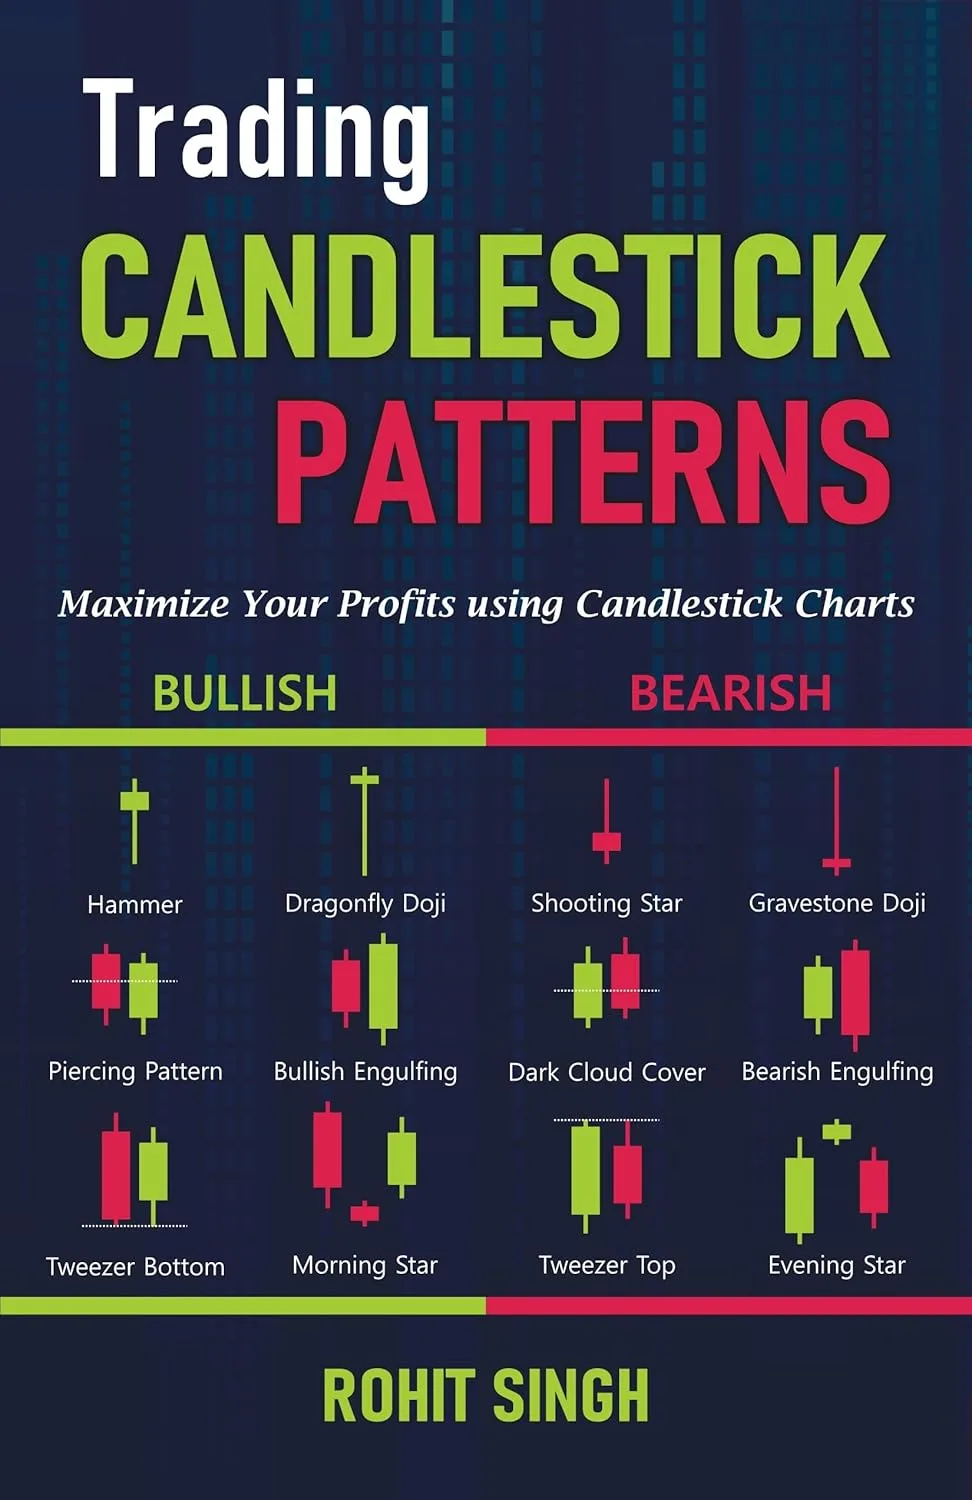
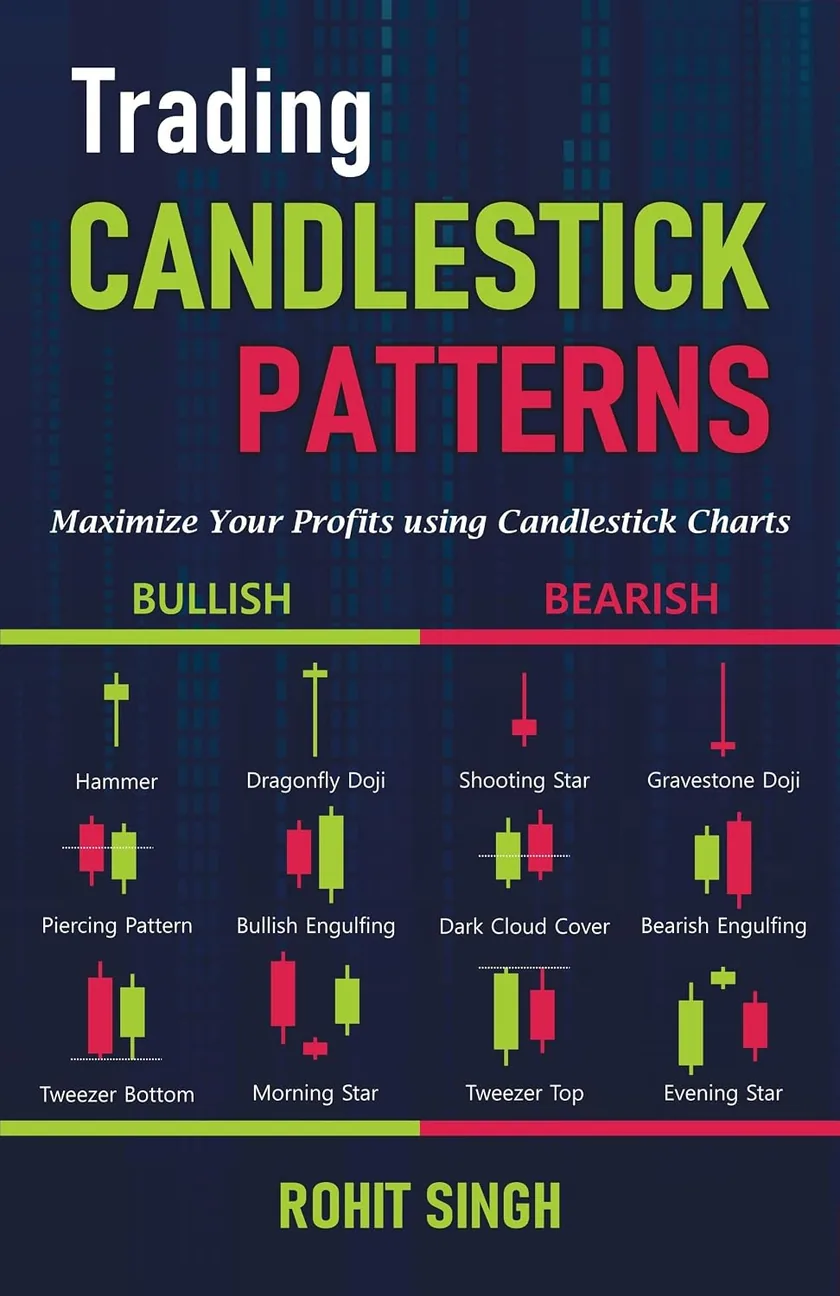
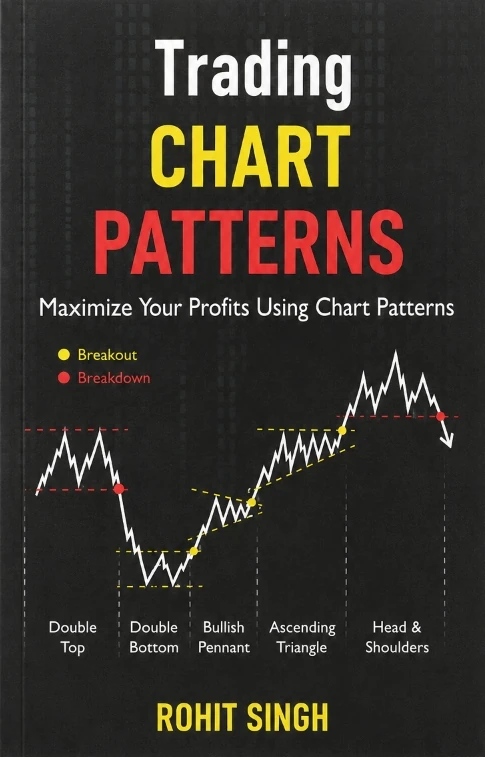
Two complementary ways to study price action. Trading Chart Patterns examines the larger structure: bases, breakouts and the formations that develop across a chart. Trading Candlestick Patterns looks closer, at individual candles and the context around them.
Written by Rohit Singh, the two books bring the chart and the candle into the same study process — with visual explanations, Indian market examples and attention to context, levels and invalidation.
- Chart structures and breakout context
- Candlestick behaviour in context
- Visual explanations of price action
- Written by Rohit Singh
IPO Decode
Nobody reads a 300-page prospectus before the window shuts.
The sources that matter do not agree and do not join up. The exchanges are authoritative but have to be checked by hand. The GMP aggregators are unofficial and inconsistent. Allotment sits behind a different form at every registrar. And the DRHP itself — the only document that actually says what the company is — runs 300+ pages that almost no retail applicant opens.
IPO Decode ingests every public source on its own schedule, tracks each issue from DRHP filing through to post-listing, and parses the prospectus into a structured 50-point dataset. Grading is deterministic rules first, AI only as enrichment. Every field records which source it came from and when, and anything unofficial is tagged “Needs verification” rather than quietly presented as fact.
- DRHP filing through post-listing
- Prospectus parsed to 50 data points
- Provenance stored on every field
- Unofficial data tagged, not laundered
- Mainboard and SME, NSE and BSE
- Allotment status per registrar
Scanner Pro
Three thousand listed names, and you watch forty.
A hand-built watchlist is a bet that opportunity only ever appears where you happen to be looking.
Scanner Pro runs 120+ algorithmic scans across 3000+ NSE and BSE stocks, gives each name a price-action rating and writes an AI market brief — so you start from the names that qualify, not from a blank watchlist.
- 3000+ NSE and BSE stocks
- 120+ algorithmic scans
- Price-action ratings
- AI market briefs
FundaDesk
The chart looks ready. The balance sheet does not.
Technical structure tells you when. It says nothing about whether the business behind the ticker deserves the position at all.
FundaDesk sits underneath the technical work — 15+ years of statements, peer comparison, debt and promoter holding, and my own Quality Score — so a setup can be checked against the company before size is committed.
- 15+ years of statements
- A Quality Score per company
- Peer comparison
- Debt and promoter holding
TradeBook
The same mistake repeats because it was never written down.
Memory edits the record. A losing trade quietly becomes bad luck, and the rule that actually got broken disappears from the story.
TradeBook logs each trade with the reason for entry, the stop, the rule followed or broken, and the outcome — so the next review starts from evidence instead of recollection.
- Entry rationale per trade
- Rule followed or broken
- Outcome and R multiple
- Review grouped by setup
Start with the problem that costs you most.
Weekly ChartBook, FII/DII Data, Trading Books, IPO Decode and Scanner Pro are shipped and in use. The other five are being built in the open.
Built by Rohit Singh · Mr. Chartist