What is TradingView?
A complete introduction to TradingView — the world's most powerful charting platform trusted by 100 million traders. Supercharts, Pine Script, screeners, and why it dominates.
Mr. Chartist Workflow
Read with a trading desk mindset.
Every TradingView article now follows a practical pattern: understand the tool, map it to a charting workflow, apply it on Indian market instruments, and turn it into a repeatable workspace habit.
6
Sections
12m
Read
fundamentals
Level
Open a clean chart and locate the exact TradingView area covered in "What is TradingView?".
Apply it on one liquid NSE stock, one index, and one weekly timeframe so the concept is not learned in isolation.
Save the layout, write one note about what improved your decision-making, and remove anything that adds noise.
In the fast-paced world of financial markets, the platform you choose can be the difference between capturing a breakout and watching it happen from the sidelines. TradingView has fundamentally disrupted the industry by delivering institutional-grade charting, real-time data, and a global social network — all inside your web browser.
Whether you're placing your first trade or managing a multi-crore portfolio, this guide walks you through everything TradingView offers and why it has become the undisputed standard for chart-based analysis worldwide.
TradingView Platform Interface Demo
(c) TradingView, Inc.
What is TradingView?
TradingView is a cloud-based financial analysis and charting platform that serves over 100 million traders and investors in 180+ countries. Unlike traditional desktop terminals like MetaTrader or Bloomberg (which require software installations and expensive data subscriptions), TradingView runs entirely in your web browser — on Chrome, Safari, Edge, or even your phone.
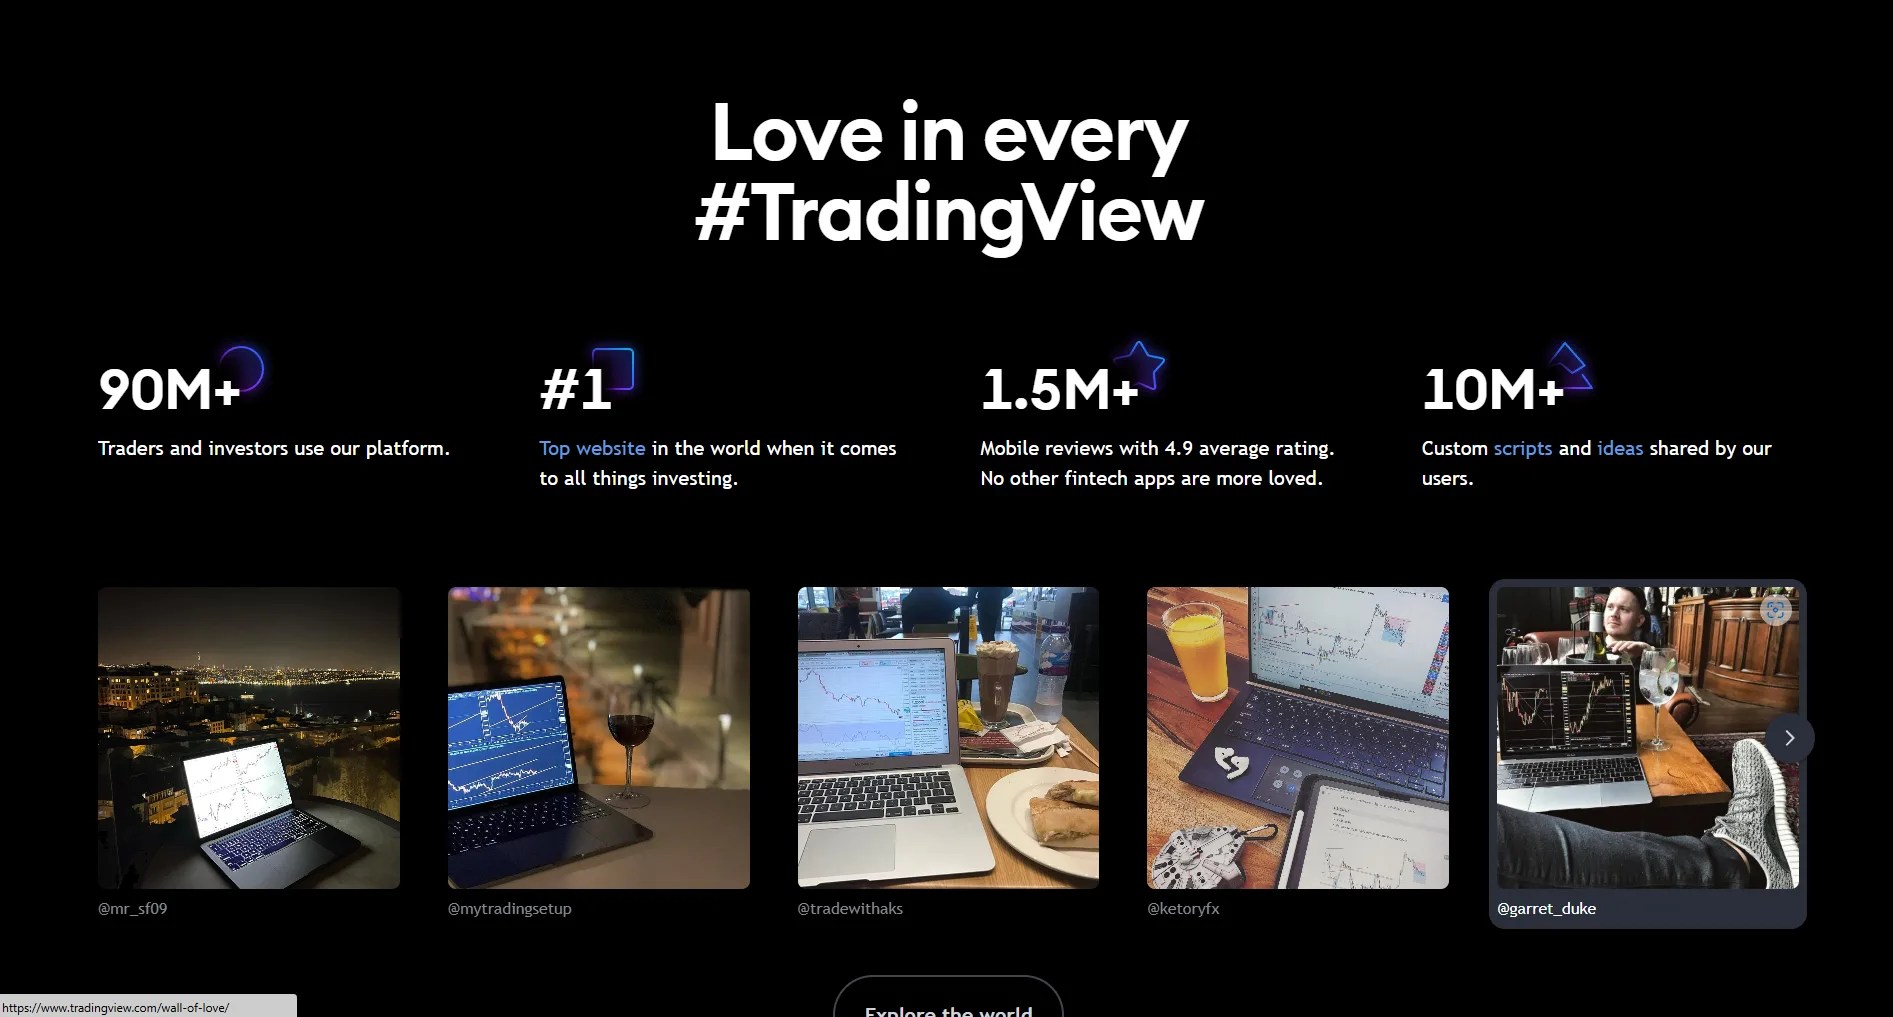
At its core, TradingView combines three powerful pillars into a single ecosystem: world-class charting tools called 'Supercharts' with 400+ built-in technical indicators and 100,000+ community-built indicators, a massive social network where traders share real-time analysis, and direct broker integrations that let you execute trades without ever leaving the chart.
For Indian traders specifically, TradingView supports NSE, BSE, and MCX data with real-time quotes. You can chart Nifty 50, Bank Nifty, individual stocks like Reliance, TCS, or Raymond, commodities like Gold and Crude Oil, and even global indices like the S&P 500 — all from a single screen.
The TradingView Ecosystem: Charting, Community, and Execution unified in the cloud.
TradingView is not just a charting tool — it is a complete financial command center that combines analysis, execution, and community into one seamless experience.
Snapshot & Takeaways
Professional Tip
TradingView officially refers to its core charting engine as 'Supercharts'. They are designed to do more than just track price changes — they are a unified interface where you can apply advanced drawing tools, read custom indicators, and execute trades simultaneously.
Ctrl+K
The Origin Story — From Frustration to Revolution
TradingView was founded in September 2011 by Stan Bokov and Denis Globa in Westerville, Ohio. Bokov, a software engineer and active trader, was frustrated by the state of charting tools available at the time — most were expensive desktop applications with clunky interfaces that hadn't evolved in decades.
His vision was radical for 2011: build a charting platform that runs entirely in the browser using HTML5 (no Flash or Java plugins), make it free for basic users, and let traders interact socially — sharing ideas, publishing analysis, and learning from each other in real time.
The gamble paid off spectacularly. TradingView grew organically through word-of-mouth as retail traders discovered a platform that rivaled Bloomberg terminals costing $24,000/year — for free. By 2021, TradingView had raised $298 million at a $3 billion valuation. Today, the platform crosses 100 million users and connects to 100+ trusted brokers worldwide.
What Bloomberg does for Wall Street institutions at $24,000/year, TradingView delivers to retail traders worldwide — for free.
Professional Tip
TradingView's free plan is surprisingly powerful. You get 1 chart per tab, 3 indicators, and basic alerts. Many profitable Indian swing traders use nothing but the free plan with just a few moving averages and RSI.
Supercharts — Charts That Move Markets
TradingView's flagship product is called 'Supercharts' — an apt name for what is arguably the most advanced browser-based charting engine ever built. Every feature in the charting engine has been designed for speed, precision, and flexibility.
The platform supports 20+ chart types, from the familiar Candlestick and Line charts to specialized types like Volume Footprint (which shows trading volume distribution at each price level), Heikin Ashi (smoothed trend charts), Renko (brick-based price-only charts), Kagi, Point & Figure, and Range bars. Each chart type reveals different market insights.
TradingView handles time intervals uniquely. Intervals instruct the charting engine to calculate precise start and end times for trading activity within a selected range. Any possible interval is available — from 1-second charts for scalpers to monthly charts for long-term investors, plus custom intervals like 7-minute or 3-day. Range bars and Renko eliminate time entirely, focusing solely on price movements.
An actual look at Supercharts: 110+ Drawing Tools, 400+ Built-in Indicators, and multiple scale axes.
110+ Smart Drawing Tools
- Trendlines, channels, Fibonacci retracements
- Elliott Wave, Gann fans, geometric shapes
- Text annotations and predictive models
400+ Built-in Indicators
- Classics like RSI, MACD, and Bollinger Bands
- Advanced Volume Profile and multi-timeframe tools
- 100K+ community-published Pine Script indicators
Professional Tip
Use the Bar Replay feature to practice your strategy on historical data before risking real money. It simulates real trading on past data with 9 replay speeds, synchronized multi-chart replay, and step-by-step mode — like a flight simulator for traders.
Beyond Charts — The Complete TradingView Ecosystem
TradingView is far more than charting. As the real-time screener above demonstrates, the platform has grown into a complete financial ecosystem with features that rival dedicated tools costing thousands.
A unified command center replacing 5+ separate premium financial tools.
Cloud-Based Alerts
- 13 built-in alert conditions
- Server-side execution (runs when PC is off)
- Webhooks, email, and app push notifications
Comprehensive Financials
- Income statements, balance sheets, cashflow
- 100+ fundamental ratios for major exchanges
- Historical financial data directly on charts
Pine Script® Programming
- Purpose-built language for trading strategies
- Full cloud IDE with built-in debugger
- 100,000+ free community scripts
Advanced Screeners
- 6 built-in screeners (Stocks, Crypto, ETFs, Bonds)
- 400+ filter fields from 1m to monthly
- Real-time macro dashboard
TradingView packs more features into its free browser tab than most premium platforms charge $200/month for.
Critical Warning
While TradingView is excellent for analysis and charting, it is NOT a broker. You cannot deposit money into TradingView. To execute real trades, you must connect a supported broker (like Dhan or Fyers) through the Trading Panel. We cover this in detail in Article 29: Connecting Indian Brokers.
Who is TradingView For?
One of TradingView's greatest strengths is its accessibility. As shown in the cross-device demonstration above, your analysis travels with you. The platform scales from absolute beginners to hedge fund managers. Here's how different types of traders use it:
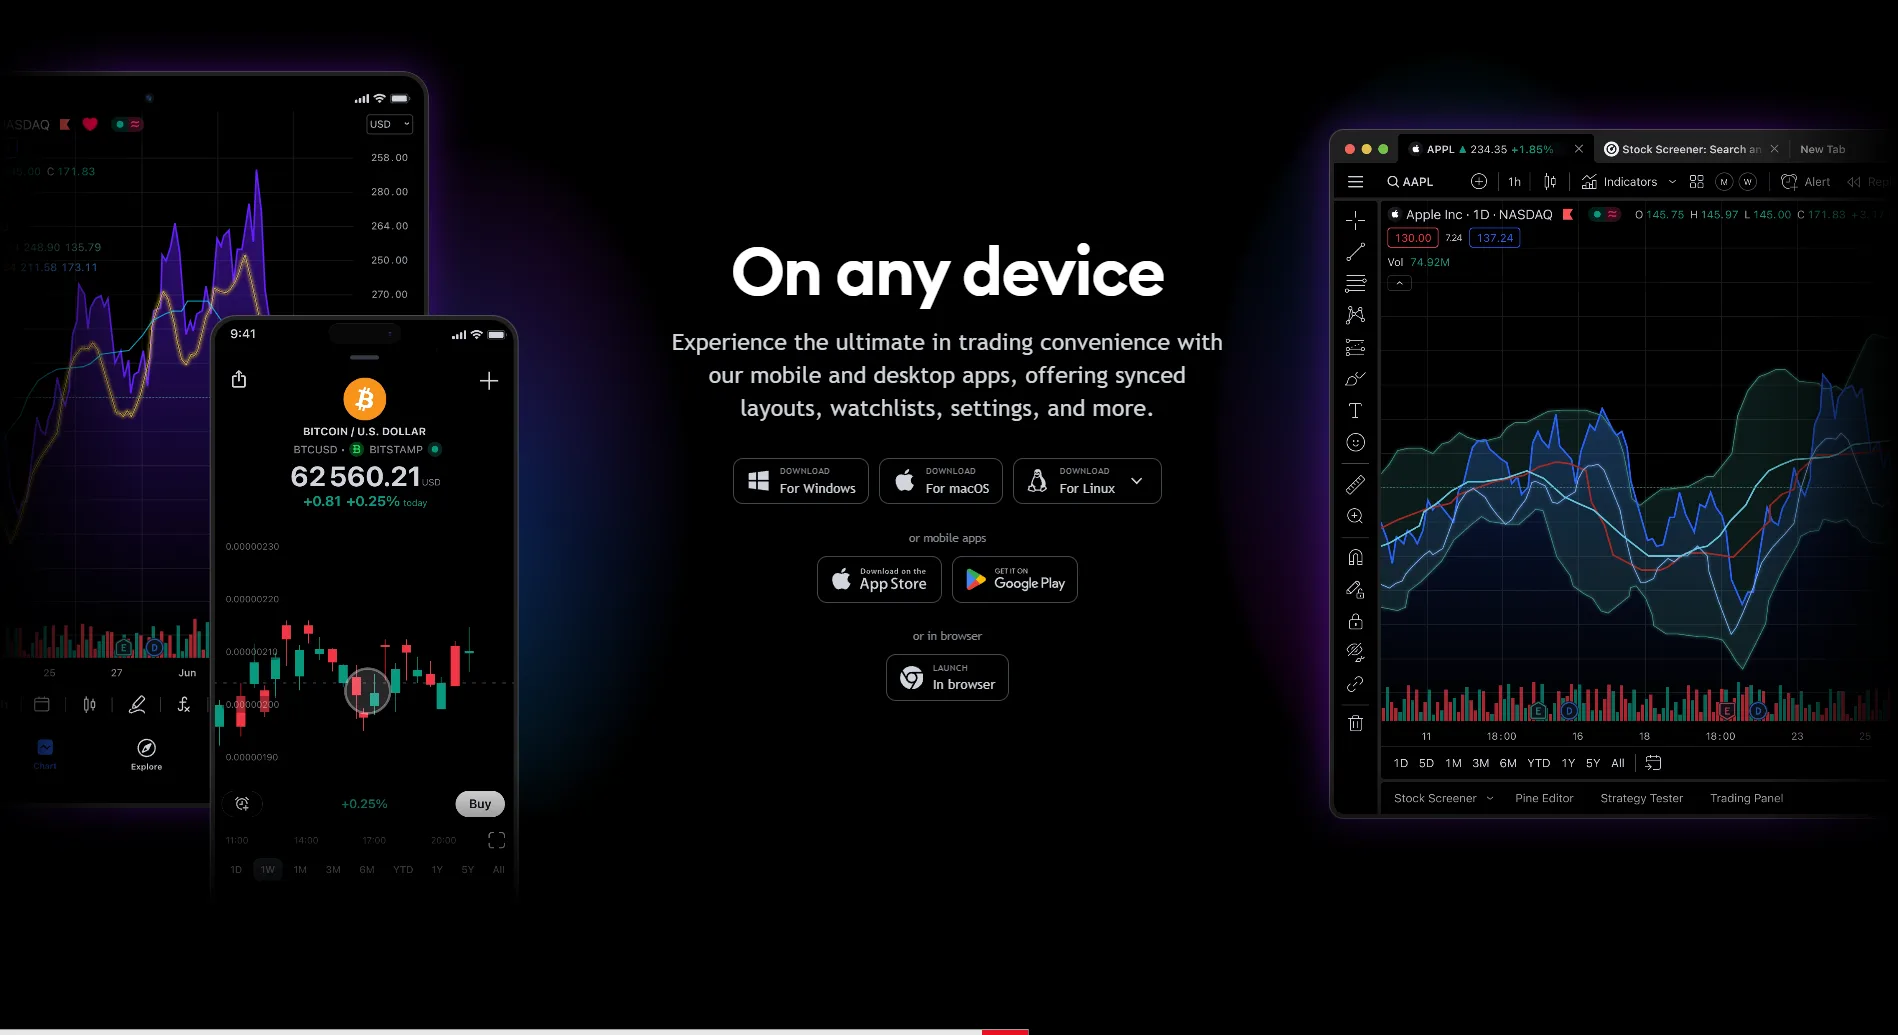
100% Instant Cloud Sync across Desktop, Native App, and Mobile devices.
Snapshot & Takeaways
Professional Tip
If you're an Indian trader just starting out, begin with the Daily timeframe on Nifty 50 or high-momentum stocks like Raymond. Add just two indicators — a 200-day EMA (for trend) and RSI (for momentum). Master these before adding any complexity. This simple setup is what most professional Indian fund managers use as their first filter.
TradingView vs. Other Platforms
To understand why TradingView dominates, it helps to compare it against the alternatives that Indian traders commonly use.
| Features | TradingView | Traditional Brokers |
|---|---|---|
| Cloud-Based Access | ||
| Built-in Indicators | 400+ | ~50-100 |
| Custom Scripting | Pine Script® | |
| Social Network | 100M+ Users | |
| Device Sync | Instant (Cloud) | Manual Backup |
No other platform in the world combines institutional-grade charting, a 100-million-user community, and direct broker execution — all in a free, browser-based experience.
Unlock TradingView Pro
Gain unrestricted access to multiple charts, custom timeframes, and unlimited technical indicators to perfect your edge.
Frequently Asked Questions
Common questions about this topic
Yes, TradingView offers a completely free 'Basic' plan that includes 1 chart per tab, 3 indicators, 1 watchlist with 30 symbols, and access to NSE, BSE, and MCX data with a slight delay. Many successful Indian traders use the free plan exclusively. Paid plans (Essential, Plus, Premium, Ultimate) unlock more charts, indicators, alerts, and real-time data — with a 30-day free trial available.
Official TradingView Resources
Curated links from TradingView's Help Center & Blog
Introduction to fundamental analysis on TradingView
Fundamental analysis is a method of identifying an asset's intrinsic, or true, value. Those who use it believe that an asset may be overvalued or unde...
Housing Starts (HST)
Number of started housing construction.All countries for which HST is available are listed below:BulgariaCanadaCzech RepublicDenmarkFinlandFranceIcela...
Getting started with Supercharts
Supercharts are the core of TradingView. With them, you can track price changes, read indicators, apply drawing tools, and view other features such as...
Time intervals: a quick introduction and tips
Time intervals are the amount of time or trading activity during a selected range. They instruct the chart to calculate a start time and an end time f...
Introducing Additional Bars on TradingView Charts
Read fresh TradingView updates: Introducing Additional Bars on TradingView Charts. Discover more in our blog and stay connected with the latest platform news.
Introducing alerts on rectangle drawings
Read fresh TradingView updates: Introducing alerts on rectangle drawings. Discover more in our blog and stay connected with the latest platform news.
Introducing the New Drawing Tool: Arrow Marker
Read fresh TradingView updates: Introducing the New Drawing Tool: Arrow Marker. Discover more in our blog and stay connected with the latest platform news.
Introducing BBTrend™ – a brand new indicator from John Bollinger
Read fresh TradingView updates: Introducing BBTrend™ – a brand new indicator from John Bollinger. Discover more in our blog and stay connected with the latest platform news.
Related Articles
Continue your learning journey

Written By
Rohit Singh
Mr. Chartist
With 14+ years of experience in Indian financial markets, Rohit Singh (Mr. Chartist) is a SEBI Registered Research Analyst, Amazon #1 bestselling author, and the founder of Investology — a premium trading ecosystem trusted by a 1.5 Lakh+ strong community across India.
TradingView is a registered trademark of TradingView, Inc. All screenshots, logos, and platform imagery are the property of TradingView, Inc. and are used here for educational purposes only under fair use. This content is not affiliated with, endorsed, or sponsored by TradingView.
(c) 2026 TradingView, Inc. All rights reserved. - www.tradingview.com