Why Choose TradingView?
Six compelling advantages that make TradingView the preferred platform for traders worldwide.
Mr. Chartist Workflow
Read with a trading desk mindset.
Every TradingView article now follows a practical pattern: understand the tool, map it to a charting workflow, apply it on Indian market instruments, and turn it into a repeatable workspace habit.
8
Sections
4m
Read
fundamentals
Level
Open a clean chart and locate the exact TradingView area covered in "Why Choose TradingView?".
Apply it on one liquid NSE stock, one index, and one weekly timeframe so the concept is not learned in isolation.
Save the layout, write one note about what improved your decision-making, and remove anything that adds noise.
With 100M+ traders across 180+ countries, TradingView isn't just another charting platform — it's the global standard. But what makes it the overwhelming choice over legacy desktop software and broker-provided tools?
Below is a data-driven breakdown of the six pillars that make TradingView the highest-value platform for Indian retail traders, institutional analysts, and everyone in between.
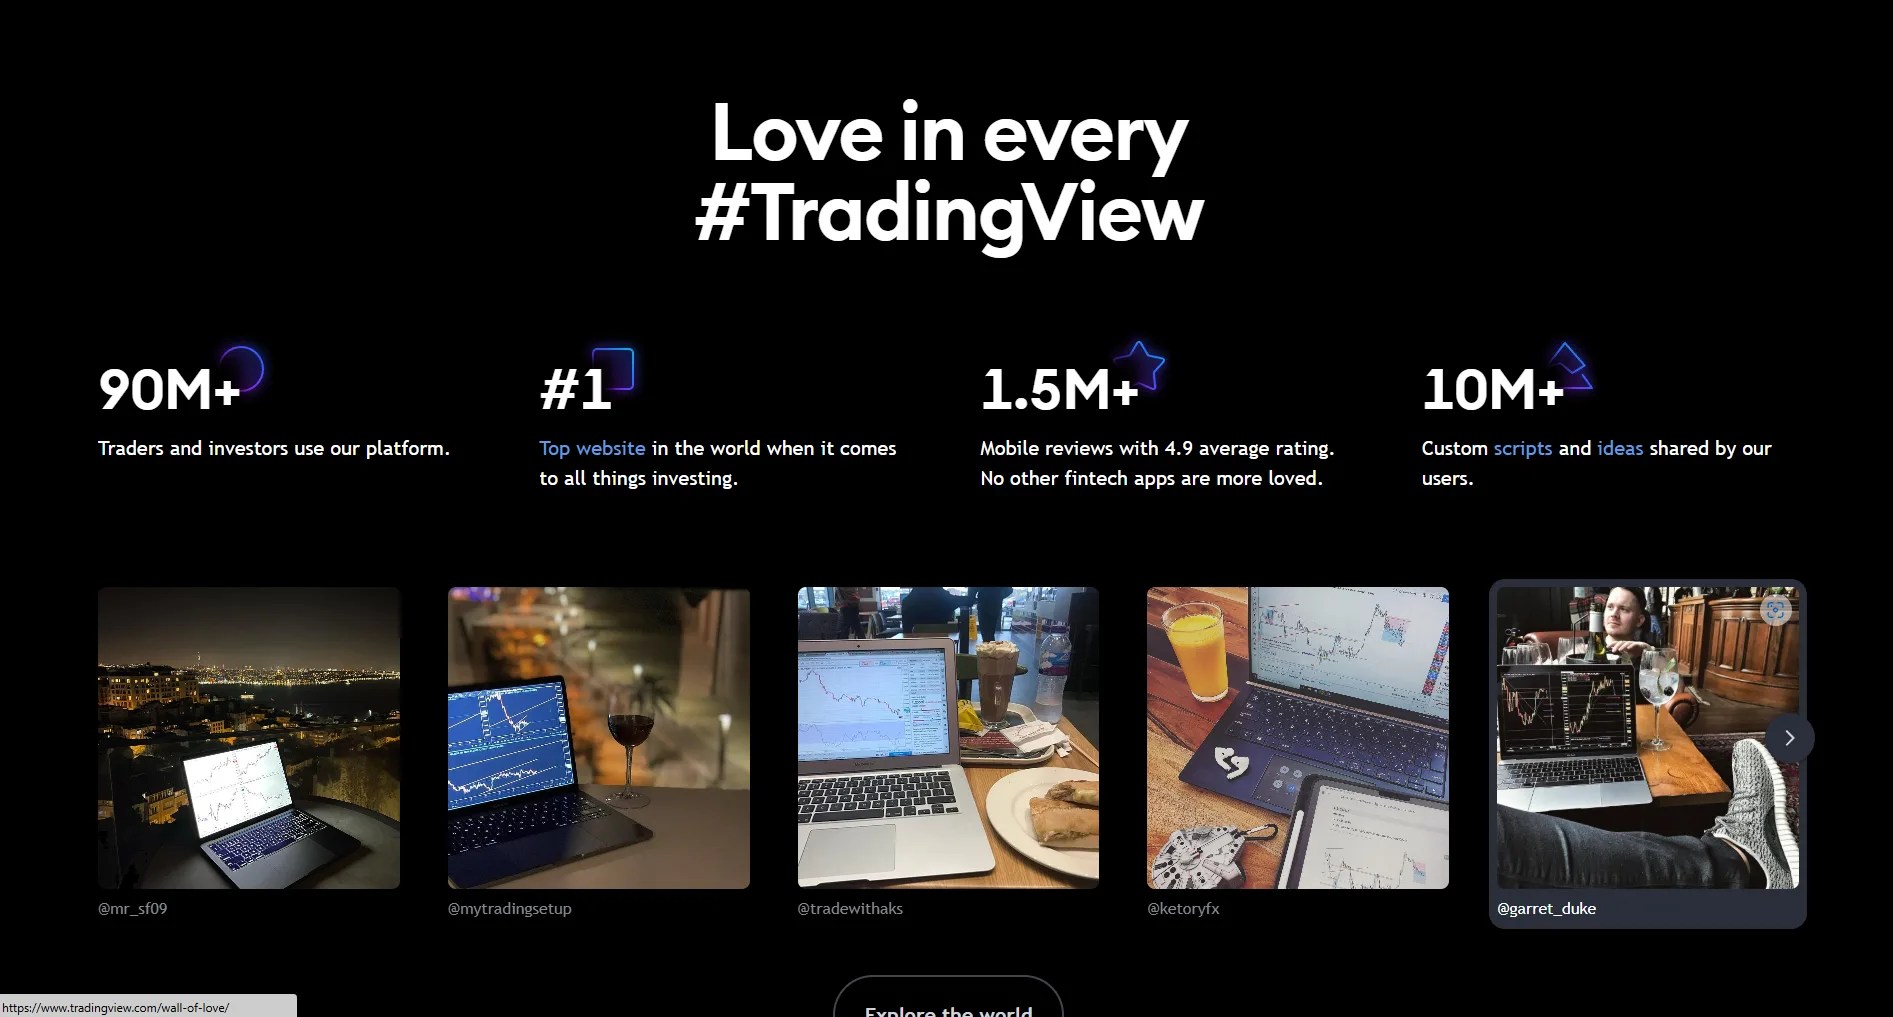
TradingView by the Numbers
Before diving into individual features, let's look at the scale of the platform. These numbers represent the most comprehensive financial analysis ecosystem ever built — and it's available for free in your browser.
No other platform in the world combines this breadth of data, tools, and community — all accessible from a single browser tab.
Critical Warning
TradingView's free plan uses delayed data (15-20 minutes) for most exchanges. For real-time NSE/BSE data, you need a paid plan OR to purchase a separate data subscription.
Real-Time Market Data — Institutional Grade
TradingView delivers institutional-grade market data across 3,539,722 instruments from 70+ stock exchanges and 70+ crypto exchanges. Data is directly sourced from professional real-time providers including ICE Data Services, FactSet, and Quartr for maximum accuracy.
For Indian traders, this means live NSE, BSE, and MCX data — including Nifty 50, Bank Nifty, individual stocks like Reliance, TCS, and Raymond, gold, crude oil, and all F&O contracts — all streaming in real-time on a single screen without needing secondary data-feed subscriptions.
TradingView's real-time data engine powering 100M+ traders worldwide.
Immediate access to real-time data is the foundation of every profitable trading decision.
Snapshot & Takeaways
Professional Tip
While NSE/BSE data is near real-time on the free tier, upgrading to the Essential plan provides dedicated priority exchange data feeds, eliminating the 10-15 minute delays seen on standard free broker feeds during high volatility.
The Most Advanced Charting Engine Ever Built
TradingView's Supercharts engine supports 21 chart types (from Candlesticks to Volume Footprint), 110+ smart drawing tools (Fibonacci, Elliott Wave, Gann), and 400+ built-in indicators — plus 100,000+ community-built scripts.
The charting engine runs entirely in HTML5 — no Flash, no Java, no downloads. It's the same technology that powers trading desks at hedge funds, yet it runs in your Chrome browser for free.
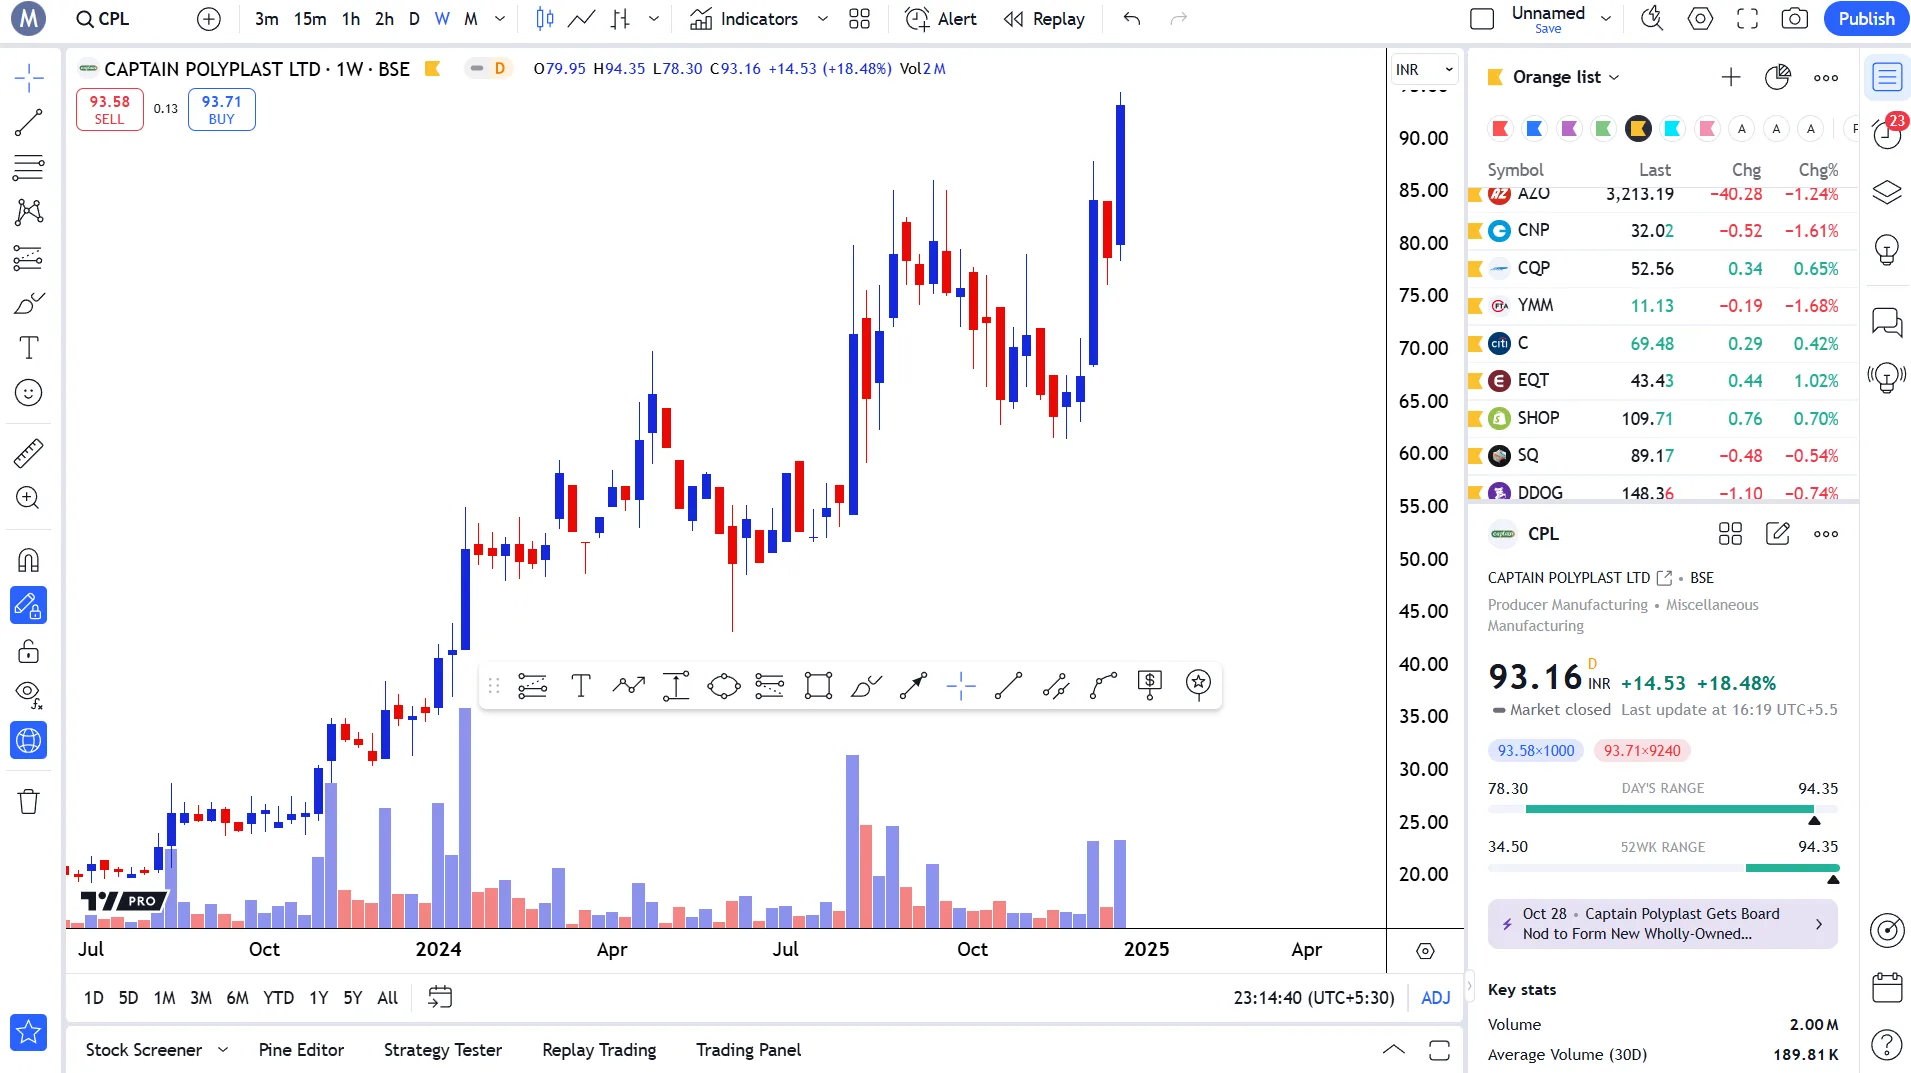
TradingView's Supercharts engine — the most powerful HTML5 charting technology ever built.
A Complete Financial Ecosystem
TradingView isn't just charts. It's a complete financial command center that replaces 5-6 separate tools most traders currently pay for.
Real-Time Market Data
- 3.5M+ instruments across all asset classes
- Institutional-grade data from ICE, FactSet, Quartr
- NSE, BSE, MCX data for Indian traders
21 Chart Types & 110+ Drawing Tools
- From Candlesticks to Volume Footprint
- Fibonacci, Elliott Wave, Gann tools
- Auto pattern recognition & chart patterns
100% Cloud-Based
- Zero downloads — runs in your browser
- Instant sync across desktop, mobile, tablet
- Your drawings, layouts, and alerts travel everywhere
100M+ Global Community
- Share and discover trading ideas
- 100,000+ free public indicators
- Pine Wizards, Freelancers & Paid Spaces
Risk-Free Paper Trading
- Practice with virtual money on realistic simulation
- All asset classes in one account
- Custom leverage, commissions, and balance
Pine Script® v6 Programming
- Build custom indicators and strategies
- Full cloud IDE with debugger and profiler
- 150,000+ published scripts to learn from
Global Data Coverage
- 130K+ stocks across 100+ exchanges
- 800+ forex pairs
- 2500+ crypto assets
- Full NSE, BSE, MCX coverage
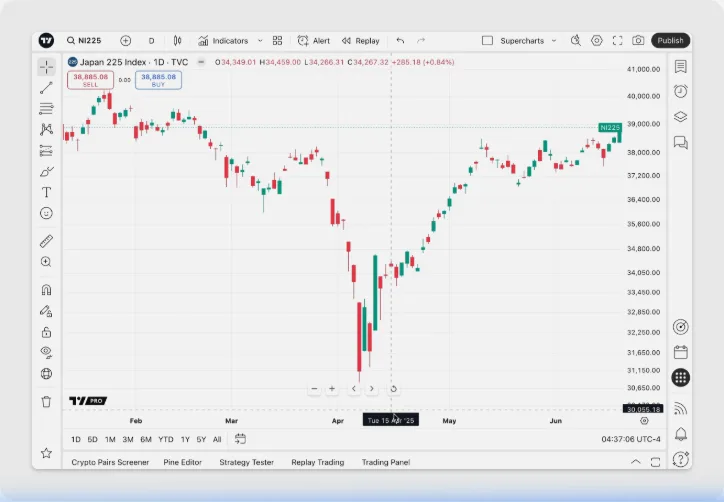
Trade Anytime, Anywhere — 100% Cloud
TradingView is entirely cloud-based. Your charts, drawings, indicators, alerts, watchlists, and strategies sync instantly across every device — desktop browser, native desktop app (Windows/macOS/Linux), and mobile apps (iOS/Android).
Draw a trendline on your laptop at home, and it appears on your phone during your commute. Set an alert on mobile, and it triggers on your desktop. There's zero friction between devices.
Web Browser
- Works on Chrome, Safari, Edge, Firefox
- Zero installation — cloud-based
- Full feature parity with desktop
Desktop App
- Windows, macOS, Linux support
- Native multi-monitor & tab linking
- Lower RAM, faster Pine Script execution
Mobile Apps
- iOS and Android — full charting engine
- Push notifications for alerts
- Draw, analyze, and trade on the go
Your analysis automatically syncs across all devices — ensuring you are never disconnected from the market pulse.
Professional Tip
Download the TradingView mobile app to receive push notifications for your price alerts — even when the browser isn't open.
Risk-Free Paper Trading
For those new to trading, TradingView offers a built-in paper trading simulator. Trade virtual money with realistic broker simulation — all asset classes, customizable leverage, commissions, and account balance. Zero risk, full learning.
You can even compete in 'The Leap' — TradingView's risk-free competition where you trade for real-money prizes without investing a single rupee.
TradingView's built-in paper trading simulator — zero risk, full learning.
Paper trading is the single most underrated feature for new traders — you can build real confidence without risking a single rupee.
Snapshot & Takeaways
Comprehensive Market Coverage
TradingView covers 3,539,722 instruments across every major asset class. For Indian traders, this means complete NSE, BSE, and MCX coverage alongside global markets — all from one platform.
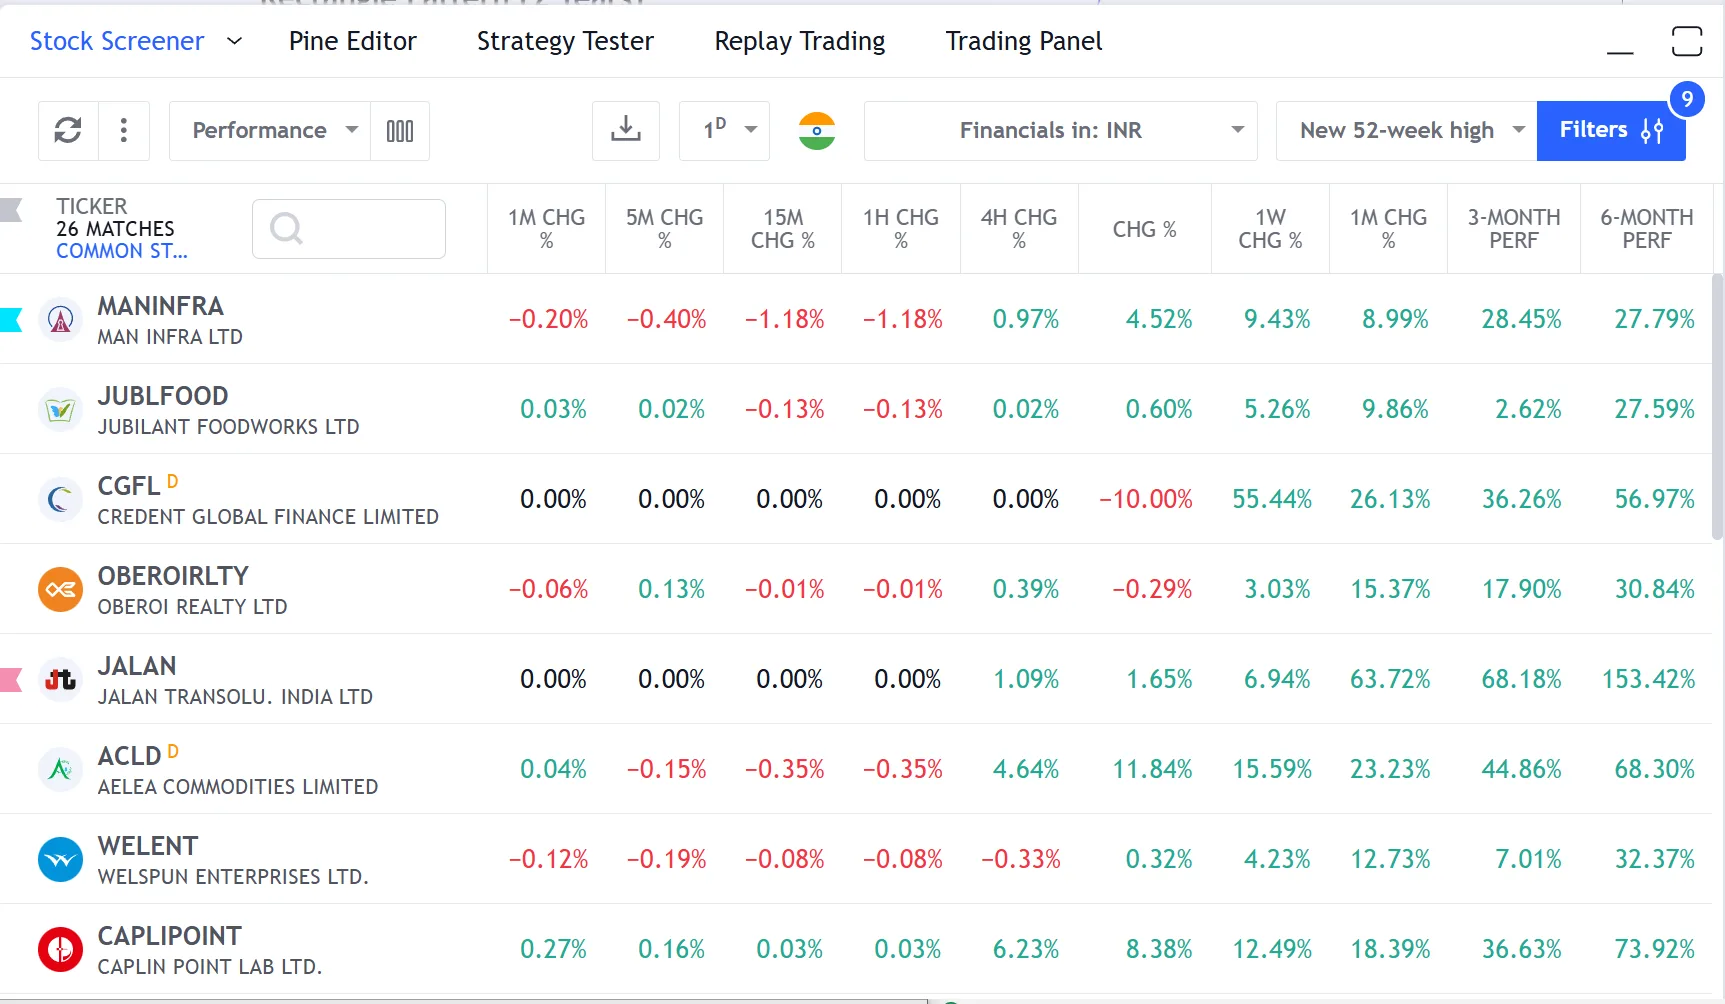
TradingView's global screener indexing over 3.5 million instruments worldwide.
Snapshot & Takeaways
TradingView vs. Legacy Platforms
To understand why TradingView dominates, let's compare it against the platforms Indian traders commonly use — from broker-provided tools to Bloomberg terminals.
| Features | TradingView | Traditional Brokers |
|---|---|---|
| Cloud-Based Access | Yes — any browser, any device | Desktop-only installation |
| Built-in Indicators | 400+ plus 100K+ community | ~50-100 built-in |
| Custom Scripting | Pine Script® v6 with cloud IDE | Limited or no scripting |
| Social Network | 100M+ users, Ideas, Scripts | No community features |
| Device Sync | Instant cloud sync everywhere | Manual backup required |
| Screeners | 7 types, 400+ filters, real-time | Basic stock screener only |
| Options Analytics | Full chain, Strategy Builder, Greeks | Separate platform needed |
| Price | Free tier available | $24,000/yr (Bloomberg) |
No other platform in the world combines institutional-grade charting, a 100-million-user community, and direct broker execution — all in a free, browser-based experience.
Unlock TradingView Pro
Gain unrestricted access to multiple charts, custom timeframes, and unlimited technical indicators to perfect your edge.
Frequently Asked Questions
Common questions about this topic
Broker-provided charts (like Zerodha Kite or Angel One) typically offer 50-100 indicators and basic drawing tools. TradingView provides 400+ indicators, 110+ drawing tools, Pine Script custom coding, cloud-based alerts, volume profile analysis, and multi-chart layouts. Your analysis also syncs across all devices automatically. Most professional traders use TradingView for analysis and their broker only for order execution.
Official TradingView Resources
Curated links from TradingView's Help Center & Blog
Macro Maps on TradingView: explore, compare, track
Understanding global trends and the current market state is the foundation of financial analysis. Whatever asset you trade, knowledge of key economic ...
I am new to TradingView. Where can I learn more on how to use TradingView features and tools?
Our Help Center will tell you everything you need to know about built-in indicators and strategies that are commonly used in our charts. Check out our...
Chart trading on TradingView: key features and advantages
Chart trading is a TradingView feature that consists of a functionality for managing orders and positions directly on Supercharts. This provides a mor...
CoinDesk features TradingView Advanced Charts
Read fresh TradingView updates: CoinDesk features TradingView Advanced Charts. Discover more in our blog and stay connected with the latest platform news.
Improvements to Financials: compare reports, search for stats quickly, share your analysis
Read fresh TradingView updates: Improvements to Financials: compare reports, search for stats quickly, share your analysis. Discover more in our blog and stay connected with the latest platform news.
Indexed Scale – New Tool to Compare Changes
Read fresh TradingView updates: Indexed Scale - New Tool to Compare Changes. Discover more in our blog and stay connected with the latest platform news.
New features in Pine Script™: realistic backtests on Heikin Ashi charts, built-ins to access symbol info, and more
Read fresh TradingView updates: New features in Pine Script™: realistic backtests on Heikin Ashi charts, built-ins to access symbol info, and more. Discover more in our blog and stay connected with the latest platform news.
Related Articles
Continue your learning journey
What is TradingView?
A complete introduction to TradingView — the world's most powerful charting platform trusted by 100 million traders. Supercharts, Pine Script, screeners, and why it dominates.
ModuleTradingView Platforms
Desktop, web, and mobile — access your charts seamlessly from any device.

Written By
Rohit Singh
Mr. Chartist
With 14+ years of experience in Indian financial markets, Rohit Singh (Mr. Chartist) is a SEBI Registered Research Analyst, Amazon #1 bestselling author, and the founder of Investology — a premium trading ecosystem trusted by a 1.5 Lakh+ strong community across India.
TradingView is a registered trademark of TradingView, Inc. All screenshots, logos, and platform imagery are the property of TradingView, Inc. and are used here for educational purposes only under fair use. This content is not affiliated with, endorsed, or sponsored by TradingView.
(c) 2026 TradingView, Inc. All rights reserved. - www.tradingview.com