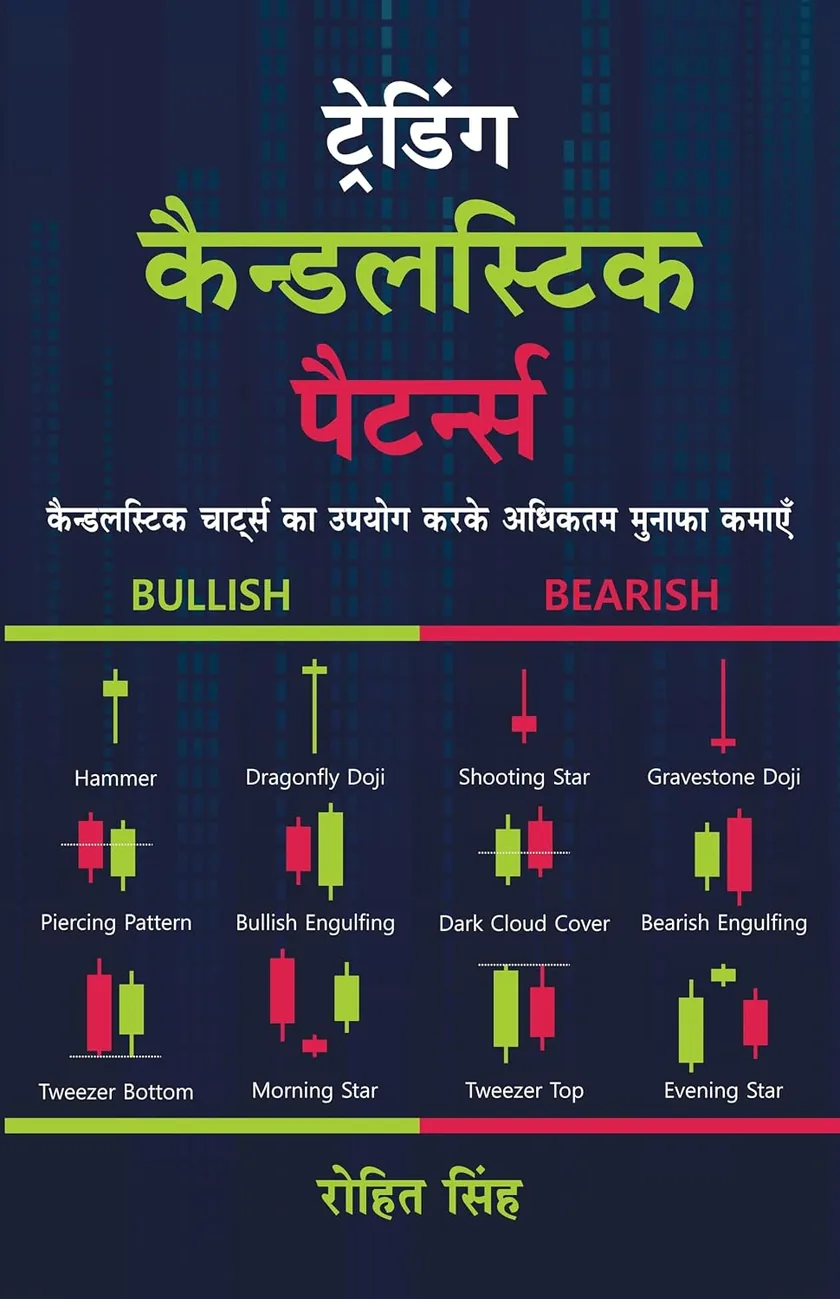
Indian charts. Not imported ones.
Every pattern is explained on Indian stocks and indices — Reliance, TCS, Nifty 50. No US examples. No made-up charts.
- NSE and BSE examples throughout
- Live chart screenshots included
- F&O and equity setups covered
Maximize Your Profits using Candlestick Charts
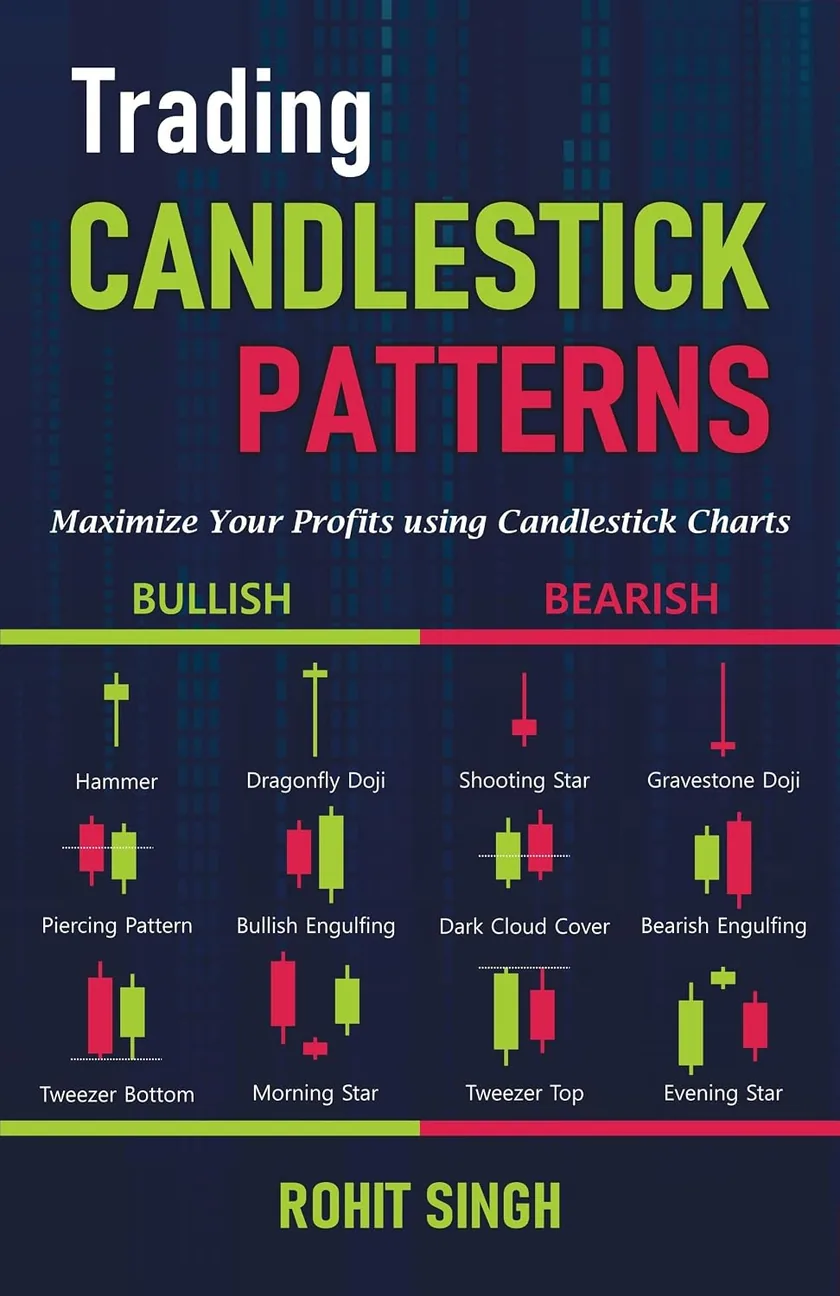
35+ candlestick patterns, each read in context — its location, its volume, its confirmation — on real NSE and BSE charts. And every setup ends in a plan: the entry, the stop-loss and the level that proves the idea wrong.
Paperback only. There is no PDF or eBook edition at present. The marketplace shows the current price.
Every candle is a fight between buyers and sellers. The body shows who won. The wicks show what it cost. The level shows whether it matters.
A hammer means little on its own. Where it forms, the volume behind it and the candle that follows decide what it is worth — and that is how this book reads every pattern, on Indian charts.
Every pattern is explained on Indian stocks and indices — Reliance, TCS, Nifty 50. No US examples. No made-up charts.
Why a pattern forms, not just what it looks like: who pushed, who gave way, and what that means for the next session.
18 chapters in sequence — from the anatomy of one candle to multi-pattern confluence and risk management.
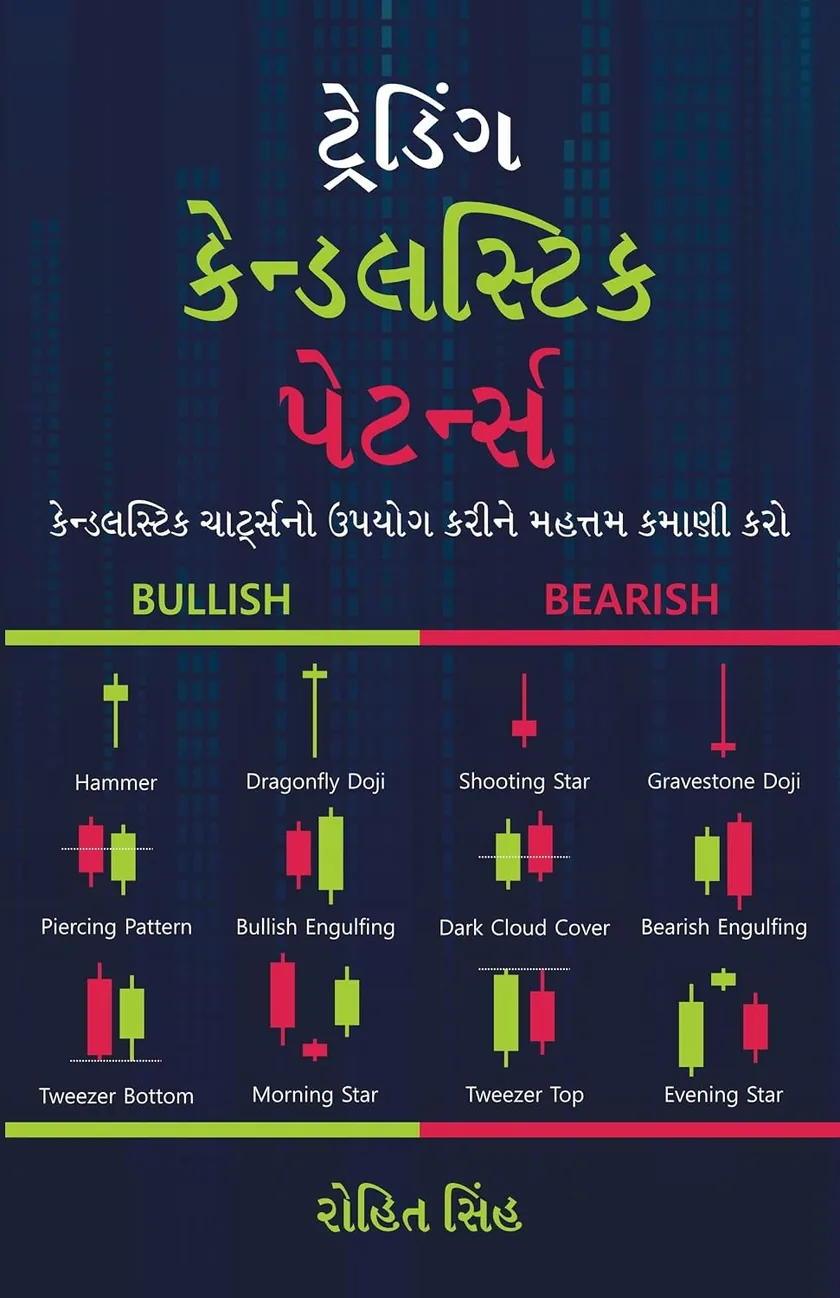
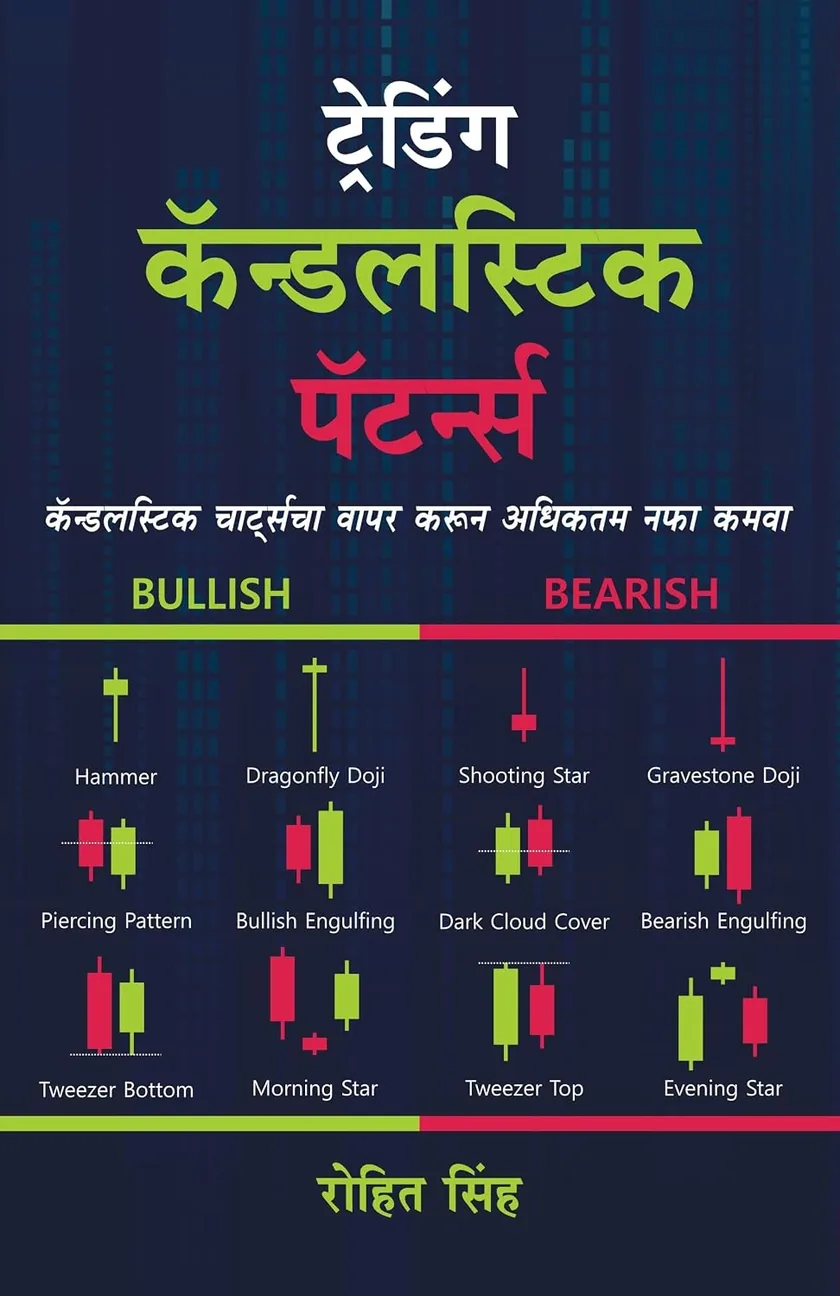
The same chapters in English, Hindi, Gujarati and Marathi — the language you think and trade in.
A structured, repeatable way to read charts — without leaning on lagging indicators.
Better timing at the level, and a filter for weak signals.
Candlestick theory, grounded in real Indian examples.
Clearer entry and exit points — and the psychology behind them.
A candle on its own is only a shape. These four steps turn it into a plan you can check — in the order the book teaches them.
The mistake
You spot a hammer or an engulfing candle, but cannot say who won the session.
The fix
Learn the anatomy first — body, wicks and close — and what each one says about buyers and sellers.
The mistake
The same pattern works at one level and fails at another, so every setup looks equally good.
The fix
Read a pattern only at support, resistance or a retest — and let volume agree before you trust it.
The mistake
The stop-loss gets decided after the trade has already moved against you.
The fix
Mark the entry trigger, the stop-loss and the level that proves the idea wrong — before you act.
The mistake
Wins and losses blur together, so the same mistake repeats for months.
The fix
Keep a simple journal — pattern, location, result. The book’s case studies show how to review each one.
18 chapters in the order you need them: the context first, then the candles, then the plan — ending with 20+ live case studies.
Part 01 · Chapters 1–7
Trend, volume and levels — the context every candle is read in.
A guided entry into candlestick trading, its origins, and why price action still matters in modern technical analysis.
The foundation of trends and market phases: higher highs, lower lows, and the logic behind every technical setup.
Compare line, bar and candlestick charts so price behaviour becomes easier to read at a glance.
Identify bullish, bearish and sideways markets so every setup aligns with the broader phase.
Use volume to confirm price moves, spot weak breakouts, and separate conviction from noise.
Map the price zones where reactions happen, then time entries, exits and stop placement with more control.
Draw clean trend lines to define direction, track momentum, and prepare for breakout or retest setups.
Part 02 · Chapters 8–12
Anatomy, then single, double and triple patterns, then blending.
Decode open, high, low, close, bodies and wicks so every candle tells a clear buyer–seller story.
Study Doji, Hammer, Shooting Star and Marubozu patterns for early reversal clues.
Read Engulfing, Harami, Piercing Line and Dark Cloud Cover as sentiment shifts across two candles.
Use Morning Star, Evening Star and Three White Soldiers for stronger multi-candle confirmation.
Blend multiple candles into one simplified signal to reduce noise and clarify the real move.
Part 03 · Chapters 13–18
Confluence, exits, risk and 20+ live case studies.
Apply moving averages to judge trend direction and dynamic support or resistance.
Stack candles with volume, levels and trend lines so only the strongest setups stand out.
Avoid the common errors that damage pattern reading, entries, stops and risk decisions.
Plan exits with targets, trailing stops and trend-riding logic so that profits can be protected.
Build discipline with position sizing, initial stop-loss, trailing stop-loss and risk–reward planning.
Study 20+ real-market case studies to see patterns, entries, exits and risk working together.
Drag the open, high, low and close — or use the arrow keys. The lab names the shape and tells you who won the session: the first skill the book teaches.
Start here
Every candle records four prices for its session: open, high, low and close. The body shows who won between the open and the close. The wicks show how far price travelled before it was pushed back.
Shape first, then location, then confirmation — the order the book teaches. The lab reads the shape; the book reads it with the trend before it, the level it forms at and the candle that follows.
Shape
Buyers won clearly and closed the session well above the open.
A shape is only the first clue. The book reads it with the trend before it, the level it forms at and the candle that follows.
15 core patterns from the book, from single candles to three-candle formations. Each card shows how the pattern forms, where it matters, what confirms it — and where the idea is proved wrong.
Showing 15 of 15
A long green candle with little or no wick. Buyers controlled the session from the open to the close.
Where it matters
Most meaningful when it breaks out of a range or closes above a resistance level. Inside a choppy range it says much less.
Price opens near the low and closes near the high. Sellers could not push it back at any point in the session.
The next candles hold above the middle of the Marubozu body. A quick fall back into the body weakens the read.
A close below the low of the Marubozu shows that the buying did not last.
Volume clearly above the recent average supports the idea that the move had wide participation.
Reacting after a long, extended rally. A large candle late in a move can mark exhaustion rather than strength.
Opposite pattern: Bearish Marubozu
A long red candle with little or no wick. Sellers controlled the session from the open to the close.
Where it matters
Most meaningful when it breaks below a support level or a range. Inside a range it is often just noise.
Price opens near the high and closes near the low. Buyers could not recover any part of the fall.
The next candles stay below the middle of the Marubozu body. A fast recovery into the body weakens the read.
A close above the high of the Marubozu shows that the selling did not last.
Volume clearly above the recent average supports the idea that the selling had wide participation.
Reacting after a long, steep fall. A large red candle late in a decline can mark capitulation.
Opposite pattern: Bullish Marubozu
A small body near the top of the range with a long lower wick, at least twice the body. Buyers rejected the lower prices.
Where it matters
Only a Hammer after a decline and at a support zone counts. The same shape in the middle of a range is not a Hammer.
Price falls sharply during the session, then buyers step in and push it back up close to the open.
The next candle closes above the high of the Hammer.
A close below the low of the Hammer’s wick — the level the buyers defended.
Higher volume on the Hammer suggests the rejection of lower prices had real participation.
Treating every long lower wick as a Hammer without checking the trend before it and the level it formed at.
Opposite pattern: Shooting Star
A small body near the bottom of the range with a long upper wick, at least twice the body. Sellers rejected the higher prices.
Where it matters
Only meaningful after a rise and at a resistance zone. In the middle of a range it carries little weight.
Price rallies during the session, then sellers push it back down close to the open.
The next candle closes below the low of the Shooting Star.
A close above the high of the upper wick — the level the sellers defended.
Higher volume on the rejection candle suggests the selling at the highs had real participation.
Ignoring a strong uptrend. One rejection candle rarely turns a healthy trend on its own.
Opposite pattern: Hammer
The open and the close are equal or nearly equal. Neither buyers nor sellers won the session — the market is undecided.
Where it matters
A Doji after a long trend, or at support or resistance, can be an early sign that the trend is tiring.
Price moves in both directions during the session but closes at or near the opening price.
A Doji is not a signal by itself. The candle that follows shows which side takes control.
There is no direction to invalidate yet. Its high and low become the levels to watch.
Usually lower volume. A Doji on unusually high volume at a turning point deserves closer attention.
Acting on the Doji alone instead of waiting for the next candle.
Opposite pattern: Dragonfly Doji
The open, high and close are at the top, with a long lower wick — a “T” shape. Buyers rejected the lows completely.
Where it matters
Meaningful after a decline and at a support zone. Elsewhere it is simply indecision.
Price falls sharply during the session, then buyers bring it all the way back to the opening level.
The next candle closes above the high of the Dragonfly Doji.
A close below the low of the long lower wick.
Higher volume on the Dragonfly suggests the recovery from the lows had participation.
Reading it in the middle of a range, where it says very little about direction.
Opposite pattern: Gravestone Doji
The open, low and close are at the bottom, with a long upper wick — an inverted “T”. Sellers rejected the highs completely.
Where it matters
Meaningful after a rise and at a resistance zone.
Price rallies strongly during the session, then sellers push it all the way back to the opening level.
The next candle closes below the low of the Gravestone Doji.
A close above the high of the long upper wick.
Higher volume on the Gravestone suggests the selling at the highs had participation.
Treating it as a reversal in a strong uptrend without any follow-through.
Opposite pattern: Dragonfly Doji
A green candle whose body completely covers the body of the previous red candle. Control shifts from sellers to buyers.
Where it matters
Strongest after a decline and at a support zone. After a sideways drift it is much weaker.
Candle 1 is red. Candle 2 opens at or below the close of candle 1 and closes above its open.
The next candle holds above the middle of the engulfing body, or closes above its high.
A close below the low of the engulfing candle.
Volume on the engulfing candle higher than on the candle before it supports the shift in control.
Reading every large green candle as an engulfing pattern without checking the trend and location.
Opposite pattern: Bearish Engulfing
A red candle whose body completely covers the body of the previous green candle. Control shifts from buyers to sellers.
Where it matters
Strongest after a rise and at a resistance zone.
Candle 1 is green. Candle 2 opens at or above the close of candle 1 and closes below its open.
The next candle stays below the middle of the engulfing body, or closes below its low.
A close above the high of the engulfing candle.
Volume on the engulfing candle higher than on the candle before it supports the shift in control.
Ignoring the larger trend. In a strong uptrend, one engulfing candle is often only a pause.
Opposite pattern: Bullish Engulfing
Two candles with matching or nearly matching lows. The same price was tested twice and buyers defended it both times.
Where it matters
Meaningful at a known support zone after a decline.
Candle 1 makes a new low. Candle 2 tests the same low but closes higher.
A close above the high of the second candle.
A close below the matching lows.
Higher volume on the second, bullish candle supports the idea that buyers are defending the level.
Accepting lows that only roughly match. The closer the two lows, the clearer the message.
Opposite pattern: Tweezer Top
Two candles with matching or nearly matching highs. The same price was tested twice and sellers defended it both times.
Where it matters
Meaningful at a known resistance zone after a rise.
Candle 1 makes a new high. Candle 2 reaches the same high but sellers push it back down.
A close below the low of the second candle.
A close above the matching highs.
Higher volume on the second, bearish candle supports the idea that sellers are defending the level.
Reading it in a strong uptrend without any other sign of weakness.
Opposite pattern: Tweezer Bottom
After a red candle, a green candle opens lower and closes above the middle of the red body — it “pierces” into it.
Where it matters
Meaningful after a decline and near support.
Candle 1 is red. Candle 2 opens below its close, then recovers to close above 50% of candle 1’s body.
The next candle closes above the high of the piercing candle.
A close below the low of the piercing candle.
Higher volume on the second candle than on the first supports the recovery.
Accepting a close below the halfway mark. That is a weaker pattern, not a Piercing Pattern.
Opposite pattern: Dark Cloud Cover
The bearish opposite of the Piercing Pattern. After a green candle, a red candle opens higher and closes below the middle of the green body.
Where it matters
Meaningful after a rise and near resistance.
Candle 1 is green. Candle 2 opens above its close, then falls to close below 50% of candle 1’s body.
The next candle closes below the low of the dark cloud candle.
A close above the high of the dark cloud candle.
Higher volume on the second candle than on the first supports the selling.
Accepting a close above the halfway mark, which is a much weaker message.
Opposite pattern: Piercing Pattern
A three-candle reversal: a large red candle, a small undecided candle, then a large green candle. The decline loses its force.
Where it matters
Most meaningful at a major support zone after a clear decline.
Candle 1 is a large red candle. Candle 2 has a small body. Candle 3 is a large green candle that closes above the middle of candle 1.
The third candle itself is the confirmation; follow-through above its high adds to it.
A close below the low of the middle candle (the “star”).
The third candle ideally carries the highest volume of the three.
Accepting a third candle that closes only slightly higher. It should recover well into candle 1’s body.
Opposite pattern: Evening Star
A three-candle reversal: a large green candle, a small undecided candle, then a large red candle. The rise loses its force.
Where it matters
Most meaningful at a major resistance zone after a clear rise.
Candle 1 is a large green candle. Candle 2 has a small body. Candle 3 is a large red candle that closes below the middle of candle 1.
The third candle itself is the confirmation; follow-through below its low adds to it.
A close above the high of the middle candle (the “star”).
The third candle ideally carries the highest volume of the three.
Reading it in the middle of a range, where there is no rise to reverse.
Opposite pattern: Morning Star
These are 15 of the 35+ in the book. There, each one comes with real Indian charts, volume context, stop-loss placement and risk management.
Get the bookThe same chapters in English, Hindi, Gujarati and Marathi. Learn in the language you think in.
Format, languages, where to buy — and what the book is not.
Yes. The book starts from basic candle anatomy and builds step by step to multi-candle patterns, confluence and risk management. No prior experience is needed.
Yes. The 20+ case studies use real Nifty, Bank Nifty and Indian stock charts, so each pattern is shown where Indian traders actually meet it.
English, Hindi, Gujarati and Marathi. Each edition carries the same chapters and is translated for clarity, with trading terms kept recognisable.
Not at present. The book is available as a paperback only, on Amazon India and Flipkart.
On Amazon India and Flipkart. Choose your language on this page and the buttons open that edition’s listing; the marketplace shows the current price and delivery options.
It reads every pattern with its location, volume and confirmation, uses real Indian market examples, and ends each setup with a plan — entry, stop-loss and the level that proves the idea wrong — rather than listing shapes encyclopedia-style.
No. It is educational. The chart examples show how a pattern formed and how it can be read; they are not recommendations to buy, sell or hold any security.
Paperback · four languages
Pick your language. Each button opens that edition on Amazon India or Flipkart.
Book details

SEBI Registered Research Analyst · INH000015297
I started studying markets as a student and never stopped. Fourteen years later, everything I build exists for one reason: I needed it myself, and I could not find it built properly anywhere else.
Educational content only. The books and these pages explain how to read candlesticks and chart patterns; they are not investment advice and not a recommendation to buy, sell or hold any security, and no pattern guarantees an outcome. Chart examples are historical and shown for education. Registration granted by SEBI, membership of BASL and certification from NISM in no way guarantee performance of the intermediary or provide any assurance of returns to investors. Investments in the securities market are subject to market risks; read all the related documents carefully before investing.
Trading Chart Patterns picks up where this book ends: 19 classic patterns, read through support, resistance and confirmation. The question stops being “which pattern is this?” and becomes “what structure is controlling price?”
Essential storage keeps sign-in and preferences working. Optional analytics helps improve the website. Read our Privacy Policy.