Price memory · Ch. 5
Horizontal
Horizontal support–resistance
Repeated reactions at the same price level. They show price memory and a balance between buyers and sellers; breakouts need clear acceptance.
Read the structure. Not just the shape.
Support, resistance, time, volume and participation organise price into chart patterns. This book shows how — and how to judge which of those patterns deserve your attention.
Paperback, 256 pages · ISBN 9788199128118. The marketplace shows the current price.
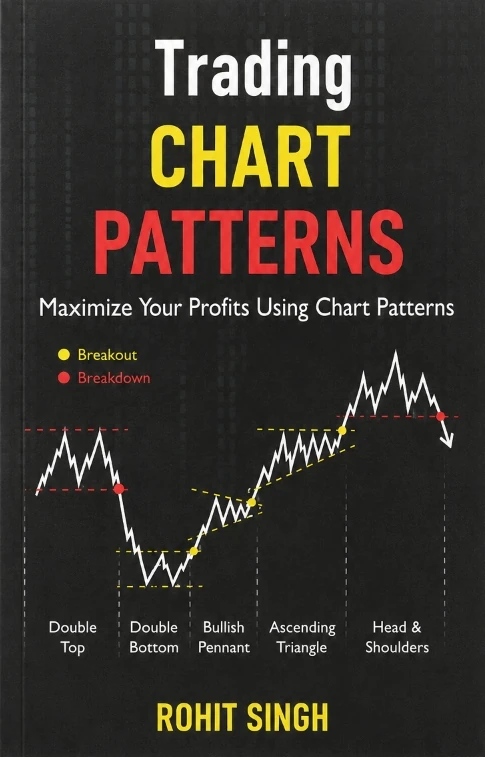
A chart pattern is not a shape to memorise. It is the structure buyers and sellers leave behind. The breakout asks the question. Volume answers it.
Every chart pattern is an outcome of how price behaves around support and resistance. So the book groups its 19 patterns by the structure that dominates them — not by their names — into four categories.
Price memory · Ch. 5
Horizontal support–resistance
Repeated reactions at the same price level. They show price memory and a balance between buyers and sellers; breakouts need clear acceptance.
Momentum · Ch. 6
Diagonal support–resistance
Price respects a rising or falling path. They show momentum and directional pressure, resolve faster than horizontal structures, and fail sharply.
Defence and pressure · Ch. 3
Mixed horizontal and diagonal
One side defends a fixed horizontal level while the other applies rising or falling pressure, until the defending side gives way.
Transition · Ch. 7
Curved + horizontal support–resistance
Slow, rounded transitions, usually completed by a horizontal breakout or breakdown level. They take time to form and need patience.
Pick a family, then a pattern. The teaching chart draws support and resistance first — then the breakout, the stop and the measured move, in the order the book reads them.
Repeated reactions at the same price level. They show price memory and a balance between buyers and sellers; breakouts need clear acceptance.
Built from OHLC numbers, not drawn by hand. Prices are teaching values, not market data.
From the book · annotated by Mr. Chartist
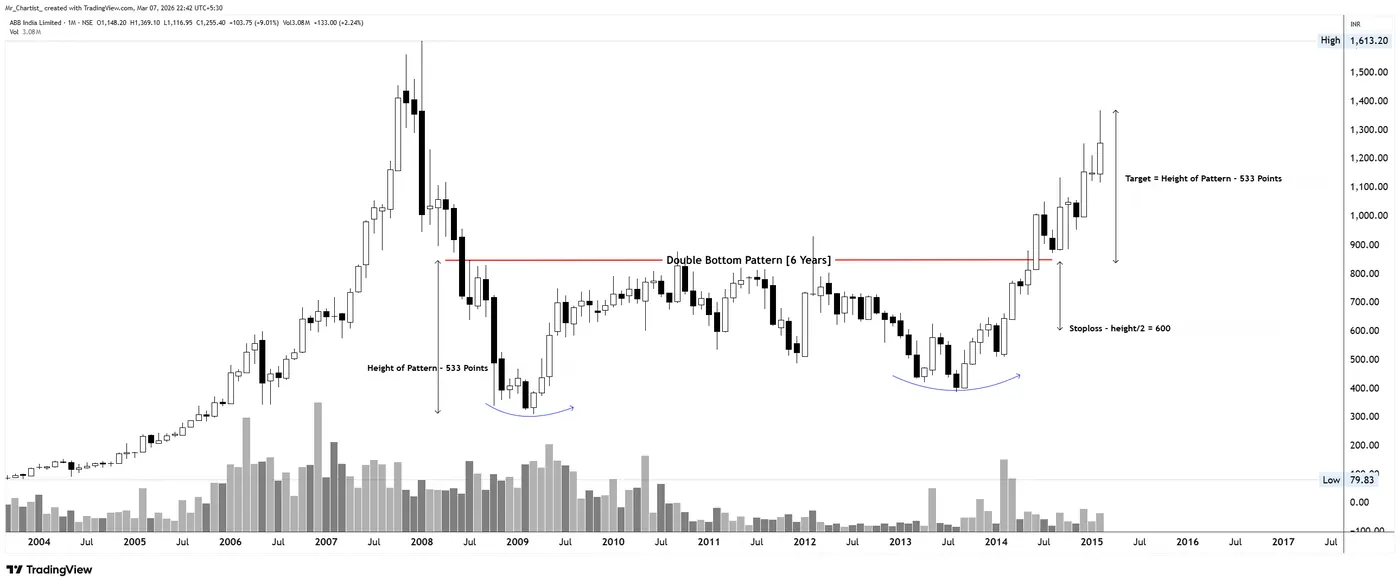
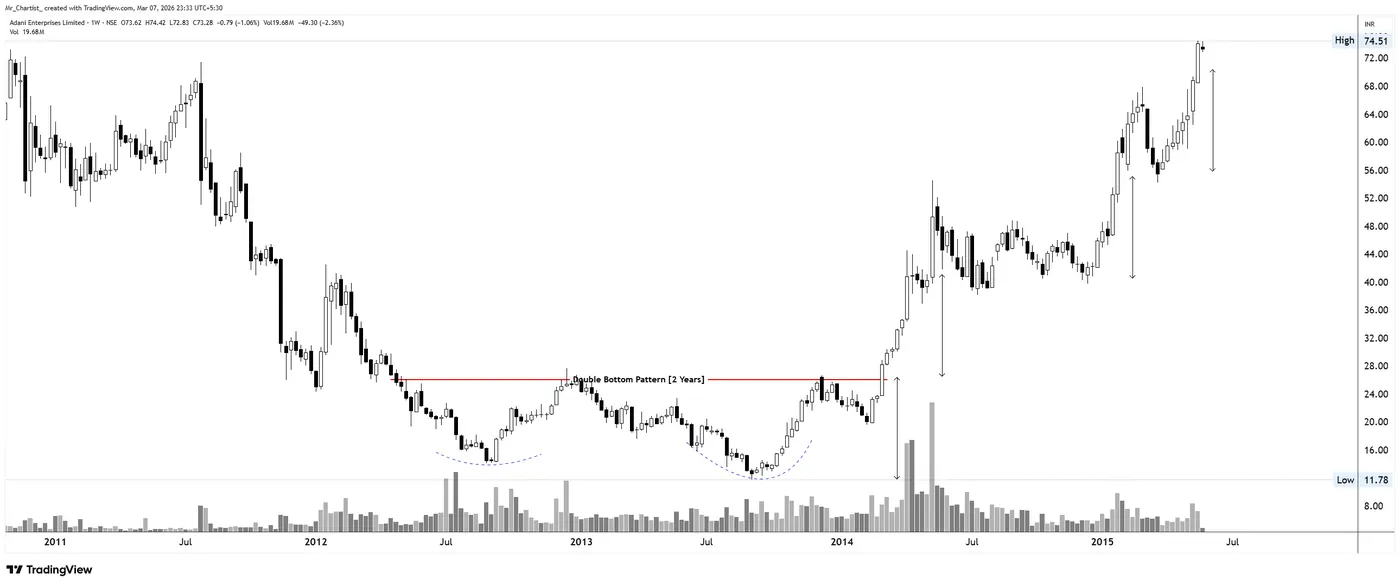
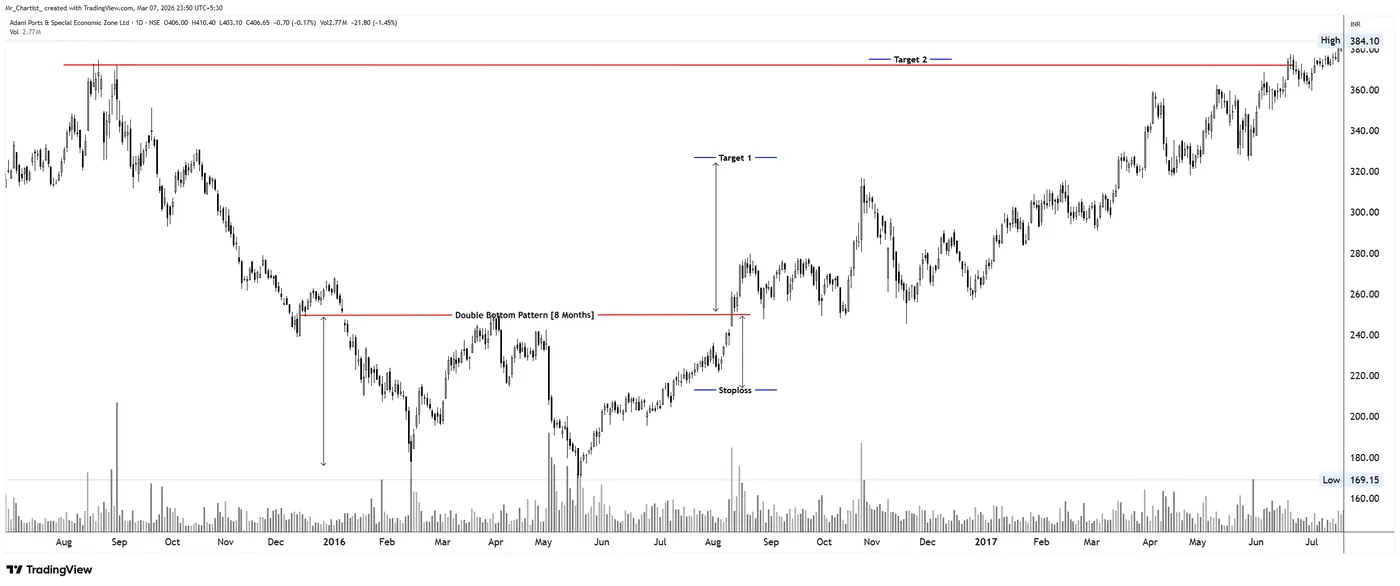
A bullish reversal structure in which the same horizontal support is defended twice after a downtrend. The book reads it as support holding under repeated pressure, not as a “W” shape to be spotted.
Mark the support zone where two troughs form, with enough candles between them to show a real retest. The high of the rebound between the troughs is the neckline, the horizontal level that decides the pattern.
Sellers try to push price below the same support twice and fail. On the second attempt the selling looks tired: smaller bodies, firmer closes and lighter volume suggest that demand is absorbing supply.
The book treats the pattern as complete only after a decisive close above the neckline, ideally a strong bullish candle with expanding volume. A retest of the neckline from above that holds adds further evidence.
The idea is proved wrong when price falls back deep into the structure. The book frames the stop around the middle of the pattern’s height and uses the support-to-neckline height as the measured-move reference.
Two random lows close together, or lows formed without a prior downtrend, do not qualify. Acting before the neckline breaks, or on a wick above it, is the common mistake the book warns against.
See the double bottom on real, dated ChartBook setups.
Open the lessonA bearish reversal structure in which price fails twice at the same horizontal resistance after an uptrend. The book reads it as resistance being defended twice, a sign of distribution rather than a simple “M” shape.
Mark the resistance zone where two peaks form, separated by a meaningful pullback. The low of that pullback is the neckline. The pattern is judged at this horizontal level, not at the peaks.
Buyers attempt to move beyond the same resistance twice and fall short. The second rally is weaker, with smaller bodies, upper wicks and lighter volume, suggesting that supply is steadily absorbing demand.
The book requires a decisive close below the neckline, ideally a strong bearish candle with expanding volume. A retest from below that fails to reclaim the neckline supports the reading that support has turned into resistance.
The structure is invalidated if price recovers back into the pattern. The book places the stop around the midpoint of the pattern’s height and uses the resistance-to-neckline height as the measured-move reference.
Two highs formed too quickly, too far apart or without a prior uptrend are often noise. Anticipating the breakdown before the neckline gives way raises the risk of a false signal.
A balance phase in which price moves sideways between flat resistance and flat support. The book treats it as preparation, not a decision; the prior trend and context decide how it is read.
Draw horizontal resistance and support from repeated reactions at the same zones over a good number of candles. One or two sideways swings are not enough; the book looks for consistent respect of both boundaries.
Buyers defend the lower zone and sellers cap the upper zone, but neither side dominates. Orders are absorbed and ownership changes hands, so the range may reflect accumulation or distribution depending on where it forms.
The book waits for a decisive close beyond the boundary in question, supported by visible volume expansion. A retest of the broken level that holds, with old resistance acting as support or vice versa, strengthens the reading.
A return deep inside the range weakens the idea. The book frames the stop using roughly half the rectangle’s height from the broken level, and projects the full height from the breakout as the measured move.
Immature, shallow ranges often lack follow-through. Wicks beyond a boundary without a close usually signal rejection, and the book cautions against assuming direction before price leaves the range with acceptance.
See the rectangle on real, dated ChartBook setups.
Open the lessonA compressed bullish continuation structure: a sharp rally (the pole) followed by a short, narrow pause (the flag). The book describes it as a rectangle that never had time to mature because momentum stayed strong.
The pole is a near-vertical advance of wide bullish candles. The flag is a tight, brief consolidation between two parallel boundaries, either sideways or sloping mildly downward, and small relative to the pole.
Early buyers book some profit while new buyers wait for a better price. Sellers try to push lower but gain little ground. Quiet volume inside the flag suggests rest, not distribution.
The book looks for a decisive close above the flag’s upper boundary with a strong bullish candle and clear volume expansion. A retest of the broken flag line that holds is treated as additional confirmation.
A deep return into the flag invalidates the continuation idea. The book bases both the stop distance and the first measured move on the flag’s height, and uses the pole’s length as a reference for an extended move.
Treating an intraday poke above the flag as a breakout is a common error. The book also notes that the pattern belongs inside an established uptrend; without that context the structure loses meaning.
See the bull flag on real, dated ChartBook setups.
Open the lessonThe bearish mirror of the Flag & Pole: a steep decline (the pole) followed by a short, shallow pause before the downtrend often resumes. The book notes it is seen less often than the bullish version.
The pole is a near-vertical fall of wide bearish candles. The inverted flag is a tight consolidation between two parallel lines that are flat or slope mildly upward, resembling a small rising channel.
Short sellers book some profit and bargain hunters try to buy the dip, but rebounds stay weak and short-lived. Subdued volume during the pause suggests rest within weakness rather than genuine strength.
The book requires a decisive close below the flag’s lower boundary, ideally a strong bearish candle with expanding volume. A failed retest of the broken line from below supports the bearish continuation reading.
A deep move back inside the flag invalidates the idea. As with the bullish version, the flag’s height frames both the stop distance and the first measured move, with the pole’s length as an extended reference.
Mistaking a mild upward drift for recovery, or acting on an intraday dip below support without a close, are the errors the book highlights. The pause should stay brief and tight relative to the pole.
An orderly rise between two parallel rising trendlines that looks healthy on the surface. The book argues it often reflects controlled distribution, so it can carry a bearish bias when the rise lacks expansion.
Connect the rising swing lows for support and the rising swing highs for resistance, keeping the lines parallel. Look for several clean touches on both lines; the book expects the channel to develop gradually, not impulsively.
Late buyers keep entering near rising support, believing the trend is intact, while earlier participants distribute patiently near the top. The rise persists because selling is measured, not because buying is expanding.
The book treats a decisive close below the lower channel line, ideally with expansion in range or volume, as the signal that the structure has failed. A failed retest of that line from below adds confirmation.
The book places invalidation above the last swing high inside the channel. It uses the channel’s height projected from the breakdown as a first reference, and the zone where the channel began as a structural reference.
The main trap is assuming every pullback to support is an opportunity to join the uptrend. Single wicks below support, or a quick reclaim back inside the channel, do not count as confirmation.
An orderly decline between two parallel falling trendlines. The book reads it as controlled absorption rather than true weakness, so it can carry a bullish bias when the fall lacks expansion in momentum or participation.
Connect the falling swing highs for resistance and the falling swing lows for support, keeping the lines parallel. Several clean touches on both boundaries, built gradually over time, give the channel its meaning.
Late sellers keep selling near falling resistance while earlier sellers quietly cover and patient buyers absorb supply near the lows. The decline continues because buying is measured, not because selling is growing.
The book looks for a decisive close above the upper channel line, ideally with a strong body and expansion in range or volume. A retest from above that holds as support adds confirmation.
The book places invalidation below the last swing low inside the channel. A first reference is the channel’s height projected from the breakout; a second, structural reference is the zone where the decline began.
Treating every rally as a fresh selling opportunity is the trap the book describes. Intraday spikes or partial closes above resistance, and a fall back inside the channel, mean the breakout is not confirmed.
See the descending channel on real, dated ChartBook setups.
Open the lessonA compression pattern of lower highs and higher lows between two converging trendlines. The book calls it neutral in structure: it prepares for direction rather than predicting it, and can act as continuation or reversal.
Draw a falling resistance line across the lower highs and a rising support line across the higher lows. Swings tighten, candles overlap and volatility contracts as price moves toward the apex.
Buyers stop chasing and sellers stop pressing, so both sides reduce commitment. The narrowing range reflects a temporary balance; whichever side regains confidence first tends to drive price out of the structure.
The book requires a decisive close beyond one of the trendlines, ideally with expansion in range or volume. A retest of the broken line that respects the role reversal strengthens the signal.
The book’s main invalidation is the last swing inside the triangle before the break, with a mid-pattern stop as an alternative when that swing is too far. The widest height of the triangle serves as the measured-move reference.
Guessing the direction before the break is the key error. The book also stresses that textbook-perfect triangles are rare, and that a quick return inside the lines after a break is a warning.
A short, tight compression after a sharp move, resolving in the direction of that move. The book describes it as a fast version of the symmetrical triangle and treats it only as a continuation pattern, in bullish and bearish forms.
Start with the pole, an aggressive one-sided move of wide candles. Then draw two quickly converging trendlines around the small consolidation that follows. The pennant stays compact and forms relatively quickly.
After the impulse, early participants book partial profit and newcomers hesitate to chase. Counter-trend attempts lack follow-through, so price compresses instead of reversing; strength or weakness is resting, not changing hands.
The book requires a decisive close outside the pennant in the direction of the pole, ideally with expansion in range or volume. A retest of the broken line that respects the role reversal adds weight.
The book places the stop outside the pennant, beyond the opposite trendline or the last swing inside it. The pole’s length, projected from the breakout, is used as the measured-move reference.
Confusing a pennant with a broader triangle near a turning point is a common error; the book says pennants do not usually appear at major tops or bottoms. A breakout that falls back inside is treated as weak.
A narrowing decline between two falling trendlines that the book reads as weakening supply. It looks bearish, but its usual outcome is bullish; where it forms decides whether it is a continuation or a reversal.
Both lines slope downward, but the resistance line falls faster than the support line, so the range narrows as price drifts lower. New lows become marginal and bounces stay shallow.
Sellers are still active but their follow-through weakens, while patient buyers absorb supply at lower levels. Price falls with effort, not dominance, and the shrinking range suggests that selling energy is fading.
The book requires a decisive close above the falling resistance line, ideally with expansion in range or volume. A retest from above that holds as support strengthens the bullish reading.
The book places invalidation below the last swing low near the bottom of the wedge, or below the support line when the structure is clean. The wedge’s height projected from the breakout is the first reference.
Reading the falling highs and lows as continued weakness is the trap the book describes. A breakout that quickly slips back inside the wedge and holds there is treated as weak or unconfirmed.
See the falling wedge on real, dated ChartBook setups.
Open the lessonA narrowing advance between two rising trendlines that the book reads as weakening demand. It looks bullish, but its usual outcome is bearish; where it forms decides whether it is a continuation or a reversal.
Both lines slope upward, but the support line rises faster than the resistance line, so the range narrows as price climbs. New highs become marginal and pullbacks stay shallow.
Buyers keep entering, sometimes out of fear of missing out, while informed sellers reduce exposure into strength. Price rises with effort rather than dominance, which suggests that demand is no longer strong enough.
The book requires a decisive close below the rising support line, ideally with expansion in range or volume. A failed retest of the broken line from below supports the bearish reading.
The book places invalidation above the rising resistance line or the last swing high near the top of the wedge. The wedge’s height projected from the breakdown is the first reference.
Mistaking rising highs for healthy strength is the core trap. The book also warns against acting before a confirmed close below support, since wedges can grind higher longer than expected.
A mixed structure that combines a flat resistance with rising support. One side defends a fixed level while the other applies steadily rising pressure.
Draw the horizontal resistance that sellers keep defending, then the rising support line through the higher lows. As the lows rise, the space below the flat ceiling narrows.
Sellers defend a fixed level while buyers step in at progressively higher prices. In the book’s framework, each reaction adds pressure against the defended level until the defending side gives way.
Consistent with the book’s general rule, the structure is treated as confirmed only after a decisive close beyond the horizontal level, ideally with volume expansion, rather than on a wick or intraday move.
As with every structure in the book, the idea is proved wrong beyond the same support and resistance that formed the pattern — a return inside the triangle after the breakout weakens the read.
The book’s general warnings apply: drawing lines to fit a hoped-for pattern, and treating a single wick above resistance as a breakout, are the usual mistakes.
See the ascending triangle on real, dated ChartBook setups.
Open the lessonA mixed structure that combines flat support with falling resistance. One side defends a fixed level while the other presses with steadily lower highs.
Draw the horizontal support that buyers keep defending, then the falling resistance line through the lower highs. As the highs fall, the space above the flat floor narrows.
Buyers defend a fixed level while sellers appear at progressively lower prices. In the book’s framework, the repeated pressure against the defended level gradually weakens the defending side.
Consistent with the book’s general rule, the structure is treated as confirmed only after a decisive close below the horizontal support, ideally with volume expansion, not on a brief intraday dip.
As with every structure in the book, the idea is proved wrong beyond the same support and resistance that formed the pattern — a return inside the triangle after the breakout weakens the read.
The book’s general warnings apply: a breakdown without volume is a question mark, not weakness, and a quick return above the support level suggests the move has not been accepted.
A gradual transition in which one side of the structure bends smoothly while the other stays flat. The book presents bullish and bearish versions and treats the curve as preparation; the flat level is where the decision happens.
Mark the horizontal decision level first. In the bullish form, price builds a rising curved support beneath flat resistance; in the bearish form, a falling curved resistance above flat support, with several reactions along the curve.
Control shifts slowly, without panic or urgency. In the bullish form buyers absorb supply patiently, so each pullback holds higher; in the bearish form sellers absorb demand, so each rally peaks lower.
The book requires a decisive close beyond the flat level, ideally a strong candle with expanding volume. A retest of the broken level that respects the role reversal reinforces the reading.
The book uses a mid-pattern stop based on half the curve’s height measured from the flat level, and the curve’s full height projected from the breakout as the measured-move reference.
A V-shaped turn is not a curve; it reflects emotion, not absorption. The book also warns that a rounding that forms too quickly, or that loses its higher lows, may only be a temporary reaction.
A long, broad base on the higher timeframe in which price repairs slowly before expanding. In the book’s framework it is defined by duration: shorter rounded bases are treated as Curve patterns instead.
Look for a smooth, extended curve on the monthly chart that develops over several years, together with a clear long-term decision level, usually an old resistance formed before the base began.
Weak hands exit, public interest fades and volatility contracts while stronger participants accumulate without urgency. Dips grow shallower and recoveries hold better, showing stability rather than excitement.
The book requires a decisive close above the long-term decision level, visible on the higher timeframe and supported by expanding volume. A retest that holds the old resistance as support adds confidence.
The book frames this as a position-management structure with wide, structure-based risk, using a mid-pattern reference. The measured move is treated as a milestone rather than a final objective, with exits led by structure.
Treating it like a short-term setup, with tight stops and quick exits, is the mistake the book highlights. Calling a short rounded move a Rounding Bottom is another; the book reserves the name for multi-year bases.
See the rounding bottom on real, dated ChartBook setups.
Open the lessonA rounded base beneath horizontal resistance, followed by a shallow pause near the top. The book describes it as quietly strong and most effective as a bullish continuation within an established uptrend.
Mark the flat resistance first. Below it, price declines gently, forms a rounded base and rises back toward resistance (the cup), then pauses in a shallow consolidation in the upper part of the cup (the handle).
Supply is absorbed gradually without panic. Buyers hold but do not chase; in the handle, weak holders exit and a final push lower fails, suggesting that selling pressure is largely exhausted.
The book requires a decisive close above the horizontal resistance, ideally a strong bullish candle with expanding volume. A retest of the broken resistance that holds as support reinforces the structure.
The book places the stop just below the lowest point of the handle; a decisive fall back into the handle signals failure. The cup’s depth projected from the breakout is the measured-move reference.
Losing patience because the structure looks slow is the common error. The book also notes reduced reliability when the same shape forms in a weak or declining phase, and that a deep handle undermines the setup.
See the cup and handle on real, dated ChartBook setups.
Open the lessonThe bearish counterpart of the Cup & Handle: a rounded top above horizontal support, followed by a shallow pause near the lows. The book describes it as controlled distribution, most effective within an established downtrend.
Mark the flat support first. Above it, price rises gently, forms a rounded top and declines back toward support (the inverted cup), then pauses in a shallow consolidation in the lower part of the structure (the handle).
Demand weakens gradually and supply grows in a controlled way. In the handle, weak buyers exit and a final push higher fails, suggesting that buying pressure is largely exhausted while sellers stay patient.
The book requires a decisive close below the horizontal support, ideally a strong bearish candle with expanding volume. A failed retest of the broken support from below reinforces the reading.
The book places the stop just above the highest point of the handle; a decisive rise back into the handle signals failure. The height of the inverted cup projected from the breakdown is the measured-move reference.
Expecting a fast breakdown and losing interest during the slow phase is common. The book notes reduced reliability when the shape forms during a strong bullish phase.
A reversal structure after an uptrend built on the progressive failure of strength. The book calls it structurally honest: it reveals weakness that is already developing while price still looks firm.
Three peaks around a horizontal or slightly sloping neckline: a left shoulder, a higher head and a lower right shoulder. The neckline joins the pullback lows between the peaks and is the decision level.
Buyers keep expecting continuation while sellers quietly distribute into optimism. The right shoulder, a rally that fails to reach the head, shows effort without progress and marks control shifting to sellers.
The book requires a decisive close below the neckline, ideally a strong bearish candle with expanding volume. A failed retest of the neckline from below supports the reversal reading.
The book’s common invalidation is above the right shoulder high or the neckline retest zone; a reclaim of the neckline is treated as failure. The head-to-neckline distance projected from the break is the reference.
Treating every pullback as a fresh opportunity to join the uptrend is the trap. The book also cautions that the pattern loses meaning without a prior uptrend, or when it forms in sideways or already weak markets.
A reversal structure after a downtrend built on the progressive failure of weakness. The book describes it as revealing strength that is already developing while price still looks depressed.
Three troughs around a horizontal or slightly sloping neckline: a left shoulder, a deeper head and a higher right shoulder. The neckline joins the rebound highs between the troughs and is the decision level.
Sellers keep expecting continuation while buyers quietly accumulate into pessimism. The right shoulder, a decline that fails to reach the head, shows effort without result and marks control shifting to buyers.
The book requires a decisive close above the neckline, ideally a strong bullish candle with expanding volume. A retest of the neckline from above that holds adds confirmation.
The book’s common invalidation is below the right shoulder low or the neckline retest zone; a sustained fall back below the neckline is treated as failure. The head-to-neckline distance is the measured-move reference.
Treating every bounce as a selling opportunity, and so missing the shift, is the trap described. The book also notes reduced reliability without a prior downtrend or in sideways or already strong markets.
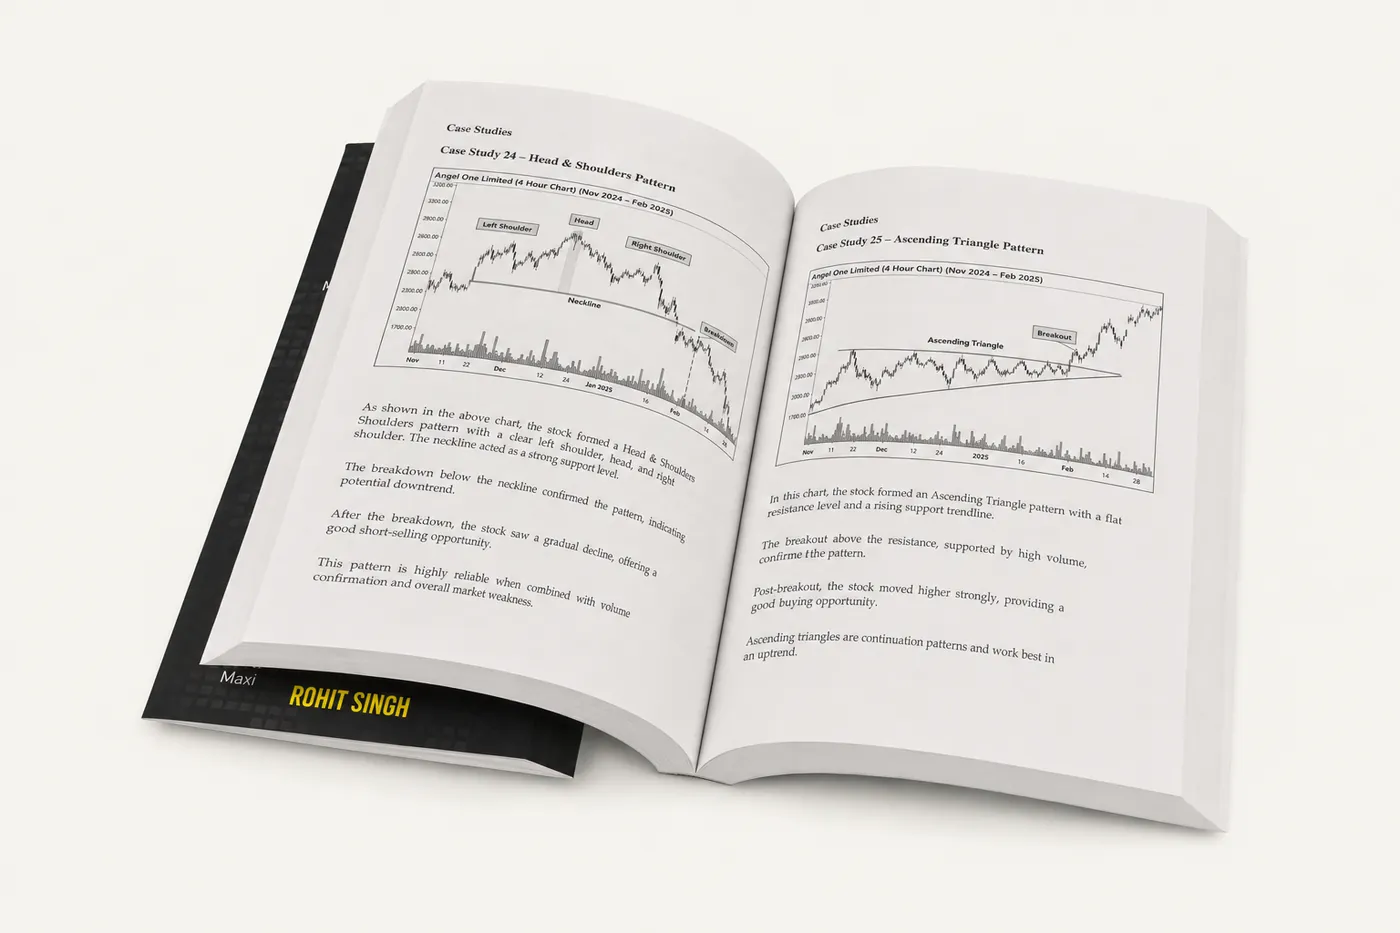
Each pattern section in Chapters 5 to 7 follows the same order: how the structure forms, the psychology inside it, its stages of development, and how to trade it — with entry, stop-loss and a measured-move target — followed by an example on a real chart.
The question changes
From
Which pattern is this?
To
What type of structure is controlling price here?
Patterns appear everywhere. Only a few are tradeable. Chapter 4 names the four factors that separate a structure worth attention from a shape that only looks neat.
Draw support and resistance first and let the pattern appear. A pattern only shows where price has reacted again and again.
Volume confirms acceptance. A breakout or breakdown should come with clear volume expansion; on flat volume, the risk of a trap is high.
The distance between the key boundaries. It shows the volatility inside the structure and the risk it asks of you. Compare it on the same timeframe.
The number of candles the pattern takes to form. The longer it builds, the more conviction its resolution tends to carry.
First the foundation: price, time and participation, support and resistance, and the classification. Then the factors that decide success, and one chapter for each family of patterns.
Price, time and participation as the building blocks of market structure. Written as a continuation of Book One, not a repetition.
The foundation of every pattern, and the three forms it takes on a chart: horizontal, diagonal and curved.
Patterns grouped by the support–resistance structure that dominates them, with continuation and reversal treated as a secondary view.
Pattern is structure, not signal. Then volume, the height of the pattern and the length of the pattern.
Consolidation as a market phase, then Double Bottom, Double Top, the four Rectangle forms, Flag & Pole and Inverted Flag & Pole.
How the market respects a path: channels, the symmetrical triangle, pennants and wedges, with their continuation and reversal variants.
When the market stops fighting and starts changing: Curve, Rounding Bottom, Cup & Handle, Inverted Cup & Handle and both forms of Head & Shoulders.
You can read single candles. Now you want to see the larger structure those candles build.
Every chart seems to show a triangle or a double top. You want a way to tell which ones deserve attention.
You understand basic technical analysis and want one clear framework: support and resistance first, then the pattern.
After reading it, you can
What the book covers, who it is for, and how to get it.
It teaches chart patterns through support, resistance and market structure: 19 classic patterns in four structural categories, and the four factors that decide whether a pattern deserves attention — structure, volume, height and length.
It helps. Book Two is written as a continuation of Book One, so it does not repeat the basics of technical analysis. If you already read candles comfortably, you can start with Book Two.
The book assumes a basic understanding of technical analysis. If you are new to the subject, read Trading Candlestick Patterns first; it covers the foundations this book builds on.
No. It is educational. The chart examples show how a structure formed and how it can be read; they are not recommendations to buy, sell or hold any security.
The English paperback (ISBN 9788199128118) is available on Amazon India and Flipkart. Any other edition will be announced on this page.
Paperback · first edition, July 2026
19 patterns in four structural categories, each with an annotated real-market chart. Available on Amazon India and Flipkart.
Book details

SEBI Registered Research Analyst · INH000015297
I started studying markets as a student and never stopped. Fourteen years later, everything I build exists for one reason: I needed it myself, and I could not find it built properly anywhere else.
Educational content only. The books and these pages explain how to read candlesticks and chart patterns; they are not investment advice and not a recommendation to buy, sell or hold any security, and no pattern guarantees an outcome. Chart examples are historical and shown for education. Registration granted by SEBI, membership of BASL and certification from NISM in no way guarantee performance of the intermediary or provide any assurance of returns to investors. Investments in the securities market are subject to market risks; read all the related documents carefully before investing.
Trading Candlestick Patterns teaches how single candles and short formations show who is in control. This book builds on it, so the two are best read in order. Book One is in English, Hindi, Gujarati and Marathi.
Essential storage keeps sign-in and preferences working. Optional analytics helps improve the website. Read our Privacy Policy.