
Candlestick pattern library.

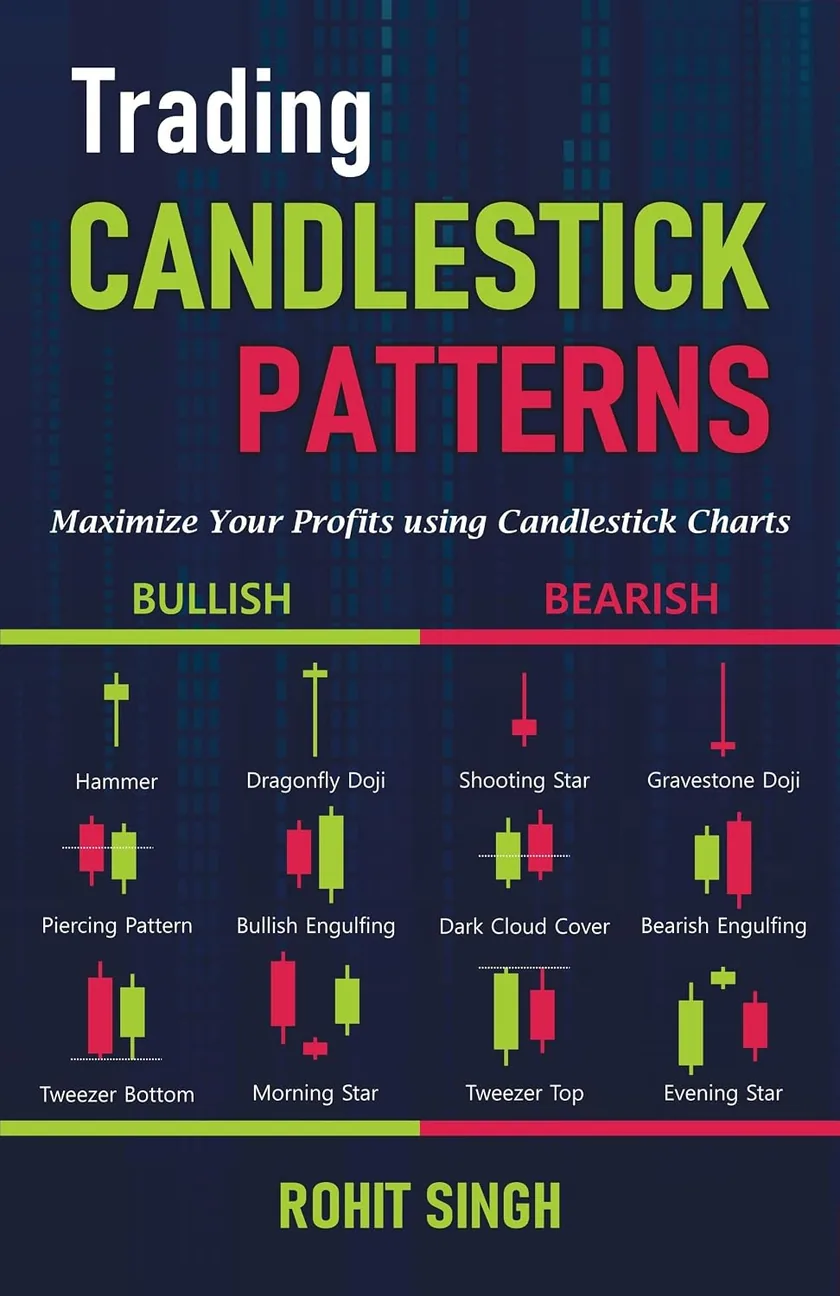
    15 core patterns from the book: how each forms, where it matters, what confirms it and where the idea is proved wrong. Then see which ones are forming now, and watch each take shape candle by candle.

    Bullish
    7
    Bearish
    7
    Neutral
    1
    Signal
    Candles

    Showing 15 of 15

    • Faded candles: the trend before the pattern
    • Highlighted band: the pattern itself
    • Dashed line: the support or resistance it formed at
    • Marked candle: the confirmation
    Ch. 9Single candle

    Bullish Marubozu

    Bullish

    A long green candle with little or no wick. Buyers controlled the session from the open to the close.

    Where it matters

    Most meaningful when it breaks out of a range or closes above a resistance level. Inside a choppy range it says much less.

    In context
    Bullish Marubozu: Most meaningful when it breaks out of a range or closes above a resistance level. Inside a choppy range it says much less.ResistanceConfirm

    How it forms

    Price opens near the low and closes near the high. Sellers could not push it back at any point in the session.

    What confirms it

    The next candles hold above the middle of the Marubozu body. A quick fall back into the body weakens the read.

    Where the idea is wrong

    A close below the low of the Marubozu shows that the buying did not last.

    What volume should do

    Volume clearly above the recent average supports the idea that the move had wide participation.

    Common mistake

    Reacting after a long, extended rally. A large candle late in a move can mark exhaustion rather than strength.

    Opposite pattern: Bearish Marubozu
    Ch. 9Single candle

    Bearish Marubozu

    Bearish

    A long red candle with little or no wick. Sellers controlled the session from the open to the close.

    Where it matters

    Most meaningful when it breaks below a support level or a range. Inside a range it is often just noise.

    In context
    Bearish Marubozu: Most meaningful when it breaks below a support level or a range. Inside a range it is often just noise.SupportConfirm

    How it forms

    Price opens near the high and closes near the low. Buyers could not recover any part of the fall.

    What confirms it

    The next candles stay below the middle of the Marubozu body. A fast recovery into the body weakens the read.

    Where the idea is wrong

    A close above the high of the Marubozu shows that the selling did not last.

    What volume should do

    Volume clearly above the recent average supports the idea that the selling had wide participation.

    Common mistake

    Reacting after a long, steep fall. A large red candle late in a decline can mark capitulation.

    Opposite pattern: Bullish Marubozu

    Ch. 9Single candle

    Hammer

    Bullish

    A small body near the top of the range with a long lower wick, at least twice the body. Buyers rejected the lower prices.

    Where it matters

    Only a Hammer after a decline and at a support zone counts. The same shape in the middle of a range is not a Hammer.

    In context
    Hammer: Only a Hammer after a decline and at a support zone counts. The same shape in the middle of a range is not a Hammer.SupportConfirm

    How it forms

    Price falls sharply during the session, then buyers step in and push it back up close to the open.

    What confirms it

    The next candle closes above the high of the Hammer.

    Where the idea is wrong

    A close below the low of the Hammer’s wick: the level the buyers defended.

    What volume should do

    Higher volume on the Hammer suggests the rejection of lower prices had real participation.

    Common mistake

    Treating every long lower wick as a Hammer without checking the trend before it and the level it formed at.

    Opposite pattern: Shooting Star

    Ch. 9Single candle

    Shooting Star

    Bearish

    A small body near the bottom of the range with a long upper wick, at least twice the body. Sellers rejected the higher prices.

    Where it matters

    Only meaningful after a rise and at a resistance zone. In the middle of a range it carries little weight.

    In context
    Shooting Star: Only meaningful after a rise and at a resistance zone. In the middle of a range it carries little weight.ResistanceConfirm

    How it forms

    Price rallies during the session, then sellers push it back down close to the open.

    What confirms it

    The next candle closes below the low of the Shooting Star.

    Where the idea is wrong

    A close above the high of the upper wick: the level the sellers defended.

    What volume should do

    Higher volume on the rejection candle suggests the selling at the highs had real participation.

    Common mistake

    Ignoring a strong uptrend. One rejection candle rarely turns a healthy trend on its own.

    Opposite pattern: Hammer

    Ch. 9Single candle

    Standard Doji

    Neutral

    The open and the close are equal or nearly equal. Neither buyers nor sellers won the session: the market is undecided.

    Where it matters

    A Doji after a long trend, or at support or resistance, can be an early sign that the trend is tiring.

    In context
    Standard Doji: A Doji after a long trend, or at support or resistance, can be an early sign that the trend is tiring.ResistanceConfirm

    How it forms

    Price moves in both directions during the session but closes at or near the opening price.

    What confirms it

    A Doji is not a signal by itself. The candle that follows shows which side takes control.

    Where the idea is wrong

    There is no direction to invalidate yet. Its high and low become the levels to watch.

    What volume should do

    Usually lower volume. A Doji on unusually high volume at a turning point deserves closer attention.

    Common mistake

    Acting on the Doji alone instead of waiting for the next candle.

    Opposite pattern: Dragonfly Doji

    Ch. 9Single candle

    Dragonfly Doji

    Bullish

    The open, high and close are at the top, with a long lower wick: a “T” shape. Buyers rejected the lows completely.

    Where it matters

    Meaningful after a decline and at a support zone. Elsewhere it is simply indecision.

    In context
    Dragonfly Doji: Meaningful after a decline and at a support zone. Elsewhere it is simply indecision.SupportConfirm

    How it forms

    Price falls sharply during the session, then buyers bring it all the way back to the opening level.

    What confirms it

    The next candle closes above the high of the Dragonfly Doji.

    Where the idea is wrong

    A close below the low of the long lower wick.

    What volume should do

    Higher volume on the Dragonfly suggests the recovery from the lows had participation.

    Common mistake

    Reading it in the middle of a range, where it says very little about direction.

    Opposite pattern: Gravestone Doji

    Ch. 9Single candle

    Gravestone Doji

    Bearish

    The open, low and close are at the bottom, with a long upper wick: an inverted “T”. Sellers rejected the highs completely.

    Where it matters

    Meaningful after a rise and at a resistance zone.

    In context
    Gravestone Doji: Meaningful after a rise and at a resistance zone.ResistanceConfirm

    How it forms

    Price rallies strongly during the session, then sellers push it all the way back to the opening level.

    What confirms it

    The next candle closes below the low of the Gravestone Doji.

    Where the idea is wrong

    A close above the high of the long upper wick.

    What volume should do

    Higher volume on the Gravestone suggests the selling at the highs had participation.

    Common mistake

    Treating it as a reversal in a strong uptrend without any follow-through.

    Opposite pattern: Dragonfly Doji

    Ch. 10Two candles

    Bullish Engulfing

    Bullish

    A green candle whose body completely covers the body of the previous red candle. Control shifts from sellers to buyers.

    Where it matters

    Strongest after a decline and at a support zone. After a sideways drift it is much weaker.

    In context
    Bullish Engulfing: Strongest after a decline and at a support zone. After a sideways drift it is much weaker.SupportConfirm

    How it forms

    Candle 1 is red. Candle 2 opens at or below the close of candle 1 and closes above its open.

    What confirms it

    The next candle holds above the middle of the engulfing body, or closes above its high.

    Where the idea is wrong

    A close below the low of the engulfing candle.

    What volume should do

    Volume on the engulfing candle higher than on the candle before it supports the shift in control.

    Common mistake

    Reading every large green candle as an engulfing pattern without checking the trend and location.

    Opposite pattern: Bearish Engulfing

    Ch. 10Two candles

    Bearish Engulfing

    Bearish

    A red candle whose body completely covers the body of the previous green candle. Control shifts from buyers to sellers.

    Where it matters

    Strongest after a rise and at a resistance zone.

    In context
    Bearish Engulfing: Strongest after a rise and at a resistance zone.ResistanceConfirm

    How it forms

    Candle 1 is green. Candle 2 opens at or above the close of candle 1 and closes below its open.

    What confirms it

    The next candle stays below the middle of the engulfing body, or closes below its low.

    Where the idea is wrong

    A close above the high of the engulfing candle.

    What volume should do

    Volume on the engulfing candle higher than on the candle before it supports the shift in control.

    Common mistake

    Ignoring the larger trend. In a strong uptrend, one engulfing candle is often only a pause.

    Opposite pattern: Bullish Engulfing

    Ch. 10Two candles

    Tweezer Bottom

    Bullish

    Two candles with matching or nearly matching lows. The same price was tested twice and buyers defended it both times.

    Where it matters

    Meaningful at a known support zone after a decline.

    In context
    Tweezer Bottom: Meaningful at a known support zone after a decline.SupportConfirm

    How it forms

    Candle 1 makes a new low. Candle 2 tests the same low but closes higher.

    What confirms it

    A close above the high of the second candle.

    Where the idea is wrong

    A close below the matching lows.

    What volume should do

    Higher volume on the second, bullish candle supports the idea that buyers are defending the level.

    Common mistake

    Accepting lows that only roughly match. The closer the two lows, the clearer the message.

    Opposite pattern: Tweezer Top

    Ch. 10Two candles

    Tweezer Top

    Bearish

    Two candles with matching or nearly matching highs. The same price was tested twice and sellers defended it both times.

    Where it matters

    Meaningful at a known resistance zone after a rise.

    In context
    Tweezer Top: Meaningful at a known resistance zone after a rise.ResistanceConfirm

    How it forms

    Candle 1 makes a new high. Candle 2 reaches the same high but sellers push it back down.

    What confirms it

    A close below the low of the second candle.

    Where the idea is wrong

    A close above the matching highs.

    What volume should do

    Higher volume on the second, bearish candle supports the idea that sellers are defending the level.

    Common mistake

    Reading it in a strong uptrend without any other sign of weakness.

    Opposite pattern: Tweezer Bottom

    Ch. 10Two candles

    Piercing Pattern

    Bullish

    After a red candle, a green candle opens lower and closes above the middle of the red body: it “pierces” into it.

    Where it matters

    Meaningful after a decline and near support.

    In context
    Piercing Pattern: Meaningful after a decline and near support.Support50%Confirm

    How it forms

    Candle 1 is red. Candle 2 opens below its close, then recovers to close above 50% of candle 1’s body.

    What confirms it

    The next candle closes above the high of the piercing candle.

    Where the idea is wrong

    A close below the low of the piercing candle.

    What volume should do

    Higher volume on the second candle than on the first supports the recovery.

    Common mistake

    Accepting a close below the halfway mark. That is a weaker pattern, not a Piercing Pattern.

    Opposite pattern: Dark Cloud Cover

    Ch. 10Two candles

    Dark Cloud Cover

    Bearish

    The bearish opposite of the Piercing Pattern. After a green candle, a red candle opens higher and closes below the middle of the green body.

    Where it matters

    Meaningful after a rise and near resistance.

    In context
    Dark Cloud Cover: Meaningful after a rise and near resistance.Resistance50%Confirm

    How it forms

    Candle 1 is green. Candle 2 opens above its close, then falls to close below 50% of candle 1’s body.

    What confirms it

    The next candle closes below the low of the dark cloud candle.

    Where the idea is wrong

    A close above the high of the dark cloud candle.

    What volume should do

    Higher volume on the second candle than on the first supports the selling.

    Common mistake

    Accepting a close above the halfway mark, which is a much weaker message.

    Opposite pattern: Piercing Pattern

    Ch. 11Three candles

    Morning Star

    Bullish

    A three-candle reversal: a large red candle, a small undecided candle, then a large green candle. The decline loses its force.

    Where it matters

    Most meaningful at a major support zone after a clear decline.

    In context
    Morning Star: Most meaningful at a major support zone after a clear decline.Support50%Confirm

    How it forms

    Candle 1 is a large red candle. Candle 2 has a small body. Candle 3 is a large green candle that closes above the middle of candle 1.

    What confirms it

    The third candle itself is the confirmation; follow-through above its high adds to it.

    Where the idea is wrong

    A close below the low of the middle candle (the “star”).

    What volume should do

    The third candle ideally carries the highest volume of the three.

    Common mistake

    Accepting a third candle that closes only slightly higher. It should recover well into candle 1’s body.

    Opposite pattern: Evening Star

    Ch. 11Three candles

    Evening Star

    Bearish

    A three-candle reversal: a large green candle, a small undecided candle, then a large red candle. The rise loses its force.

    Where it matters

    Most meaningful at a major resistance zone after a clear rise.

    In context
    Evening Star: Most meaningful at a major resistance zone after a clear rise.Resistance50%Confirm

    How it forms

    Candle 1 is a large green candle. Candle 2 has a small body. Candle 3 is a large red candle that closes below the middle of candle 1.

    What confirms it

    The third candle itself is the confirmation; follow-through below its low adds to it.

    Where the idea is wrong

    A close above the high of the middle candle (the “star”).

    What volume should do

    The third candle ideally carries the highest volume of the three.

    Common mistake

    Reading it in the middle of a range, where there is no rise to reverse.

    Opposite pattern: Morning Star

    02Candle Lab

    Build a candle. Read it.

    Drag the open, high, low and close: or use the arrow keys. The lab names the shape and tells you who won the session: the first skill the book teaches.

    HighOpenCloseLow

    Shape

    Strong bullish candle

    Buyers won clearly and closed the session well above the open.

    Who won the sessionBuyers
    Upper wick14%
    Body68%
    Lower wick18%

    A shape is only the first clue. The book reads it with the trend before it, the level it forms at and the candle that follows.

    All 35+ patterns, in context.

    The book reads every pattern with its level, its volume and the candle that follows: in English, Hindi, Gujarati and Marathi.

    As an Amazon Associate, Mr. Chartist earns from qualifying purchases.

    Explore the book

    Privacy settings

    Essential sign-in storage and your saved preferences stay enabled. Analytics is optional, and you can change your choice anytime.

    Turning analytics off clears our analytics cookies and local assistant metrics. The page reloads to stop a previously loaded analytics service. Your account and learning progress stay saved.

    Read the Privacy Policy