The TradingView Community
Leveraging the social trading network to accelerate your learning and refine strategies.
Mr. Chartist Workflow
Read with a trading desk mindset.
Every TradingView article now follows a practical pattern: understand the tool, map it to a charting workflow, apply it on Indian market instruments, and turn it into a repeatable workspace habit.
8
Sections
3m
Read
fundamentals
Level
Open a clean chart and locate the exact TradingView area covered in "The TradingView Community".
Apply it on one liquid NSE stock, one index, and one weekly timeframe so the concept is not learned in isolation.
Save the layout, write one note about what improved your decision-making, and remove anything that adds noise.
TradingView is a charting platform with a publishing layer bolted to the middle of it. Around 100M+ registered users across 180+ countries publish roughly 5,300 pieces of analysis a day, and every one of them is anchored to a live chart rather than to a screenshot. That anchoring is the whole point: an idea published on NSE:RELIANCE in March can be reopened in September with the chart played forward, so anyone can see what price actually did next.
This article covers what that social layer contains — published ideas, the short-form Minds feed, the open-source script library, the people who write it, the paid marketplace sitting alongside it, and the moderation rules that hold the whole thing together. It also covers how to read any of it without getting hurt, which is the part most guides skip.
One framing note before we start. Community analysis on TradingView is user-generated content. It is not research, it is not vetted for accuracy, and no part of this article suggests you act on any of it. In India, distributing buy or sell recommendations for consideration can bring a person within SEBI's regulatory perimeter — a published chart is not a research report, and it should not be read as one.
The Scale of the Network — And Why It Is Built This Way
The social layer was not added to TradingView later as a growth feature. It follows directly from the platform's original design decision: charts live on a server, not on your hard disk. Once a chart with all its drawings has a server-side address, sharing it is simply a matter of giving that address to someone else. Every social feature on the platform — published ideas, Minds posts, one-click script installation — is a consequence of that one architectural choice, which is why they all feel like part of the same thing rather than a forum stapled to the side.
The important structural difference from a general social network is verifiability. When somebody posts a screenshot of a chart on a messaging app, you are looking at a picture, and pictures can be drawn after the fact. When somebody publishes a TradingView idea on NSE:HDFCBANK, the publication is timestamped and the drawings are pinned to specific candles. Six months later, anyone can open that idea and play the chart forward from the publication date. The author cannot quietly move the level afterwards. That does not make the analysis good — it makes it checkable, which is a much lower bar and a much more useful one.
Scale then does something specific for a beginner. On an obscure question — how a particular drawing tool behaves on a weekly BANKNIFTY chart, or why a script is repainting — a platform with tens of millions of accounts has almost certainly answered it already, in a comment, a published tutorial or an open-source script. Small platforms cannot accumulate that. This is the honest benefit of a large user base: documentation density, not collective correctness. A crowd of a hundred million people is not right about the market, and no amount of consensus in an ideas feed changes what price does next.
Published analysis anchored to live charts rather than to static screenshots.
| Features | TradingView | Traditional Brokers |
|---|---|---|
| What gets shared | A live chart with its drawings intact | A static screenshot |
| Checking it later | Reopen and play the chart forward | No way to verify after the fact |
| Anchoring | Pinned to specific candles and timestamps | Detached from the data |
| Tool sharing | One-click install of open-source scripts | Manual file transfer |
| Moderation | Published rules against spam and signal selling | Varies widely |
The useful property of a published TradingView idea is not that many people saw it. It is that nobody can move the level after the fact.
Snapshot & Takeaways
Create, Share, Learn, Collaborate — How the Loop Works
TradingView organises its social features around a loop: you create analysis on a live chart, you publish it, you get feedback or compare it against what others marked on the same instrument, and you refine your approach. Each stage does something specific to how you think, and the first one does the most work. The act of preparing a chart for publication forces you to state what you actually see — where the level is, why it matters, what would prove you wrong — instead of holding a vague impression that quietly reshapes itself to fit whatever price does.
Sharing adds a cost that turns out to be productive. A published idea is a commitment with a timestamp on it. You cannot revise it afterwards into something that was right all along, and knowing that in advance changes how carefully you write it. Most traders find their first few published ideas noticeably more disciplined than the private notes they had been keeping, for no reason other than that somebody might read them.
Learning here mostly means comparison rather than instruction. Pull up the published ideas on an instrument you have already analysed yourself — NSE:INFY, say — after you have marked your own levels. Where another author drew a level you missed, the interesting question is what they were looking at that you were not. Where they drew one you disagree with, articulating the disagreement is the exercise. Reading analysis before doing your own inverts this and mostly teaches you to copy.
Collaboration is the weakest of the four in practice, and it is worth being realistic. Comment threads on popular ideas fill with noise, and agreement in a comment section is not evidence. The parts that do work are narrower: a specific technical question about a script, a correction from someone who noticed your anchor was two ticks off, or a conversation with two or three authors whose reasoning you have followed long enough to judge.
Create
- Build annotated analysis directly on the live chart
- Write custom studies and tools in Pine Script
- Record a screen-share walkthrough explaining the reasoning
- Use the full drawing toolbar to mark structure precisely
Share
- Publish an idea that stays pinned to the candles it was drawn on
- A timestamp you cannot revise later — the useful discipline
- Editors' Picks curation surfaces higher-effort work
- Share as a link, or embed the chart elsewhere
Learn
- Compare your own marked chart against other authors' on the same symbol
- Study how experienced chartists state invalidation, not just entry
- Filter Education-tagged ideas for structured explanations
- Read the source of open-source scripts to see how a calculation is built
Collaborate
- Ask specific technical questions on scripts and tools
- Public and private messaging for follow-up discussion
- Corrections from readers who spot a misplaced anchor
- Track a small number of authors long enough to judge their reasoning
Snapshot & Takeaways
Trading Ideas — And How to Read Them Safely
A published idea is a chart with its drawings intact, a title, and a written explanation. Ideas are tagged either as trading ideas — a specific structural view, usually with a level, a target and an invalidation point — or as education, which explains a method rather than making a call. The Editors' Picks section is a curated selection chosen by TradingView's editorial team, and curation there is about effort and clarity rather than about anyone judging whether a view is correct.
The mechanism that makes ideas useful is replay. Because the drawings are anchored to specific candles and the publication carries a timestamp, opening an old idea and playing the chart forward shows you exactly what happened after the author committed. Do this deliberately and it becomes the most instructive thing in the community layer: pick an author, open six of their older ideas, and watch each one play out. You will learn more about how they think in an hour than from a month of reading their new posts, and you will find out quickly whether they publish only the ones that worked.
The safe way to use the feed is to filter it to one symbol and read it after your own analysis. Search NSE:RELIANCE or BANKNIFTY and you get every published view on that instrument. Read them once you have already marked your own chart, and treat each as a question: what did this author see at this candle that I did not? Read the other way round and the feed becomes a source of borrowed conviction, which is the single most expensive way to use it.
Two cautions. First, published ideas are user-generated content, not research — nobody checks them for accuracy, and there is no obligation on any author to disclose a position. Second, in India, distributing buy or sell recommendations for consideration is a regulated activity, and a chart published to a global platform is not a substitute for advice from someone registered to give it. Read for method, not for calls.
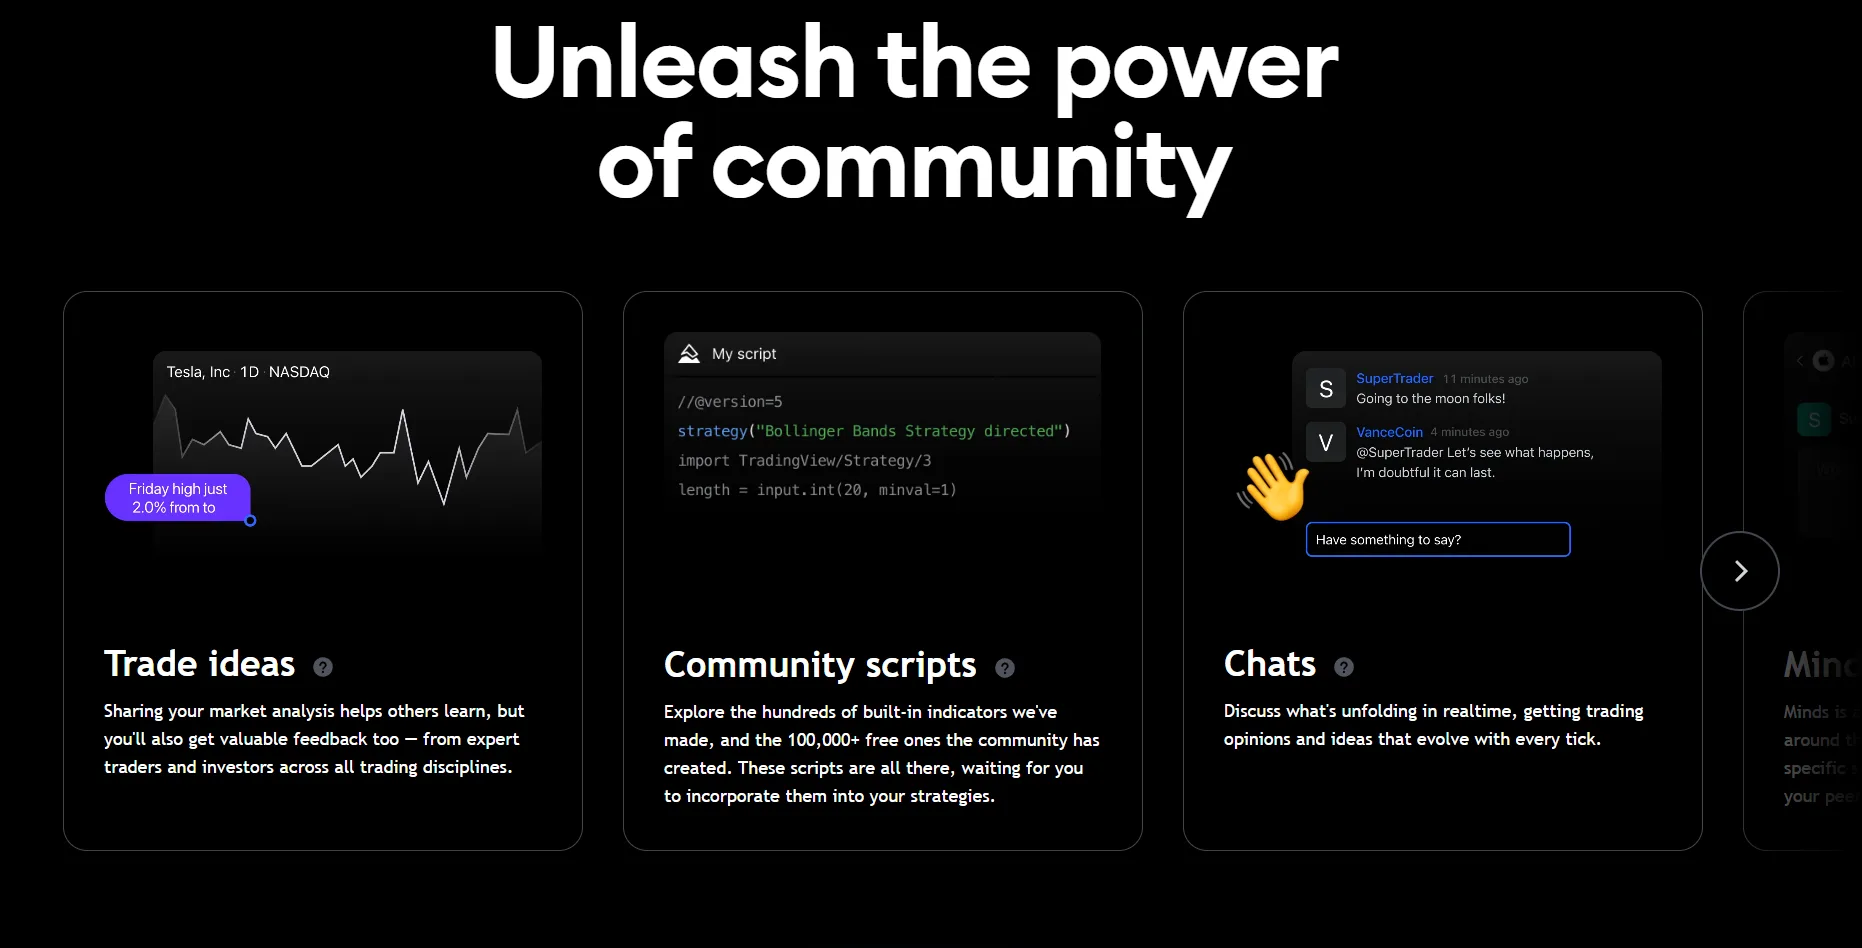
The Ideas feed, filtered to a single symbol — the only way it is genuinely useful.
How the Feed Is Organised
- Trading Ideas: a structural view with a level, a target and a stated invalidation
- Education Ideas: explanations of a method or a tool, with no call attached
- Video Ideas: recorded walkthroughs where the author narrates the reasoning
- Symbol filter: restrict the feed to NSE:RELIANCE, NSE:TCS or BANKNIFTY only
- Editors' Picks: curated for effort and clarity, not for being right
Snapshot & Takeaways
Critical Warning
Never size a position off somebody else's published idea. You do not know their timeframe, their risk tolerance, whether they still hold the view, or whether they have already exited. The chart is visible; none of the context that would make it actionable is.
Minds — Short-Form Commentary, Anchored to a Symbol
Minds is TradingView's short-form feed — the closest thing on the platform to a social timeline, except that every post is attached to an instrument rather than floating in a general stream. Post about NIFTY 50 and it appears to people following NIFTY 50, next to the chart they are already looking at. The result is that the commentary you see is scoped to what you are analysing, which removes most of the irrelevance that makes general social media useless during market hours.
It is genuinely useful for one narrow thing: noticing that something is happening. When a stock you hold moves sharply at 11:40 IST and you were not watching, the Minds feed for that symbol is often the fastest place to find out whether there is a news reason, a block deal, an index-related flow, or nothing identifiable at all. That is a lead to check, not an answer — but knowing where to start looking is worth something.
It is not useful as a source of conviction, and the failure mode is well documented across every trading community that has ever existed. Short posts have no room for reasoning, so what circulates is assertion. Agreement spreads faster than analysis. During a sharp move the feed will be uniformly bullish or uniformly bearish, and that uniformity tells you about the mood of the people posting, not about the instrument. Traders who read Minds during a drawdown on their own position are, in practice, shopping for reassurance.
The workable discipline is to treat Minds as an input to your own checking rather than a conclusion. Follow a small number of accounts whose reasoning you have watched over time. Mute the rest. And keep the feed closed while you are making a decision — open it afterwards, if at all.
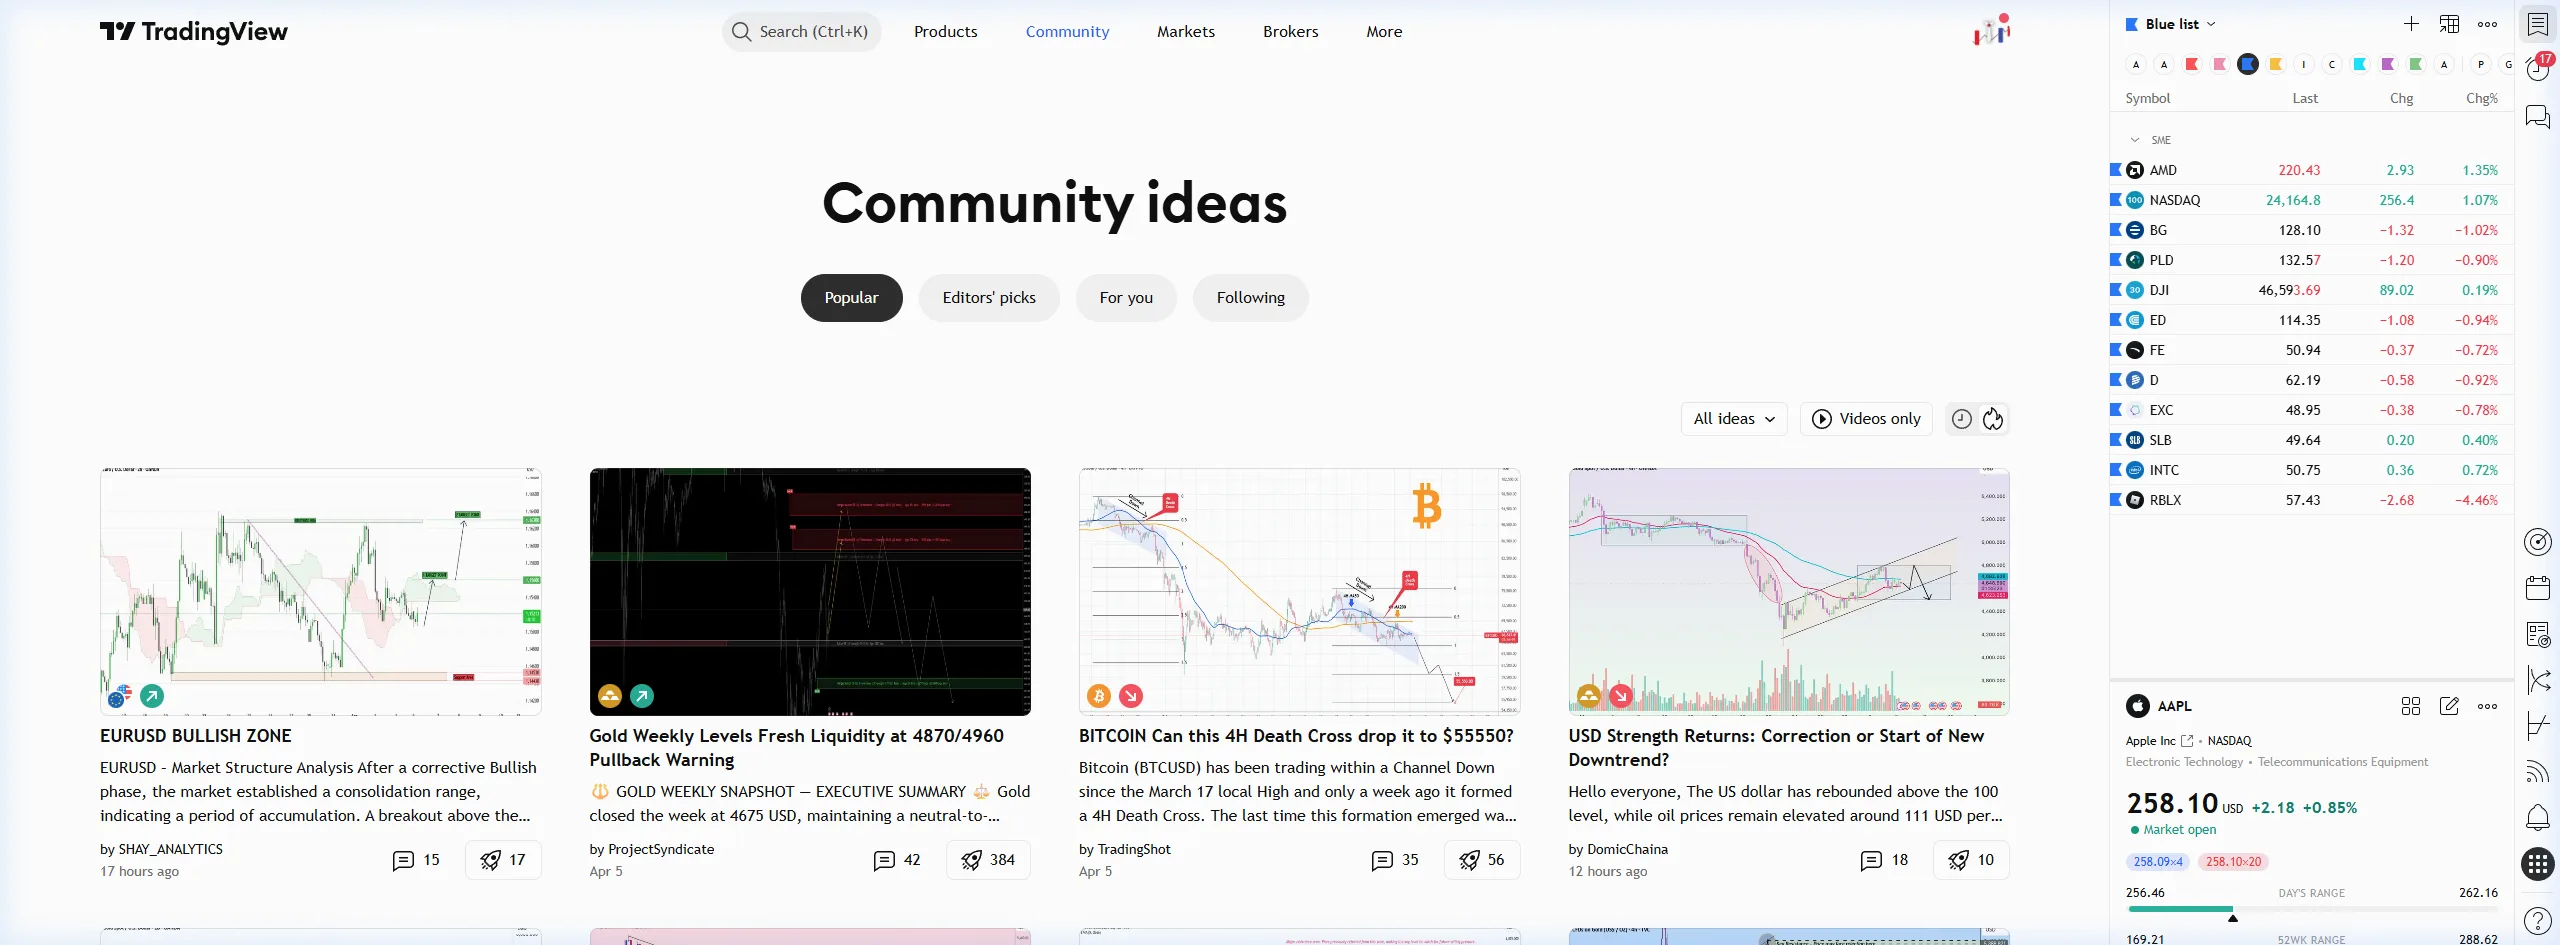
Minds posts attach to the instrument rather than to a general timeline.
What Minds Actually Does
- Short posts attached to a specific symbol rather than to a general timeline
- Symbol-scoped feeds for NIFTY 50, BANKNIFTY and individual NSE listings
- Follow and unfollow to control what reaches you
- Threaded replies for follow-up questions
- Updates through the session, which makes it a fast way to notice an unexplained move
Minds is a good early-warning system and a poor decision input. Use it to find out that something happened, then go and look at the chart yourself.
Snapshot & Takeaways
Community Scripts and the Pine Wizards
TradingView hosts what is probably the largest open library of charting tools anywhere: over 100,000+ scripts published by users, written in Pine Script and installable on your chart with one click. They range from a plain moving-average overlay to volume-profile implementations, session markers built for Indian market hours, and pattern-detection tools. Most are published with their source code visible, which is the property that matters most — an open script can be read, and a script you can read is one you can decide whether to trust.
That decision is worth taking seriously, because a chart study is a calculation and calculations can be wrong or misleading in ways that are invisible from the output. The specific thing to check for is repainting: a script that changes what it drew on past candles once new data arrives. A repainting script produces a backtest and a historical chart that look excellent and could never have been traded, because the marks were not there at the time. Reading the source, or testing the script under Bar Replay so that future candles are hidden, is how you catch it.
The most prolific authors are recognised as Pine Script Wizards, a designation TradingView awards for sustained open-source contribution. Names like LazyBear, whose early library much of the ecosystem was built on, LuxAlgo, jdehorty, KioseffTrading and LucF appear repeatedly. The designation reflects contribution and code quality — it is not an endorsement of anyone's market views, and there is no performance assessment attached to it whatsoever.
For learning, the library has a second use that has nothing to do with trading with it. Reading a well-written open script is the fastest way to understand how a calculation you have heard about is actually constructed. Open a volume-profile script and you will understand what a value area is by seeing it computed, which is a much firmer grasp than any description gives you.
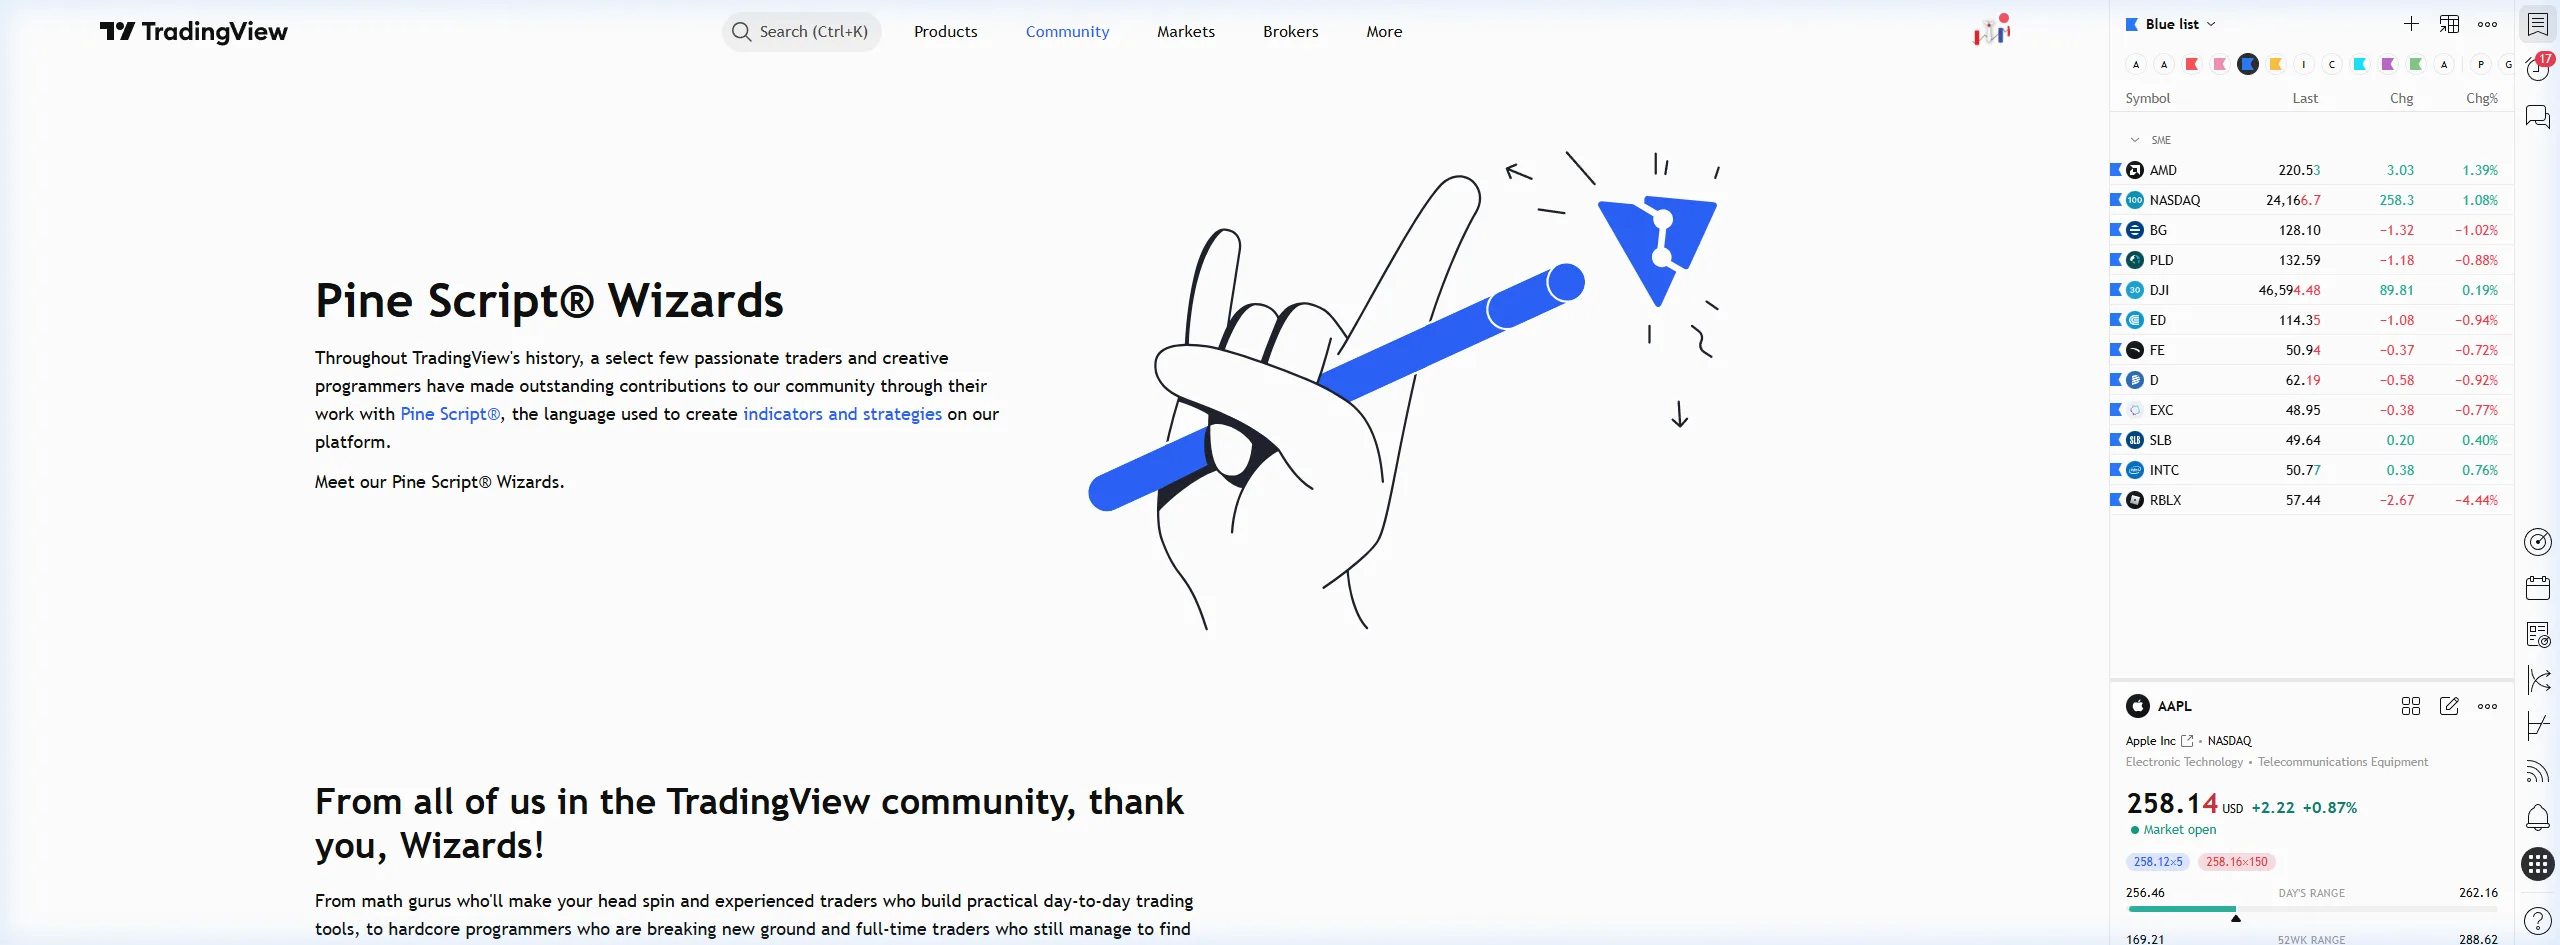
The Pine Wizards page — authors recognised for long-running open-source contributions.
The Open Library
- 100,000+ user-published scripts, installable on the chart in one click
- Most publish full source code, so the calculation can be read before it is trusted
- Editors' Picks highlights well-built, well-documented scripts
- Check for repainting — scripts that redraw past candles once new data arrives
- Bar Replay hides future candles and is the practical way to test for it
Snapshot & Takeaways
Professional Tip
When you add an unfamiliar script, open its source and find the line where it references historical data. If it uses the current, still-forming candle to decide what to draw on earlier candles, expect the historical chart to look better than the tool could ever have performed live.
The Commercial Layer — Paid Spaces and Freelance Scripts
Not everything on the platform is free. Paid Spaces is a marketplace where authors sell subscription access to closed-source scripts, and a separate freelance directory connects users who want a custom tool built with developers who write Pine Script for a fee. Both are official TradingView products with their own terms, and both sit next to the free library rather than replacing it.
This article does not publish price ranges, earnings figures or income claims for either, and you should be sceptical of sources that do. Third-party earnings numbers are unverifiable, they are almost always selected from the top of a distribution, and presenting them as an opportunity is a marketing technique rather than information. What the marketplace is, factually, is a place where some tools cost money.
The buyer's caution is straightforward and follows from the previous section. A paid script is usually closed source, which means the one property that let you evaluate a free script — reading the calculation — is gone. You are being asked to trust an output you cannot inspect, often accompanied by a historical chart that you also cannot verify for repainting. If you are considering one, ask for the logic in plain terms, test it under Bar Replay on instruments and periods the seller did not choose, and treat any performance claim attached to it as unverified. Marketing that emphasises results rather than method is itself the signal.
There is also an Indian regulatory dimension worth stating plainly. Selling trading signals or recommendations for consideration is a regulated activity in India, and a script that outputs buy and sell instructions sits closer to that line than a tool that draws a level. If you are considering publishing commercially rather than buying, understand your own obligations before you take money from anyone.
Alongside the free library sits a paid marketplace, with the usual cautions attached.
Snapshot & Takeaways
Critical Warning
No tool, paid or free, produces a reliable outcome on its own, and nobody selling one can honestly tell you what it will do for your account. Any offer framed around expected returns should be treated as a reason to walk away rather than as a description of the product.
House Rules, Moderation and Reading Critically
TradingView publishes House Rules and enforces them with a mix of automated systems and community moderators. The prohibitions that matter are on spam, on selling signals inside published ideas, and on posts that make a call with no analysis behind it. An idea that says nothing but NIFTY going up is removed. This moderation is genuinely why the ideas feed is more readable than most trading content on the open internet, and it is a real difference from platforms where anything goes.
It is important to understand exactly what moderation guarantees, which is less than people assume. It ensures that a published idea contains reasoning. It does not check that the reasoning is sound, that the level is well chosen, that the author holds the position they describe, or that the analysis is anything other than confident nonsense presented tidily. Moderation raises the floor of the content. It does nothing to the ceiling, and it makes no assessment of accuracy at all.
So the reading discipline has to come from you, and three habits carry most of the weight. First, look for a stated invalidation — the price or condition at which the author's view is wrong. Analysis without one is not a view, it is a hope, and it is the most common defect in published ideas. Second, check whether the author publishes their unfinished and failed setups as well as their good ones; a feed containing only successes tells you about their editing, not their analysis. Third, judge over months. A single call being right is noise, and the number of published ideas that were correct is not information about anything.
Finally, keep the regulatory position straight in your head. Nothing published by another user is research, none of it is prepared for your circumstances, and in India the distribution of recommendations for consideration is a registered activity. Read the community layer for method — how a level is chosen, how a structure is described, how invalidation is stated — and go elsewhere for anything you would act on.
Moderation raises the floor of what gets published. It does not raise the ceiling of what is true.
Snapshot & Takeaways
Critical Warning
Publishing vague calls without reasoning gets them removed, and rightly so. If you publish, include the chart, the structure you are relying on, and the level at which you would consider yourself wrong.
Using the Community for Indian Markets — A Starting Routine
Every social surface on the platform filters by symbol, and for an Indian trader that is the feature that makes it usable at all. Ideas, Minds and scripts can all be restricted to NSE, BSE and MCX instruments, so a search for NSE:RELIANCE, NSE:TCS, NSE:HDFCBANK or BANKNIFTY returns analysis on the thing you are actually trading rather than a global feed dominated by US large caps and crypto. Indian authors publish daily on the index and on liquid cash-market names, and there are scripts built specifically around Indian session hours, including tools that mark the 09:15 to 15:30 IST session boundaries and the expiry-day behaviour of index derivatives.
A sensible starting routine has four steps and takes a few weeks. Step one: pick two instruments you will follow properly — NIFTY 50 and one liquid cash-market name is plenty — and mark your own daily charts before you read anything. Step two: open the filtered idea feed for those two symbols and compare, asking only what someone else saw that you did not. Step three: pick three or four authors from that comparison and read their older ideas played forward, which is how you find out whether their process holds up. Step four: publish something yourself, even a simple support-and-resistance chart, because the discipline of committing in writing is where most of the benefit is.
What to avoid is equally specific. Do not follow fifty accounts; you will end up with fifty views and no method. Do not treat the volume of bullish posts on a symbol as confirmation. Do not act on an idea because it is on the Editors' Picks page, which curates for clarity rather than for correctness. And do not let the feed be the first thing you look at, because the order in which you read determines whether you are learning or borrowing.
Used this way the community layer is a study aid: a large, free, timestamped archive of other people marking the same charts you are marking, with the outcomes attached. That is a genuinely unusual resource. It is not a source of trade ideas, and the moment you start using it as one it stops being useful.
Data source
Delayed data Free | Real-time data Non-professional fees, per month | Real-time data Professional fees, per month | |
|---|---|---|---|
| 15 min | ₹0 | ₹0 | |
| 15 min | ₹422 | ₹2,870 | |
| 15 min | ₹176 | ₹176 | |
Metropolitan Stock Exchange MSE · India 🇮🇳 FUTURES | N/A | ₹0 | N/A |
| N/A | ₹0 | ₹0 | |
National Commodity & Derivatives Ex NCDEX · India 🇮🇳 FUTURESINDICES | N/A | ₹0 | N/A |
Every social surface on the platform can be filtered down to NSE, BSE and MCX symbols.
Filtering to Indian Markets
- Restrict any feed by exchange — NSE, BSE or MCX
- Symbol search on NSE:RELIANCE, NSE:INFY, NIFTY 50 or BANKNIFTY
- Scripts built for Indian session hours and index expiry behaviour
- Indian authors publishing daily on the index and liquid cash-market names
A Four-Step Starting Routine
- 1. Mark your own daily charts on two instruments before reading anything
- 2. Open the filtered feed for those symbols and compare, one question only: what did they see?
- 3. Read three or four authors' older ideas played forward to judge their process
- 4. Publish one of your own, with the level and the invalidation stated
Treat the community as a timestamped archive of other people marking the same charts you are marking. That is a study aid. It is not a source of trades.
Snapshot & Takeaways
Unlock TradingView Pro
Gain unrestricted access to multiple charts, custom timeframes, and unlimited technical indicators to perfect your edge.
Frequently Asked Questions
Common questions about this topic
Open a chart, add your analysis, then use the Publish control in the top-right corner. Choose whether it is a trading idea or an education post, add a title and a written explanation of what you are looking at, and publish. The idea stays anchored to the candles it was drawn on and carries a timestamp, so anyone — including you — can reopen it later and play the chart forward. Include the level you are relying on and the price at which you would consider the view wrong; ideas published without reasoning are removed by moderators.
Official TradingView Resources
Curated links from TradingView's Help Center & Blog
There are no ideas in my profile, where can I find them?
If you don't see published ideas in your profile, there are two possible reasons:You might have published the idea on a different language version of ...
Social Security Rate (SSR)
Social security rate.All countries for which SSR is available are listed below:AlbaniaAlgeriaAngolaArgentinaArmeniaAustraliaAustriaAzerbaijanBahamasBa...
Social Security Rate For Employees (SSRE)
Social security rate for employees.All countries for which SSRE is available are listed below:AlbaniaAlgeriaAngolaArgentinaArmeniaAustraliaAustriaAzer...
Social Security Rate For Companies (SSRC)
Social security rate for companies.All countries for which SSRC is available are listed below:AlbaniaAlgeriaAngolaArgentinaArmeniaAustraliaAustriaAzer...
Even more data for the crypto community: 16 new DEXs available on TradingView
Read fresh TradingView updates: Even more data for the crypto community: 16 new DEXs available on TradingView. Discover more in our blog and stay connected with the latest platform news.
The 2022 TradingView Community Awards
Read fresh TradingView updates: The 2022 TradingView Community Awards. Discover more in our blog and stay connected with the latest platform news.
Changes to Script Publishing on TradingView
Read fresh TradingView updates: Changes to Script Publishing on TradingView. Discover more in our blog and stay connected with the latest platform news.
Ideas on the chart
Read fresh TradingView updates: Ideas on the chart. Discover more in our blog and stay connected with the latest platform news.
Related Articles
Continue your learning journey
Introduction to Pine Script
The basics of TradingView's proprietary programming language for building custom indicators.
ModuleWhat is TradingView?
A complete introduction to TradingView — the world's most powerful charting platform trusted by 100 million traders. Supercharts, Pine Script, screeners, and why it dominates.
ModuleWhy Choose TradingView?
Six compelling advantages that make TradingView the preferred platform for traders worldwide.

Written By
Rohit Singh
Mr. Chartist
With 14+ years of experience in Indian financial markets, Rohit Singh (Mr. Chartist) is a SEBI Registered Research Analyst, Amazon #1 bestselling author, and the founder of Investology — a premium trading ecosystem trusted by a 1.5 Lakh+ strong community across India.
TradingView is a registered trademark of TradingView, Inc. All screenshots, logos, and platform imagery are the property of TradingView, Inc. and are used here for educational purposes only under fair use. This content is not affiliated with, endorsed, or sponsored by TradingView.
(c) 2026 TradingView, Inc. All rights reserved. - www.tradingview.com