

FII & DII Data.
See every day how much foreign and domestic institutions bought or sold in Indian shares, with F&O positions and sector flows.
Rohit Singh | Mr. ChartistAuthor and builder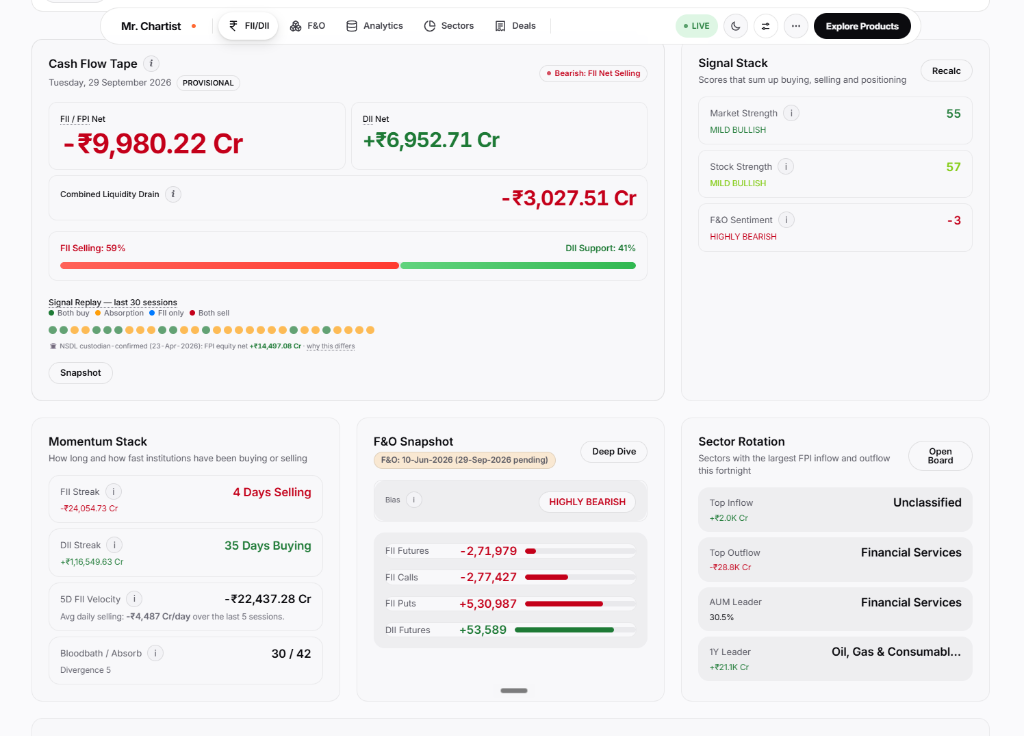


- Runs on
- Your computer
- Setup
- About 5 minutes
- Licence
- Personal Use Only
- Updated
- Node.js
- Express
- Vanilla JS
- Chart.js
- PWA
What you get.
Daily FII and DII buying and selling, with a simple strength meter and streaks.
Index F&O positions of each participant type (FII, DII, Pro, Client).
Fortnightly FPI sector allocation across 24 sectors.
Charts you can export as an image. It also works offline as an app.
Real-Time Cash Flow Tape — FII/FPI Net vs DII Net with flow direction accent, combined liquidity drain, and 30-session Signal Replay dot matrix.
Flow Strength Meter — Visual split ratio displaying FII aggressive selling vs DII domestic absorption support percentage.
Streak & Velocity Trackers — Tracks consecutive buying/selling days with cumulative capital flow and 5-day moving velocity.
F&O Derivatives Positioning — Sentiment classification (Highly Bearish to Bullish), participant-wise OI across Futures, Calls, and Puts with 20-period trajectory.
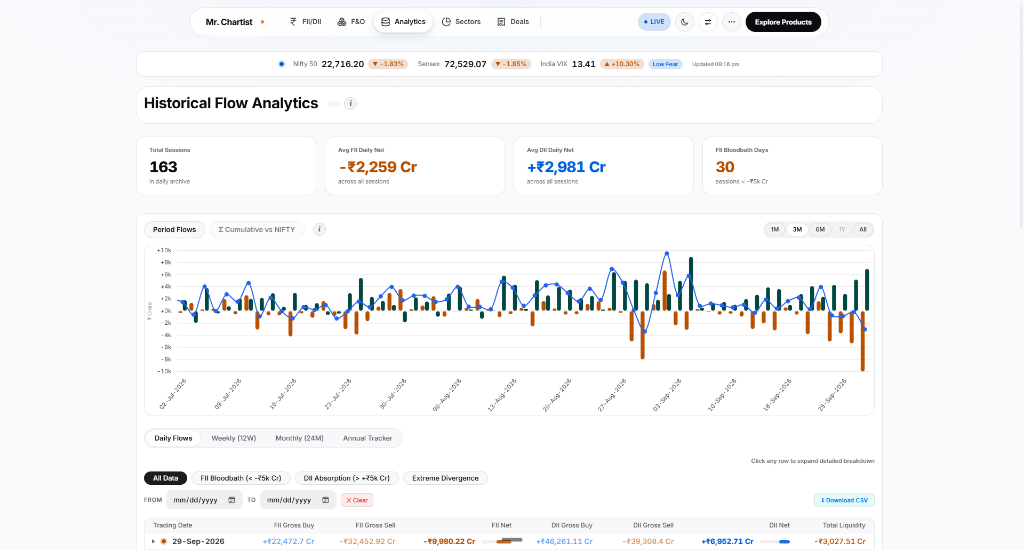
Flow Analytics Multi-Timeframe Matrix — Interactive 8-month Chart.js flow visualization with Daily, Weekly (12W), Monthly (24M), and Annual archives.
Smart Institutional Filters — Instant one-click screening for FII Bloodbath (< -₹5,000 Cr), DII Absorption (> +₹5,000 Cr), and Extreme Divergence.
24-Sector NSDL Allocation — Sector cards with AUM %, FII Ownership %, real-time sparklines, 1Y Structural Flow, and Momentum Alpha.
24-Fortnight Sector Zoom Modal — Full-screen modal with multi-fortnight trend history, toggleable Bar / Line / Scatter charts, and sort filters.
Automated Express Cron Engine — Background node-cron scheduler fetching NSE TRDREQ data at 18:00, 18:30, and 19:00 IST on trading days.
6 REST API Endpoints — Clean JSON endpoints (/api/data, /api/history, /api/history-full, /api/sectors, /api/market, /api/status) with POST /api/refresh.
2026 Agentic AI Roadmap — Acts as the institutional Regime Detection Feed powering Regime Trigger Agents, Sector Rotation Monitors, and Divergence Alerts.
PWA & Export Suite — Progressive Web App with offline service worker, dark/light themes, html2canvas screenshot capture, and Telegram alerts.
Inside FII & DII Data.
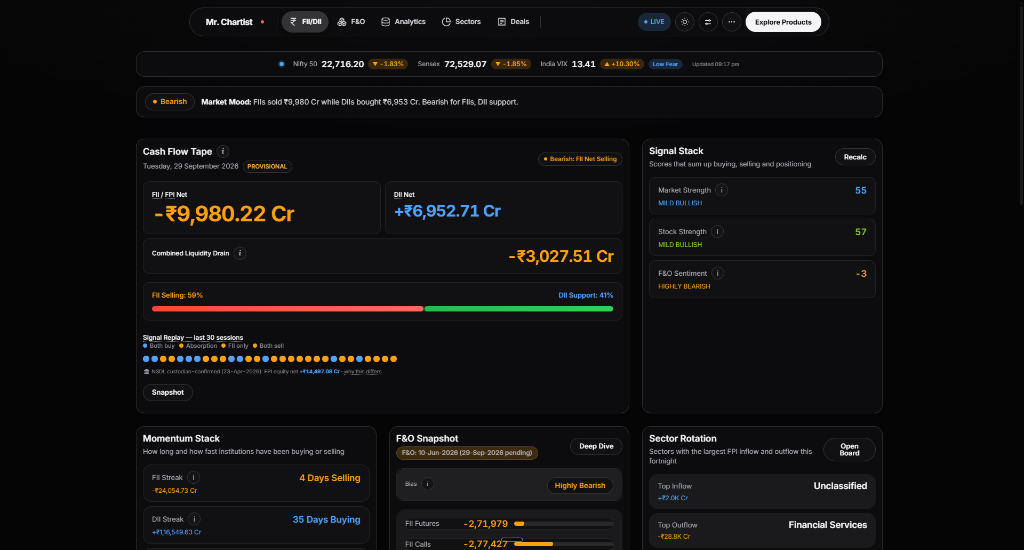
Institutional Telemetry
Cash Flow Tape & Market Mood
Live banner: FIIs sold ₹9,980.22 Cr while DIIs bought ₹6,952.71 Cr. Strong domestic absorption support
Aggressive foreign institutional sell-off recorded in cash equity
Domestic institutions absorbing sell pressure via sustained SIP flows
Net liquidity extracted from the secondary cash market
Proportional split ratio between sellers and domestic buyers
Mild Bullish market/stock strength vs Highly Bearish F&O sentiment
FII Streak -₹24,054 Cr vs DII Streak +₹1,16,550 Cr; 5D Velocity -₹22,437 Cr
FII short bias: -2,71,979 Futures, -2,77,427 Calls, +5,30,987 Puts
Financial Services holds 30.5% AUM; Oil & Gas leads 1Y with +₹21.1K Cr
Run it on your computer.
You need
- Node.js 18 or higher
- Git
- About 5 minutes
- Internet (to fetch NSE data)
git clone https://github.com/MrChartist/fii-dii-data.git
cd fii-dii-data
npm install
node scripts/seed_history.js
node scripts/seed_sectors.js
npm start
Prefer step by step?
- 1Clone the repository: git clone https://github.com/MrChartist/fii-dii-data.git && cd fii-dii-data
- 2Run npm install to install Express and all dependencies.
- 3Seed historical data: node scripts/seed_history.js and node scripts/seed_sectors.js (first time only).
- 4Start the server: npm start — runs on http://localhost:3000.
- 5For development with auto-reload: npm run dev.
- 6For production (Hostinger/VPS): NODE_ENV=production node server.js or use PM2: pm2 start server.js --name fii-dii.
Let an AI install it for you.
Claude
You need
- Repo access
- README context
- Terminal if using Claude Code
You are my setup assistant. Install and run "FII & DII Data" on my computer, then confirm it works. I am not a developer, so explain every step in simple English.

Repository: https://github.com/MrChartist/fii-dii-data
What it is: See every day how much foreign and domestic institutions bought or sold in Indian shares, with F&O positions and sector flows.
Built with: Node.js · Express · Vanilla JS · Chart.js · PWA

Rules
1. Ask which operating system I use (Windows, macOS or Linux) and give commands for that system only.
2. Check what is already installed (Git, Node.js or Python versions) before installing anything. If something is missing, tell me where to download it and wait.
3. Ask me before installing anything globally or changing system settings.
4. Never ask me to paste passwords or API keys into this chat. If a key is needed, tell me which file to put it in.
5. Do not edit the project's source code unless I ask.
6. Read the README first. If it disagrees with the steps below, follow the README and tell me why.

Steps from the guide
1. Clone the repository: git clone https://github.com/MrChartist/fii-dii-data.git && cd fii-dii-data
2. Run npm install to install Express and all dependencies.
3. Seed historical data: node scripts/seed_history.js and node scripts/seed_sectors.js (first time only).
4. Start the server: npm start — runs on http://localhost:3000.

When the steps are done
- Start the app and tell me the exact address to open. Expected address: http://localhost:3000
- If an error appears, read it, fix the cause and retry. After three failed attempts, stop and explain the problem simply.
- Finish with five short lines: what the app does, how to start it again, how to stop it, where its data is stored, and one thing I can try first.
- This is an information tool. It is not investment advice.

If you can run a terminal (Claude Code), do it yourself. If you are chat only, give me one command block at a time and wait for me to reply before the next.
- Ask the AI to inspect the repo structure: server.js Express endpoints, cron schedule, and frontend Chart.js modules.
- Ask it to explain the 5-tab architecture and how each tab fetches data from the Express API.
- Ask it to trace the Flow Strength Meter formula, Momentum Alpha calculation, and streak logic.
- Ask it to identify the sector data structures: NSDL FPI Reports, seed_sectors.js, data/sectors.json, and /api/sectors.
- Ask it to add one focused feature: a new smart filter, a Telegram alert trigger, or a custom date-range view.
Under the hood.
REST API Endpoints
Autonomous Institutional Regime Detection
In our multi-agent trading ecosystem, FII & DII Data serves as the central Macro Regime Detection Feed. Rather than executing trades in isolation, autonomous AI agents subscribe to this feed to synchronize their exposure, risk sizing, and sector tilts with smart money flows.
Regime Trigger Agent
Monitors consecutive institutional sell streaks (< -₹5,000 Cr/day) and automatically throttles execution risk parameters in connected trading tools to 'Conservative'.
Sector Rotation Monitor
Tracks fortnightly NSDL FPI allocation delta; issues autonomous alerts when smart money begins persistent structural outflow from key watchlist sectors.
Flow Divergence Alert
Detects historical divergence extremes between aggressive FII offloading and record DII absorption to signal potential macro pivot zones.
Questions about FII & DII Data.
Run it, then read the code.
Run the seed scripts first to populate historical data, then start the server and explore each tab to understand the 5-tab architecture before making changes.